There is a well-documented global pattern of species shifting their ranges in the direction of changing climate conditions (Perry et al., 2005; Cheung et al., 2009; Chen et al., 2011; Pinsky et al., 2013). Long-lived mobile species, like marine mammals, should be able to track their bioclimate envelopes and other changing conditions, shifting their ranges in response. Because climate change is affecting ecosystems with increasing immediacy, we need to know whether our current understanding of range shifts yields effective conservation and management strategies.
Since 2004, the Gulf of Maine has been one of the fastest warming ocean ecosystems on the planet, as measured by sea surface temperature (Pershing et al., 2015). The rapid rate of warming has been punctuated by sudden ecosystem changes with economic consequences, primarily to fisheries, where sudden temperature changes are not well accounted for in management (Mills et al., 2013; Pershing et al., 2015, 2018; Neckles et al., 2015). Recent changes in the Gulf of Maine provide an opportunity to test our assumptions about how species respond to rapid warming.
A striking change has occurred within the endangered North Atlantic right whale population (Eubalaena glacialis, pop. ~450; Pace et al., 2017). E. glacialis is not listed among mammals negatively impacted by climate change (Pacifici et al., 2017) and, under the range-shift paradigm, this highly mobile species should be able to follow favorable conditions. Successful management of the species has relied on its historically regular seasonal migrations, moving from specific foraging grounds in the western Gulf of Maine in winter and spring to the eastern Gulf of Maine and Scotian Shelf in the summer and autumn. These movements track the abundance of this species’ main prey, late stages of the lipid-rich copepod Calanus finmarchicus (Murison et al., 1989; Mayo and Marx, 1990; Beardsley et al., 1996; Pendleton et al., 2009, 2012). Right whales began to deviate from their typical foraging migration pattern between 2008 and 2010. Their health has since declined (Rolland et al., 2016), and recovery has stalled (Kraus et al., 2016; Davis et al., 2017; Pace et al., 2017). In 2017, at least 17 whales died, and no calves were born in 2018, raising new alarm that E. glacialis may be extinct within 30 years (Stokstad 2017; Meyer-Gutbrod and Greene, 2018). The predominant hypothesis is that a warming-driven northward shift of C. finmarchicus has driven whales into regions where protections to minimize ship strikes or fishing-gear entanglements do not yet exist (Daoust et al., 2017; Stokstad, 2017; Pettis et al., 2018; Meyer-Gutbrod et al., 2018). However, the western Gulf of Maine has meanwhile had record-high abundance measurements of C. finmarchicus since 2010 (Runge et al., 2015), apparently contradicting this hypothesis.
“Recent changes in the Gulf of Maine provide an opportunity to test our assumptions about how species respond to rapid warming.”
We tested the hypothesis that E. glacialis changes relate to recent rapid changes in climate and prey. Most analyses of rapid ocean warming have focused on sea surface temperature because of the broad coverage of satellite measurements (Pershing et al., 2015; Di Lorenzo and Mantua, 2016; Thomas et al., 2017). However, a large amount of excess heat energy is found in subsurface waters (Jewett and Romanou, 2017), and much of the climate-driven warming in the Gulf of Maine is predicted to occur at depth (Saba et al., 2016). The C. finmarchicus life cycle depends on seasonal deepwater temperatures because of its annual dormancy period, which occurs from late summer through winter at depths below 100 m in the Gulf of Maine. To test our hypothesis, we aggregated data from oceanographic buoys, transects, and multiple zooplankton and whale surveys from around the Gulf of Maine (Figure 1 and Supplementary Figure S1), focusing on the period of rapid warming (2004–present) both at the surface and at depth. Based on the shift in the right whale population occurring around 2010 (Kraus et al., 2016), we subdivided data into early (2004–2008) and late (2012–2016) periods and compared time-series data between these two periods using a Mann-Whitney rank sum comparison test (Gibbons et al., 2011). Focusing on areas where spatial and temporal overlap would suggest the possibility of a causal effect between variables, we also tested correlations between interannual time series across data sets. These two complementary approaches pulled out both stepwise and more continuous shifts over the recent warming time period and highlighted probable oceanographic linkages between variables. We oriented much of our interpretation around an oceanographic transport pathway determined by back-tracking currents from the Bay of Fundy feeding grounds (Figure S2). Specific details for processing of each data set and for computing the oceanography are described in the Materials and Methods in the online supplementary materials.
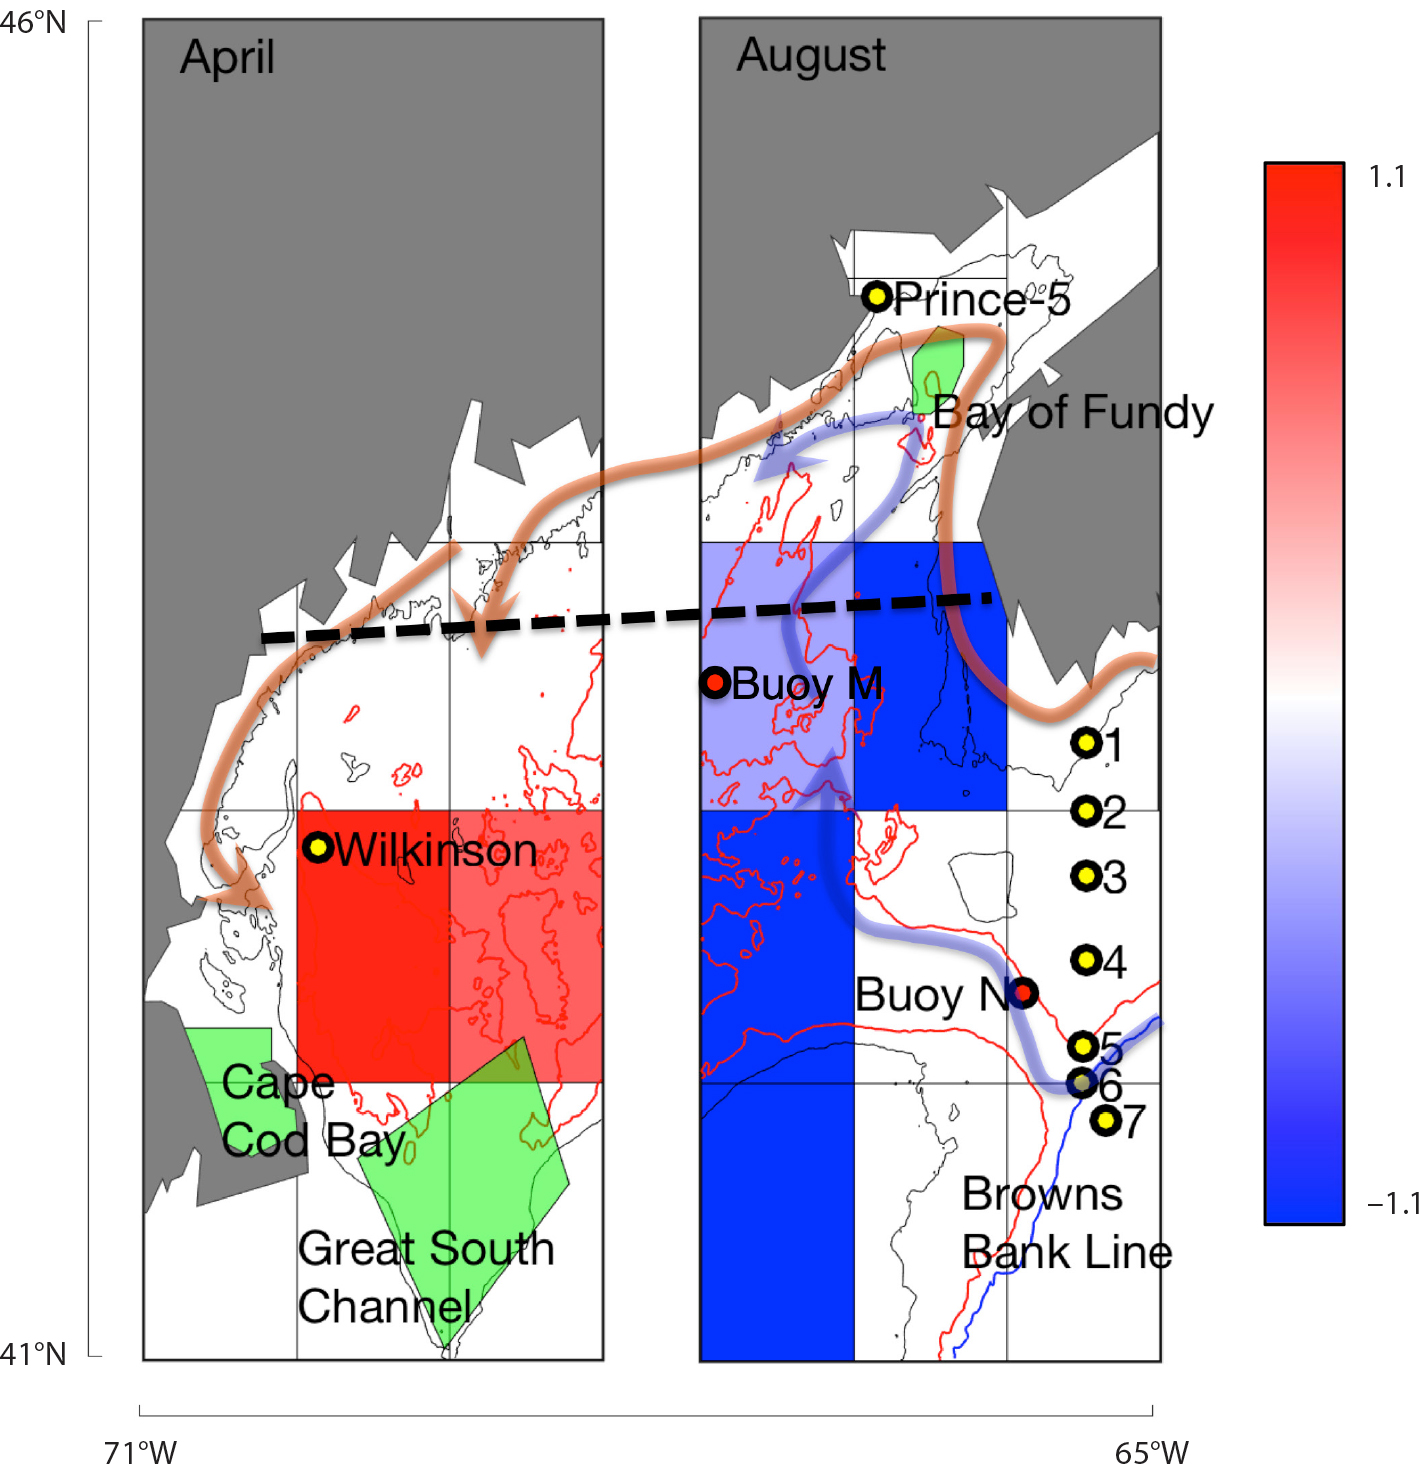
Figure 1. Gulf of Maine sampling. Yellow dots show time-series stations (Wilkinson Basin, Prince-5, and Browns Bank Line). Grid shows statistically significant (Mann-Whitney rank sum, p <0.05) increases (red) and decreases (blue) in late-stage C. finmarchicus log abundance from the NOAA Northeast Fisheries Science Center Ecosystem Monitoring (ECOMON) survey, based on the difference between the two time periods 2004–2008 and 2012–2016. The map is divided because increases are evident primarily in spring in the western gulf (left) and decreases primarily in late summer-autumn in the eastern gulf (right). The heavy dashed black line shows the Gulf of Maine North Atlantic Time Series (GNATS) transect. The red dot indicates the location of oceanographic buoy N. Arrows trace the sources of advection into Gulf of Maine surface (orange) and deep (blue) layers. The light green regions are areas historically identified as right whale feeding habitats. More detailed information can be found in Figures S1–S3 in the online supplementary materials. > High res figure
|
Seasonal patterns of E. glacialis and C. finmarchicus have shifted significantly from the early period (2004–2008) to the late period (2012–2016). The most notable shift for E. glacialis was a sharp decline in sightings per unit effort (SPUE) in the Bay of Fundy critical habitat (Figure 2a,b). In the western Gulf of Maine habitats, there was a decline in the Great South Channel and an increase in Cape Cod Bay, consistent with recent analyses (Ganley et al., 2019). Increases of C. finmarchicus were largely restricted to the western Gulf of Maine and occurred in spring, while the late summer through winter decreases in C. finmarchicus occurred throughout the Gulf, corresponding to the period of dormancy at depth (Figures 1 and S1). There was a significant decrease in late-stage abundance in late summer, autumn, and winter (Figure 2c–f). At the Wilkinson Basin station, there was a significant increase in the spring abundance of juvenile stages (Figure 2e,f). In Cape Cod Bay, there was a notable increase in copepod abundance in early winter (Figure 2g,h).
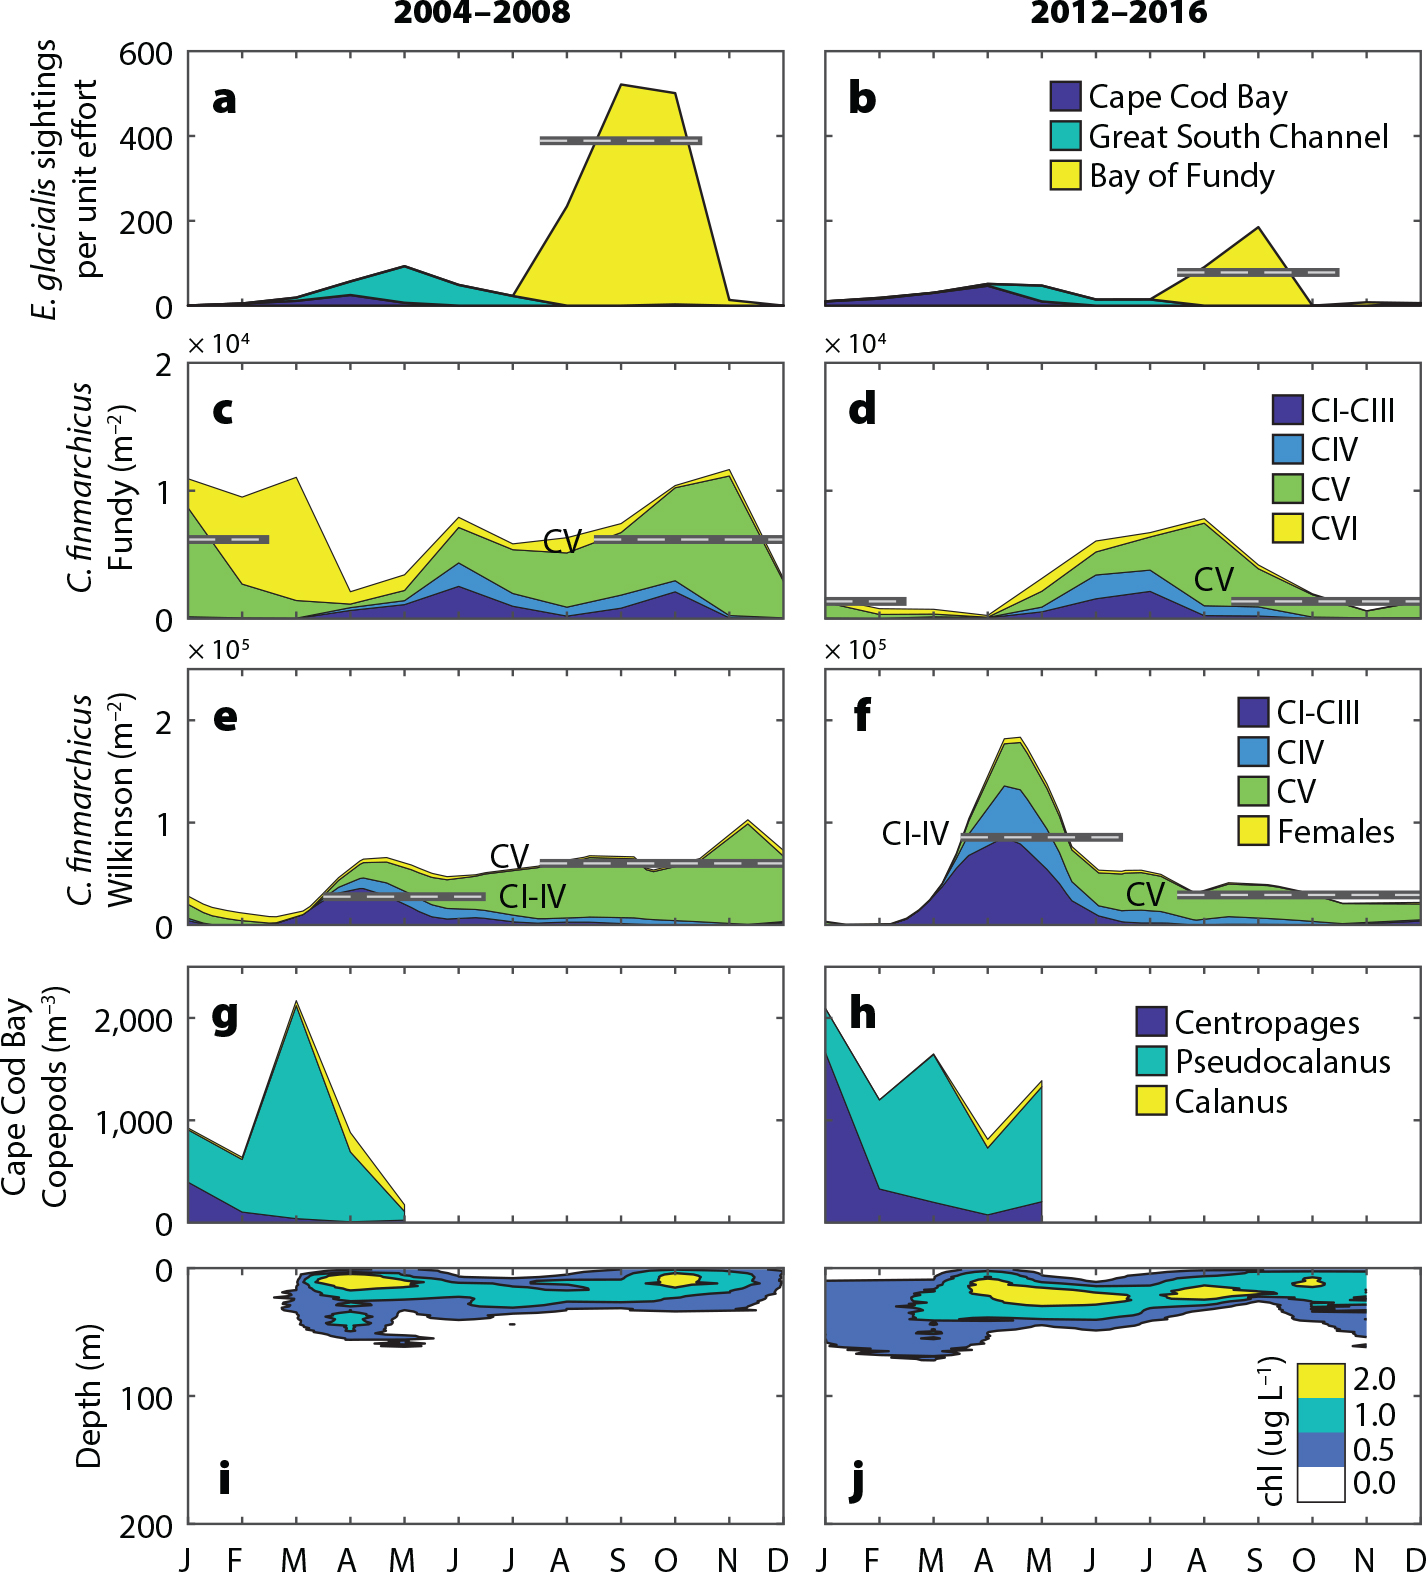
Figure 2. Climatological differences between the early (2004–2008) and late (2012–2016) periods in (a,b) E. glacialis sightings per unit effort, (c,d) C. finmarchicus abundance at the Prince-5 station and the (e,f) Wilkinson Basin station, and (g,h) copepod abundances in Cape Cod Bay. CI–CVI indicates the copepod life stage. Plots are stacked. Horizontal lines highlight multi-month significant differences (p <0.05) between the early and late periods for c–f. (i,j) Chlorophyll concentrations from Wilkinson Basin for the two periods. > High res figure
|
We ran pairwise interannual correlations across time series during the 2004–2016 period. The strongest relationships aligned along an oceanographic transport pathway stretching from the Northeast Channel through the deep waters of Jordan Basin and into Grand Manan Basin (Figures 1 and S2), particularly in late summer through autumn and winter. Extreme deepwater warming that began in 2004 exhibited strong subannual and subsurface components. The fastest warming rates occurred at depth in the late summer, autumn, and winter months (Figure 3a). Warming was fastest at depths of 20–150 m, from August to February, reaching as high as 0.5°C per year, twice the extreme warming rates of 0.23°C per year reported by Pershing et al. (2015) for surface waters. The rapid warming in these deep waters and in surface waters correlated strongly with the Gulf Stream Index (Figure 3b–e). The spatial structure of this correlation changed seasonally, being strongest at the surface in spring and shifting toward depths below 100 m in summer and winter. The most recent high-resolution ocean models project above-average warming to occur in the Northwest Atlantic, particularly in the deep waters of the Gulf of Maine (Saba et al., 2016). A key oceanographic node in this warming process is the Northeast Channel, where warmer, deeper slope water can enter the Gulf of Maine. This location has been identified as a key indicator of changes in the Atlantic meridional overturning circulation (AMOC; Sherwood et al., 2011; Rahmstorf et al., 2015), which has slowed more rapidly than expected (Caesar et al., 2018). The strong correlations between the Gulf Stream Index and the deepwater temperatures in Jordan Basin over the past decade reflect a strong localized effect of this process in the deep Gulf of Maine.
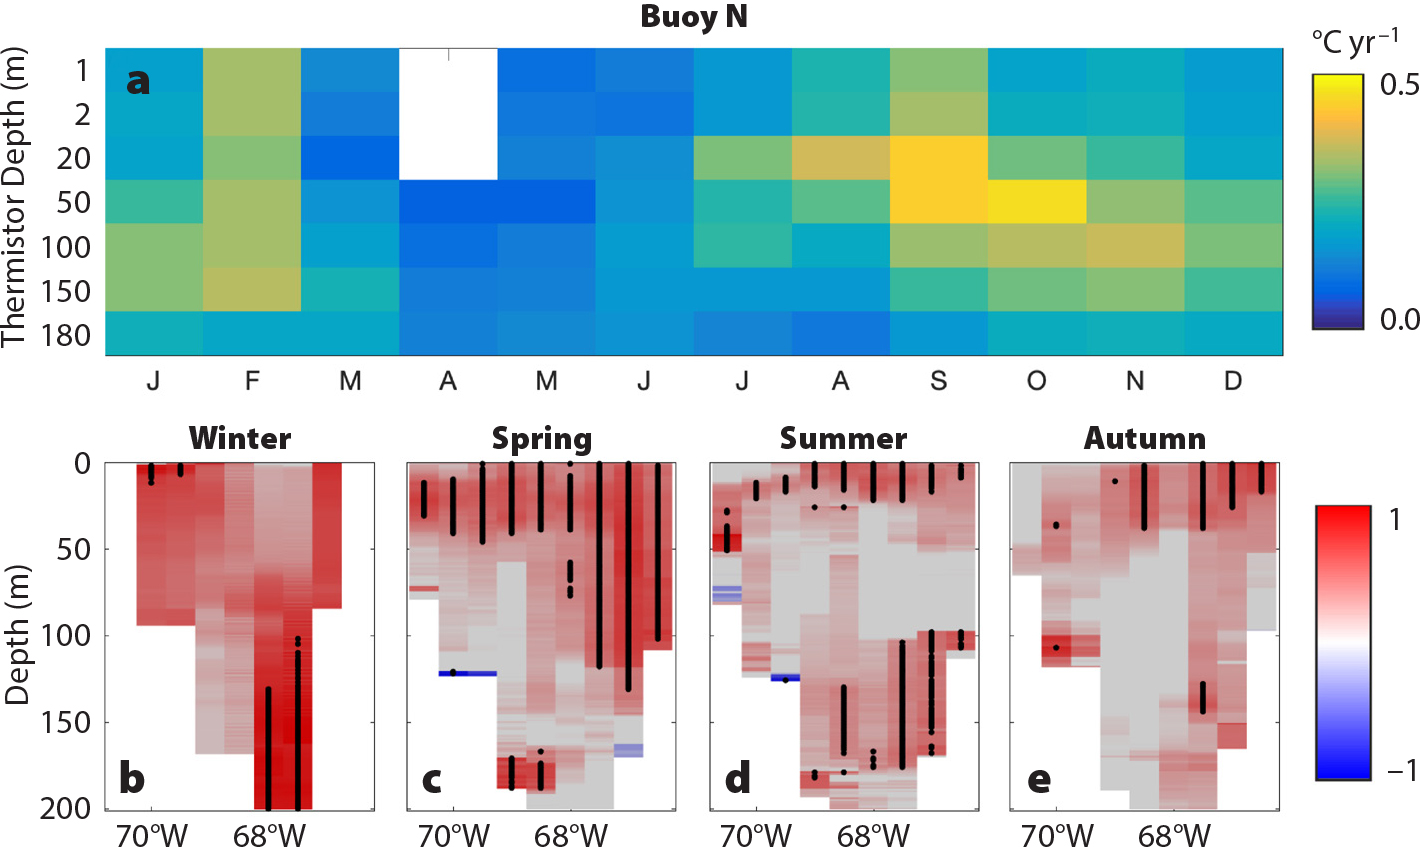
Figure 3. (a) Rate of temperature change for 2004–2017 at buoy N in the Northeast Channel by depth and month. (b–e) Correlation between water temperature from the GNATS transect (see Figure 1) averaged into seasons and the Gulf Stream Index over the period 1998–2015. Dots indicate statistical significance (p <0.05). > High res figure
|
C. finmarchicus spends much of the year in dormancy at depths below 100 m. Season-specific deepwater temperature (150 m) correlated negatively (p <0.05) with late-stage C. finmarchicus abundance during summer (r2 = 0.67), autumn (r2 = 0.40), and winter (r2 = 0.90), but not spring (Figure 4). Lagged correlations between the Browns Bank Line stations and inner Gulf of Maine C. finmarchicus measurements showed that only Station 6 correlated significantly with Jordan Basin (r2 = 0.67, Figure 3). Other Browns Bank Line stations showed weak to no correlations with the inner Gulf of Maine stations (Figure S3). Because of the location of Station 6 adjacent to the Northeast Channel, this pattern is consistent with the pattern of deepwater inflow (Figures 1 and S2).
The rapid decline in E. glacialis habitat use in the Bay of Fundy correlated significantly with late-stage C. finmarchicus abundance in the eastern Gulf of Maine during the same late-summer period. There was a strong positive correlation (r2 = 0.92) between Jordan Basin late-stage C. finmarchicus abundances and September E. glacialis SPUE in the Bay of Fundy (Figure 4f). There also appeared to be a distinct break at C. finmarchicus abundances of around 40,000 m–2, below which E. glacialis sightings were very low. Mayo and Marx (1990) and Murison and Gaskin (1989) estimated the immediate decision-making threshold for E. glacialis feeding to be approximately 1,000 m–3 for Cape Cod Bay and the Bay of Fundy, respectively. Kenney et al. (1986) estimated the minimum concentrations necessary for right whale feeding to provide a net energetic benefit over the long term to be in the 105–106 m–3 range. The 40,000 m–2 threshold in our data suggests a similar break, representing the regional copepod abundance at which high-density, exploitable, small-scale patches within a region are likely to occur. In the western Gulf of Maine, links between changes in copepod abundance and E. glacialis habitat use were ambiguous. The data from Cape Cod Bay, spanning January to May, did not correlate significantly with right whale SPUE in any month for any of the three dominant copepod taxa (C. finmarchicus, Pseudo-calanus, and Centropages; Table S1). This likely has to do with the fact that E. glacialis is exploiting multiple species, each with different phenologies and energetic contents.
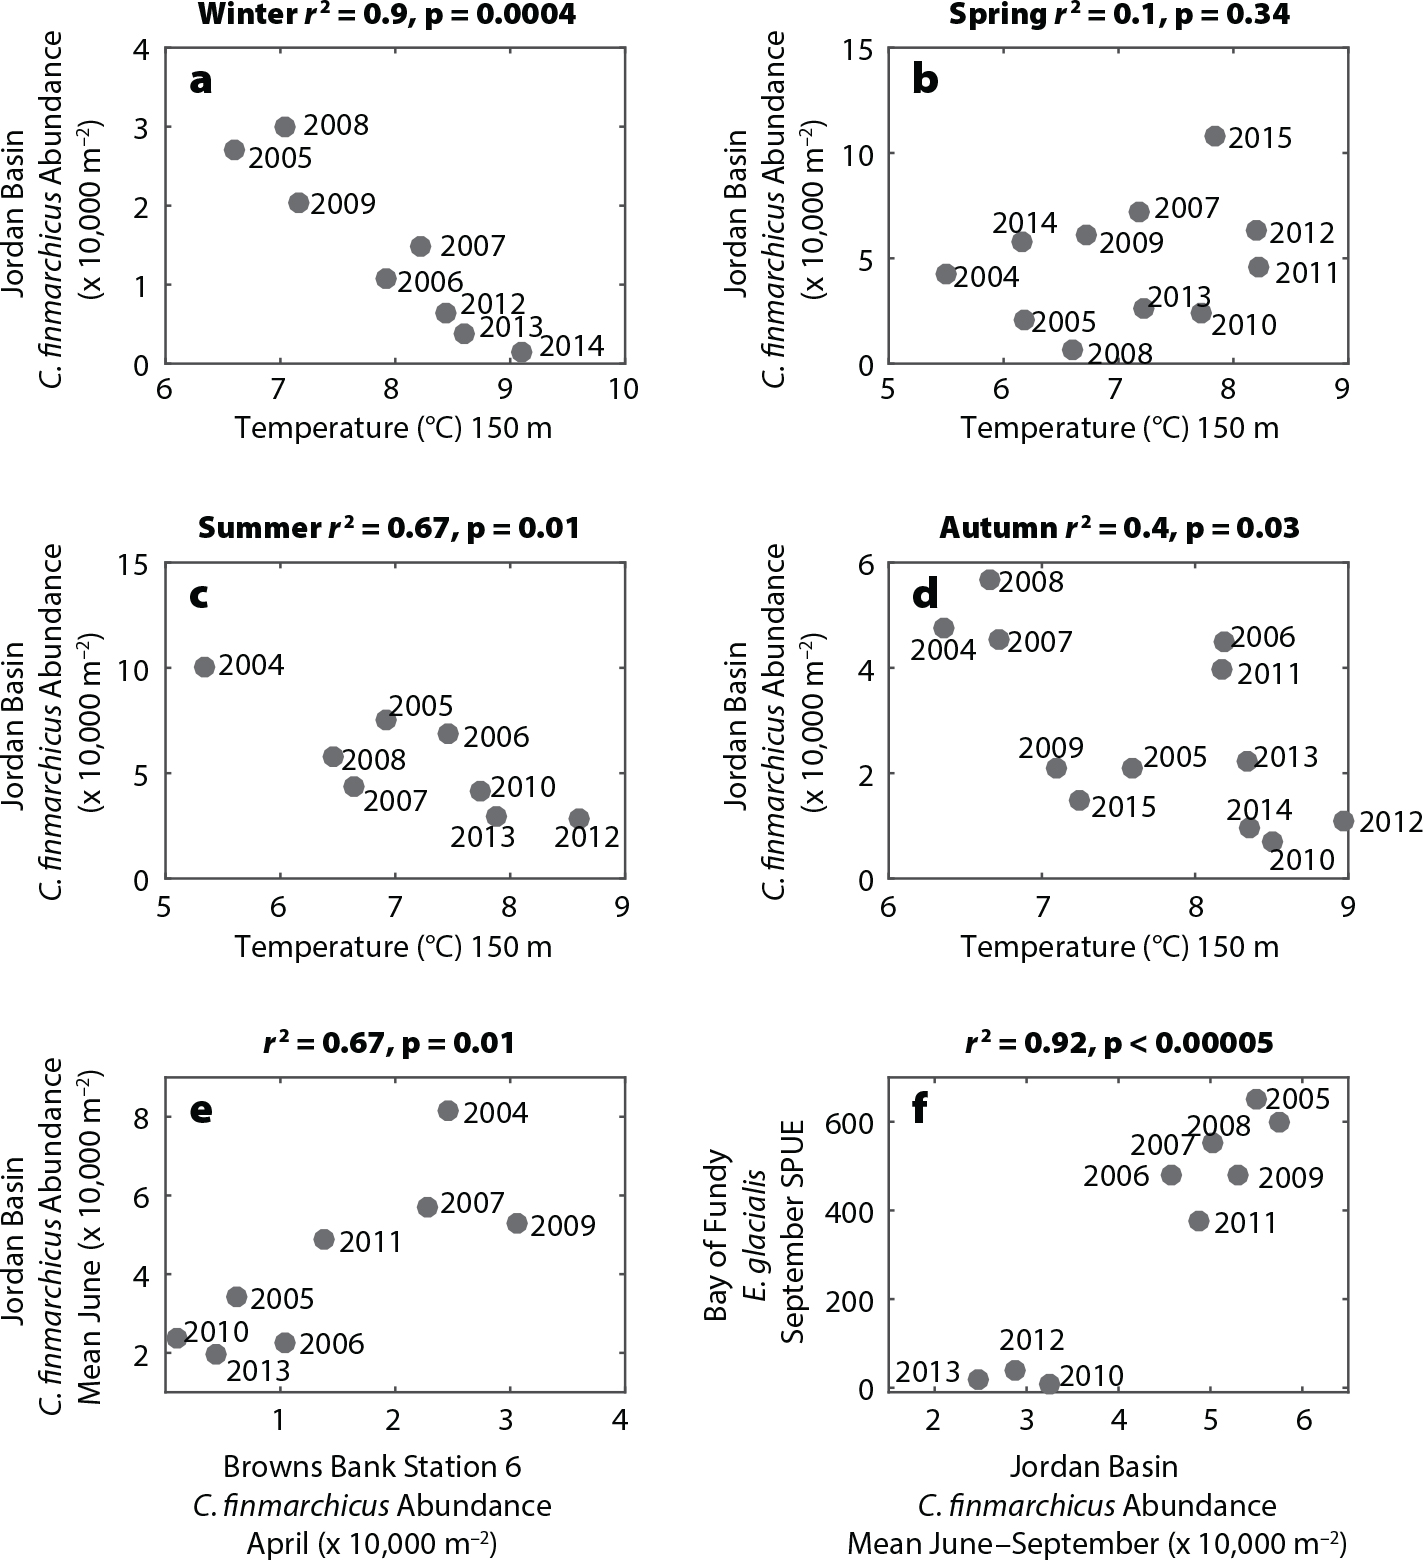
Figure 4. (a–d) Jordan Basin temperature versus Jordan Basin late-stage C. finmarchicus, within each of the four seasons. (e) Copepodite C. finmarchicus at Browns Bank Line Station 6 in April versus late-stage C. finmarchicus in Jordan Basin in June. (f) Jordan Basin late-summer abundance of late-stage C. finmarchicus versus Bay of Fundy E. glacialis sightings per unit effort. > High res figure
|
These lines of evidence support the concept that there are presently two largely distinct oceanographic pathways controlling C. finmarchicus and E. glacialis in the Gulf of Maine. The two pathways manifest at different times of year and at different depths, are sensitive to different driving forces, and influence E. glacialis foraging differently. The first pathway influences the western Gulf of Maine, which has been the location of some of the highest abundances measured for C. finmarchicus within its range (Melle et al., 2014). These high abundances are a consequence of the “coastal amplification of supply and transport (CAST)” process, described by Ji et al. (2017), in which individuals are carried along the highly productive Maine Coastal Current, taking advantage of the high productivity of the coastal environment (Figure 1, orange arrow). This pathway typically results in very high C. finmarchicus abundances in the western Gulf of Maine in spring and is more sensitive to winter phytoplankton stock available to reproducing females (Figure 2i,j) than to temperature because of the strong link between food availability and egg production rates (Durbin et al., 2003). In contrast to predictions of northward range shifts, this pathway has maintained favorable conditions in the spring for both C. finmarchicus (Ji et al., 2017) and E. glacialis in the western Gulf of Maine, where E. glacialis also feed on smaller copepods in the winter and spring (Pendleton et al., 2009), further buffering potential changes in C. finmarchicus. While the CAST pathway as described is internal to the Gulf of Maine (Ji et al., 2017), the upstream extension along the Nova Scotia Current has been cited as a key input of C. finmarchicus into the Gulf of Maine (Greene et al., 2004). Presumably, some level of external supply is necessary to sustain this C. finmarchicus population, and a reduction in supply would hypothetically affect this source. However, the lack of correlation between the nearshore Browns Bank Line stations and the interior Gulf of Maine C. finmarchicus abundances (Figure S3) suggests that supply along this part of the advective route is less important than has been reported in past years. The high winter phytoplankton productivity and high reproductive potential of C. finmarchicus (i.e., the coastal amplification) reduces the sensitivity to changes in supply along this route.
The second pathway, in contrast, is more sensitive to climate-driven changes in oceanography. Slope water along the Scotian Shelf represents another potential source of C. finmarchicus to the shelf and to downstream locations (Head et al., 1999; Zakardjian et al., 2003). In the eastern Gulf of Maine, dormant C. finmarchicus populations are exposed to oceanographic changes occurring at greater depths during late summer through winter. Warming has been most rapid in deep water during these seasons, likely reflecting changes in flow through the Northeast Channel (Figure 3). The decline in C. finmarchicus is likely a combination of reduced supply and a more direct effect of deepwater temperatures. The lagged link with Browns Bank Line Station 6 (Figures 4e and S3) is consistent with C. finmarchicus supply from warm slope-water sources (Figures 1 and S2). While the temperatures are not high enough to cause mortality directly, C. finmarchicus mortality is typically calculated as an increasing function of temperature (Speirs et al., 2006) to capture the combined effects of predation, increased metabolic demands, and decreased diapause duration. The fact that the temperature effect is strongest in winter (Figure 4a) suggests a cumulative direct effect of temperature throughout the dormancy period. Whether through direct advection of C. finmarchicus or through the effect of warmer advected water, the decline is consistent with a change in flow through the Northeast Channel associated with changes in the AMOC. This driver has been documented in reconstructed past data (Sherwood et al., 2011), is well described in models (Saba et al., 2016), and has resulted in rapid deepwater warming. This depth and seasonality match the time of year when lipid-rich C. finmarchicus are in diapause in the Gulf of Maine in deep water, and also when E. glacialis typically feeds in the eastern Gulf of Maine. The documented change in the AMOC (Caesar et al., 2018) is the likely driver of these changes, and because of the link between the AMOC and climate change, this is a probable precursor to future changes.
“An understanding of subannual ecosystem and oceanographic dynamics, and of the response of systems to rapid change, will be necessary to support conservation in the future.”
Adapting to rapid change will require approaches that anticipate change. In the case of E. glacialis, measures to reduce risk—such as designation of critical habitat areas, vessel routing modifications, and fishing closures—are built upon the notion that whales will visit the same foraging grounds at the same times each year (Vanderlaan et al., 2011). A disruption to this regularity, as a consequence of rapid oceanographic changes, has exposed whales to increased risks as they have ranged beyond their regulatory protections, prompting new survey effort and risk-reduction measures in Canadian waters (Davies and Brillant, 2019). One approach to making management more dynamic is forecasting at subannual timescales. For example, using a dynamic species distribution model informed by C. finmarchicus distributions, Pendleton et al. (2012) predicted highly favorable E. glacialis foraging habitat south of Nantucket, which was outside of the known foraging areas. This region was subsequently found to be a foraging hotspot (Leiter et al., 2017), demonstrating the potential value of oceanographic forecasts as early warning systems and as adaptation tools in a more rapidly changing environment.
Climate change is often viewed as a long-term problem, and in this context, mean species range shifts could be a useful tool. However, mean shifts assume that organisms can adjust quickly to new conditions in the ocean. While the shift in right whale distributions is consistent with this assumption, low calf production is an indication that they are not yet able to forage well in these new habitats (Corkeron et al., 2018). Recent modeling work suggests that a healthy whale population can rebound after a few low-reproduction years by finding and adapting to a new habitat (Tulloch et al., 2019). The right whale population is not healthy, and more time spent foraging may lead to additional mortality, amplifying the challenges this species faces. Rapid warming at the level observed in the Gulf of Maine is likely to be a more prominent feature of the future ocean. Even climate-based projections, which predict gradual northward range shifts, fall short at finer timescales. An understanding of subannual ecosystem and oceanographic dynamics, and of the response of systems to rapid change, will be necessary to support conservation in the future.

