The Roger Revelle Commemorative Lecture Series was created by the Ocean Studies Board of the National Academies of Sciences, Engineering, and Medicine in honor of Roger Revelle to highlight the important links between ocean sciences and public policy. Dr. Chris Scholin, the twenty-sixth annual lecturer, spoke on May 1, 2025, at the National Academy of Sciences.
Introduction
In his opening remarks at the inaugural meeting of The Oceanography Society, David Packard spoke about an opportunity to accelerate progress in ocean science through technology development (Packard, 1989). The ocean, as he saw it, was the last frontier on Earth, and it did not garner the attention it deserved. Yet, it held untold mysteries and unseen landscapes, and many technical, scientific, and societally relevant discoveries awaited. Two years earlier, that insight had led to the founding of the Monterey Bay Aquarium Research Institute (MBARI; Barber, 1988; Chavez et al., 2017a). A combination and integration of three foundational technologies were projected to transform oceanography: remotely operated vehicles (ROVs), new types of sensors, and advanced computing and data systems. Starting with those building blocks, Packard’s charge when founding MBARI was to “go deep and stay long” to improve our understanding of the ocean (Barber, 1988) and to “return data, not samples.” This article draws from that legacy.
Packard was right. The advent of robotic and advanced sensing and computing technologies has indeed transformed ocean exploration. New tools and techniques have allowed us to overcome many, but by no means all, of the challenges posed by the sea’s depth, vastness, and inaccessibility. Packard, like many others, understood that a sustained investment in basic research and engineering would pay future dividends in ways that could not be foreseen. Today, nearly 40 years after MBARI’s founding, hybrid human-machine and fully autonomous systems are revealing an unprecedented perspective on the interplay between marine chemistry, physics, biology, and geology. Robots enable coordinated observations of the water column and seafloor in ways that humans cannot match and allow extended missions in extreme environments. Collection of long-term monitoring data from far-flung corners of the globe, automated in situ analyses, real-time communications and data sharing, and active multimedia public engagement across continents are now a part of everyday oceanography. A new window into our ocean world is opening—one that was long imagined by visionary scientists, engineers, and science fiction writers alike.
This paper examines a number of technological innovations that are revealing surprising insights into the inner workings of our ocean and its inhabitants against the backdrop of a rapidly changing climate. The examples given are by no means a comprehensive review of the role that technology is playing in ocean exploration. Many individuals from organizations around the world have made lasting contributions that have brought us to this juncture. Here, several case studies are chosen to illustrate that ongoing process and to pay homage to some of the scientists and engineers who set us on this course. We still have much to learn about the sea, its inhabitants, and the vital role it plays in sustaining the health of our planet and the well-being of society. Decades-long interdisciplinary science and engineering pursuits have ushered in a new era of discovery driven by bold ideas, serendipitous discoveries, and the allure of the largest and least explored habitat on Earth.
Taking the Pulse of the Planet
In 1957, Roger Revelle and Hans Suess captured the scientific community’s imagination with their groundbreaking paper on CO2 exchange between the atmosphere and the ocean (Revelle and Suess, 1957). They argued that CO2 released from the burning of fossil fuels was accumulating in the atmosphere and that a significant fraction of the emissions had dissolved into the sea. Perhaps most importantly, they went on to say,
…human beings are now carrying out a large scale geophysical experiment of a kind that could not have happened in the past or be reproduced in the future… This experiment, if adequately documented, may yield a far-reaching insight into the processes determining weather and climate.
Their findings were provocative, scientifically tantalizing, and urgently driven by increasing global industrialization, and suggested that increased atmospheric CO2 could lead to changes in ocean chemistry and a warmer climate with potentially compounding amplifications due to a number of processes that were known but not well characterized at the time. The insight was brilliant, but the capabilities for testing this theory globally were in their infancy. The consequences of fossil fuel consumption were of tremendous importance societally, but at the time of Revelle and Suess’s proclamation, that was not a part of public discussion and politics as it is today. Decades of research followed as investigators sought the means to conduct ocean-basin-scale measurements needed to assess predicted trends. In 1999, Peter Brewer elegantly recounted that history during the first annual Revelle Lecture (Brewer, 2000).
Capturing time-space variations in the ocean’s interior, at basin scales, accurately, is no small challenge. For many years, the only practical way to tackle this problem was by using crewed ships to conduct hydrographic surveys. Despite the analytical and logistical challenges, a picture of the exchange of CO2 between the atmosphere and ocean slowly emerged (Brewer, 2013). Decades of work were required to establish the connection between the burning of fossil fuels and the reality of human-driven climate change and ocean acidification. Ironically, nearly 70 years after Revelle and Suess issued their “geophysical experiment” proposition, we now find ourselves scrambling to assess the promise and pitfalls of artificially stimulating the ocean to absorb more CO2 to mitigate a climate crisis of our own making (e.g., Coale et al., 1996; Brewer, 2013; Bach and Boyd, 2021; NASEM, 2022; Levin et al., 2023; S.M. Smith et al., 2024; Findlay et al., 2025, in this issue).
Enter the Robots
As ocean sensor systems matured, so too did the platforms on which they could be deployed. In addition to measurements acquired manually, scientists and engineers developed the means to automate air-sea CO2 flux measurements aboard ships, moorings, and autonomous surface vehicles (ASVs; Friederich et al., 1995; Chavez et al., 2017b, 2018). It was apparent that seasonality and geographical location played an important role in when and where there was a net flux of CO2 into or out of the sea (e.g., Takahashi et al., 2009). Other sensor systems for autonomously acquiring biogeochemical measurements, such as pH (Johnson et al., 2016) and nitrate (Sakamoto et al., 2017), also evolved along with improvements for in situ quantification of oxygen and optical parameters, all of which were deployable on autonomous underwater vehicles (AUVs) and ROVs. Development and use of these biogeochemical sensor suites were greatly aided by the availability of mooring technology and well-established time-series studies that included routine ship-based hydrographic surveys (e.g., Karl, 2010, 2014; Chavez et al., 2017b). Now, after years of observations, the unmistakable trend of rising CO2 in the atmosphere with concurrent changes in ocean pH and temperature has emerged (Figure 1; e.g., Thorne et al., 2024) along with complex biological and ecosystem manifestations (e.g., Doney et al., 2020; Alter et al., 2024).
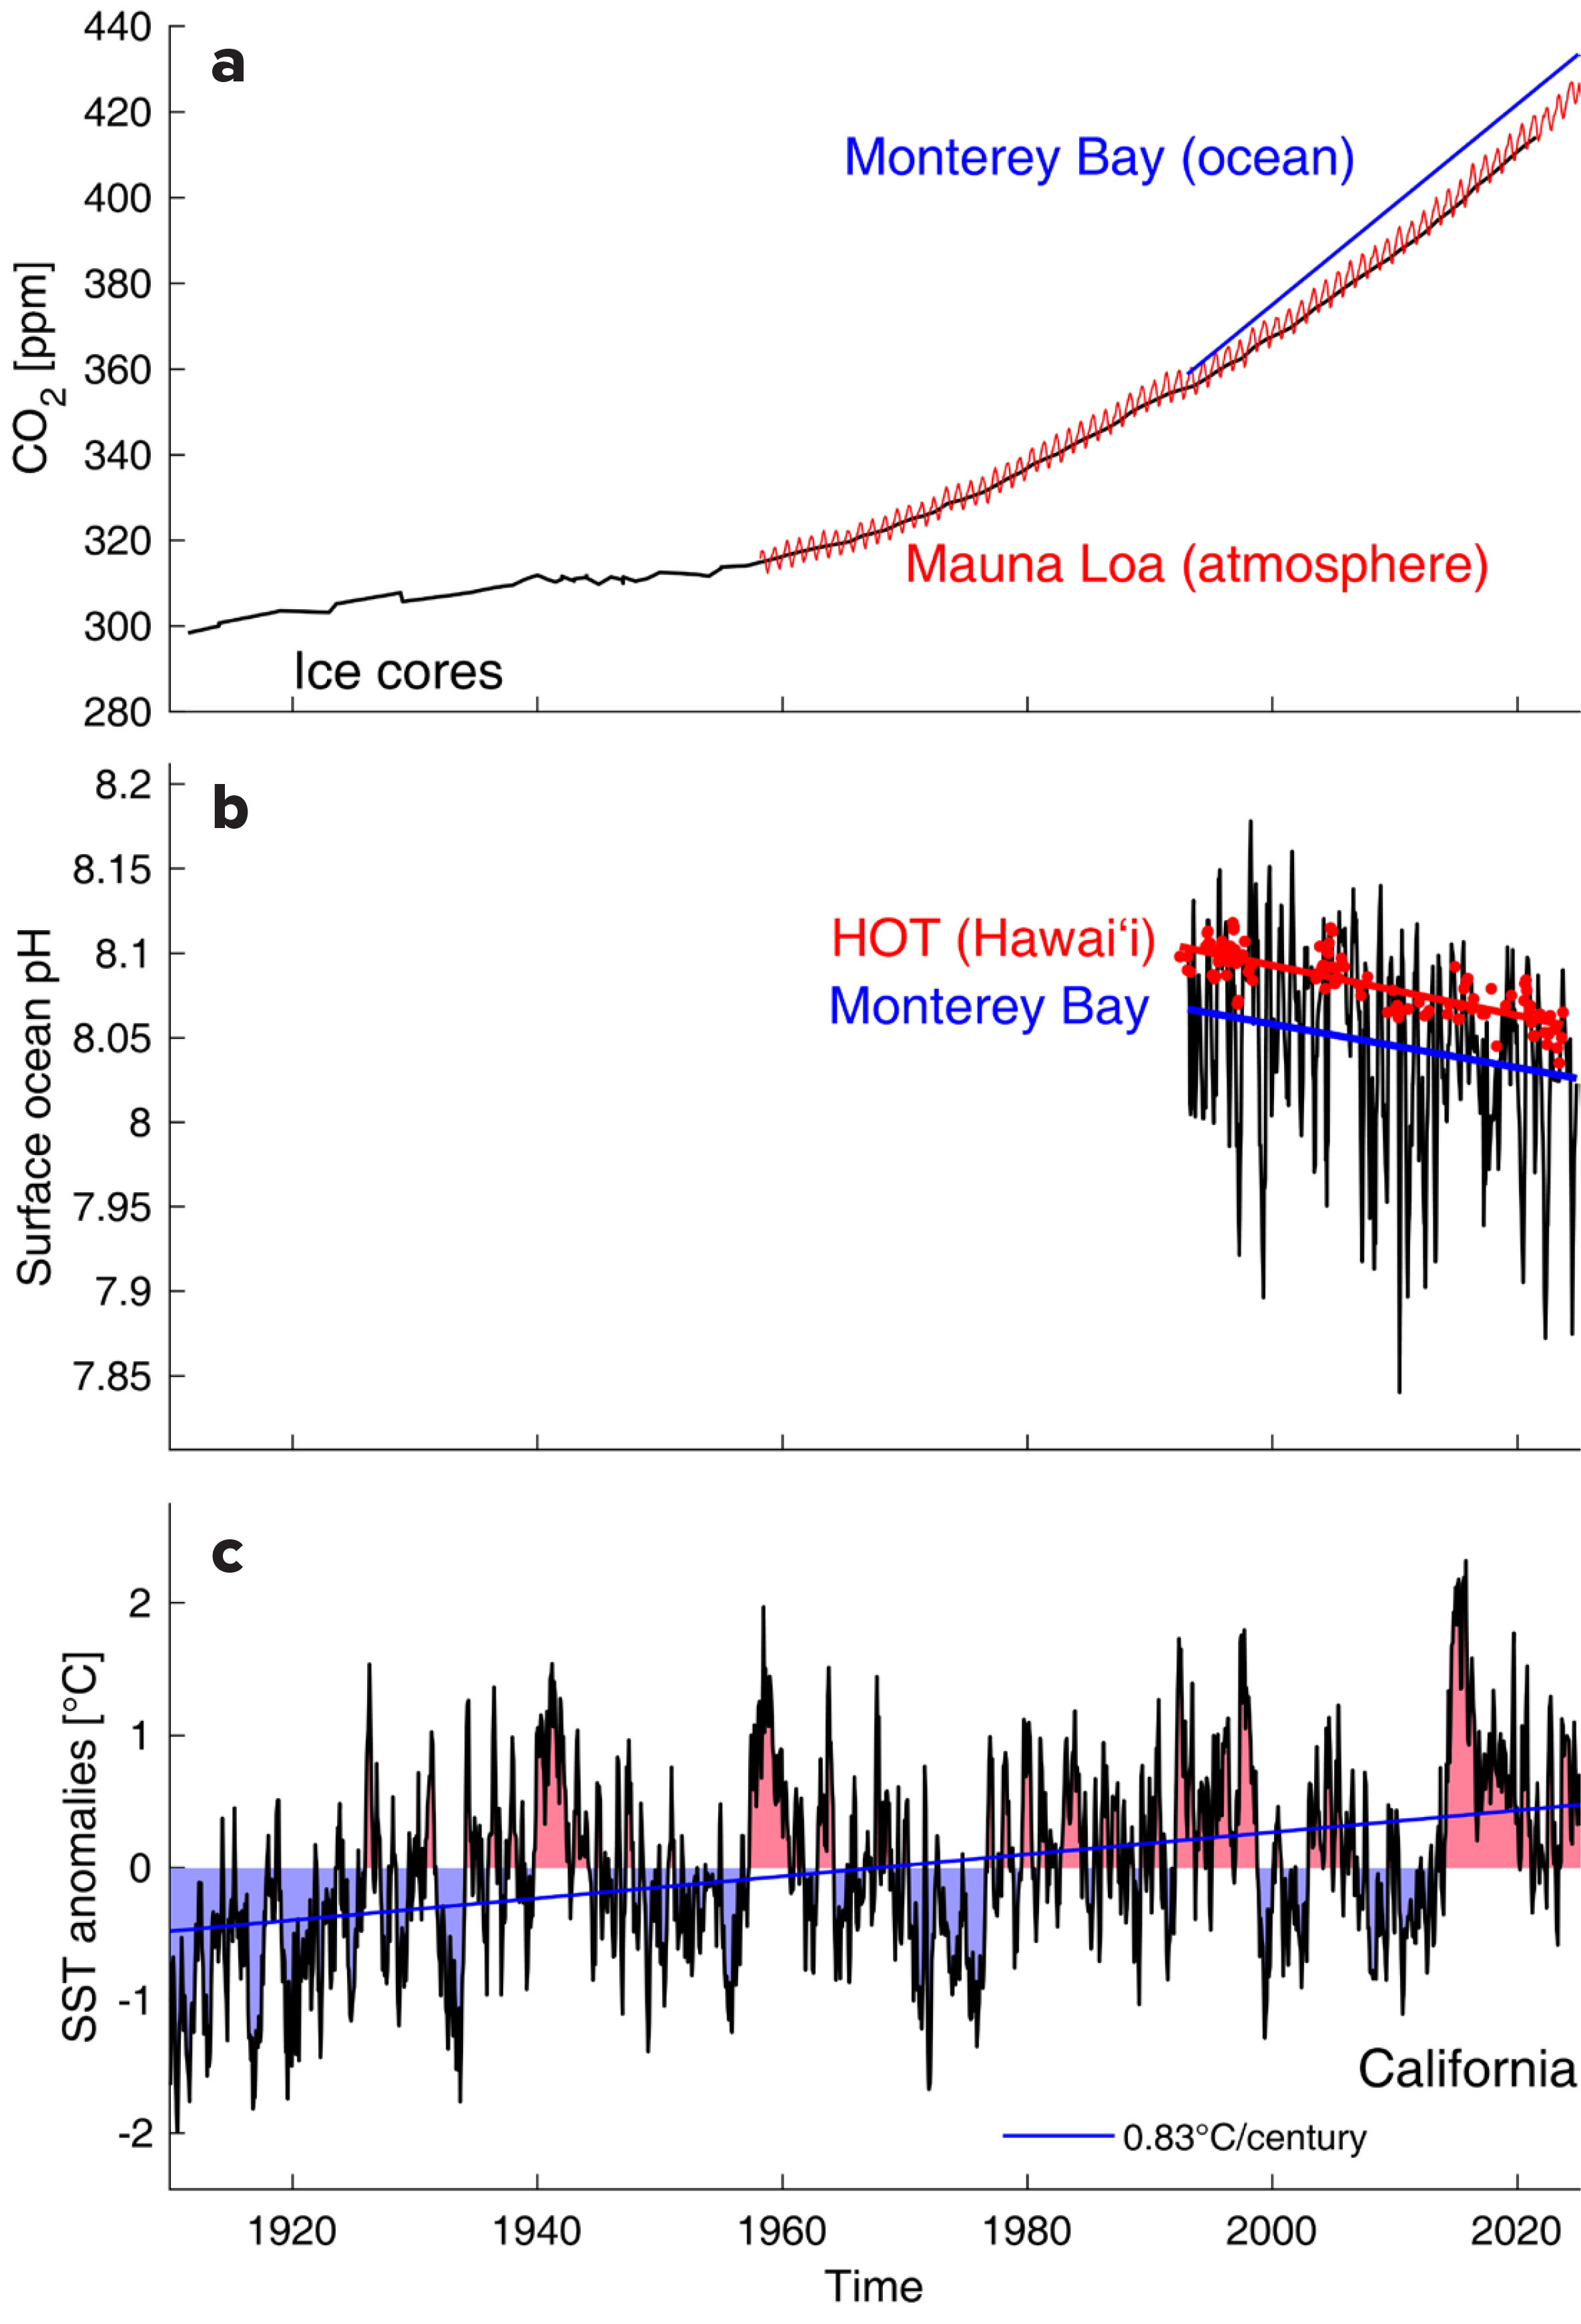
FIGURE 1. Plots show time series from 1900 to the present of (a) atmospheric carbon dioxide (CO2) measured from ice cores (black) and the Mauna Loa Observatory (red) on the Big Island of Hawai‘i (Keeling et al., 2001; MacFarling Meure et al., 2006). The trend in the partial pressure of surface ocean pCO2 (a measure of CO2 entering or exiting the sea) in Monterey Bay, California, from the early 1990s is also shown (blue; updated from Chavez et al., 2017b). (b) Surface ocean pH data from the early 1990s to the present are shown here from the Hawai‘i Ocean Time-series (HOT) program (red; Karl and Lukas, 1996) and Monterey Bay California (blue; updated from Chavez et al., 2017b). Note that the pH scale is logarithmic. (c) The figure shows sea surface temperature anomalies (seasonal cycle removed) from the California Current along the US West Coast (Huang et al., 2017). Clear trends are evident for all of the measurements. > High res figure
|
Thanks to a remarkable confluence of technologies and dogged determination on the part of scores of visionary scientists and engineers, it is now possible to observe ocean basin-scale carbon cycling using a distributed fleet of profiling floats—robots—that offer much more information at a far lower cost compared to ship-based surveys (Figure 2a,b; e.g., Johnson and Claustre, 2016; Claustre et al., 2020; Schofield et al., 2022; Sarmiento et al., 2023). A global fleet of floats now returns sensor measurement data from remote regions of the globe in real time, and the information acquired is freely accessible to anyone nearly instantly via the Internet (GO-BGC). This remarkable achievement has given ocean scientists the equivalent of a medical doctor’s tool kit for rapidly assessing a patient’s vital signs. As a result, we now know that the Southern Ocean—one of the most inaccessible and difficult places to work—plays a major role in ocean-atmosphere carbon cycling and global climate modulation (Liniger et al., 2025). As the profiling float network grows and is sustained, we increasingly gain a perspective on how other oceanic regions are responding. These programs have also proven to have phenomenal education and outreach appeal (Figure 2c,d). Groups can adopt floats, name them (even personalize their housings), and follow them over time in conjunction with classroom lesson plans (Adopt-A-Float program; EARTH Lesson Plans; Matsumoto et al., in press). To date, people from all 50 US states, Puerto Rico, Samoa, and over 15 countries have adopted floats.
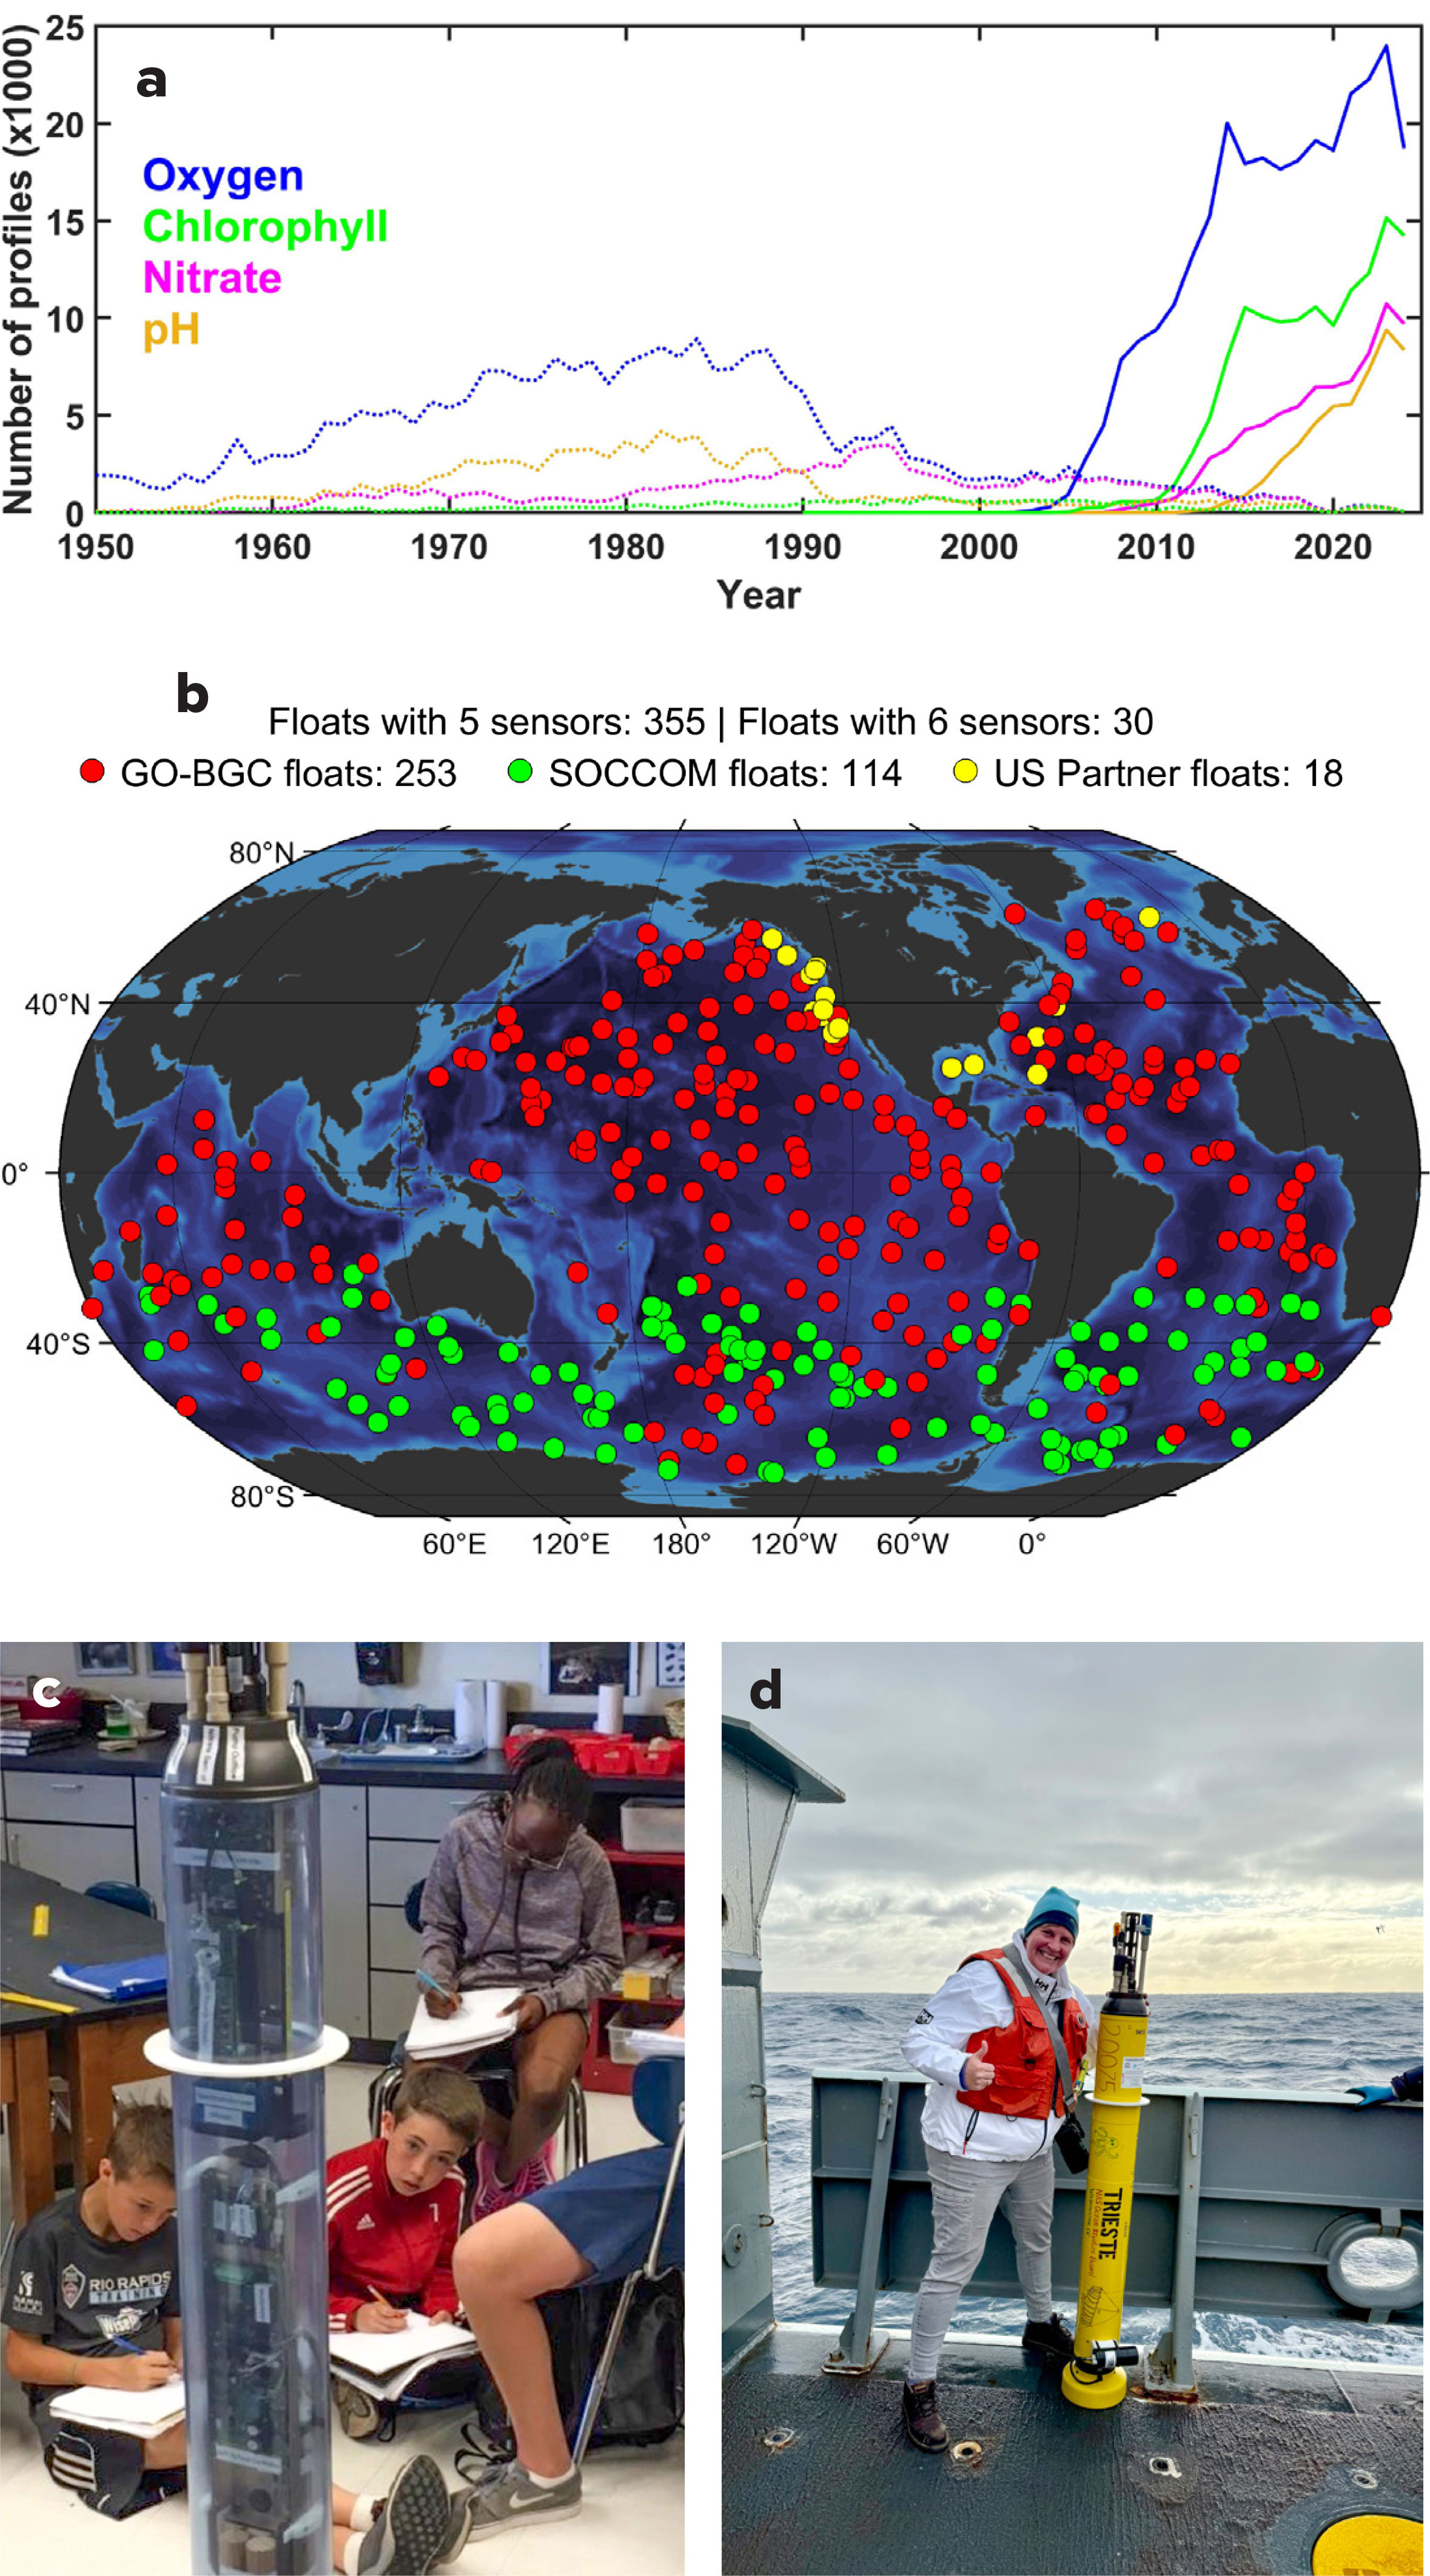
FIGURE 2. Biogeochemical sensing data and equipment. (a) Comparison of ship-based profiles for oxygen, chlorophyll, nitrate, and pH. (b) A global map shows the distribution of profiling floats provided by the Global Ocean Biogeochemistry Array (GO-BGC), the Southern Ocean Carbon and Climate Observations and Modeling (SOCCOM) project, and US partners. (c) School children learn about profiling float technology by examining a mockup with transparent housing. (d) MBARI marine educator Jennifer Magnusson is shown ready to launch a float named Trieste from R/V Thomas G. Thompson in 2024. The National Academies’ Ocean Studies Board (OSB), overseer for the annual Revelle Lecture, named and adopted the Trieste float in memory of former OSB member Don Walsh who, with Jacques Piccard, made the first historic dive to the depths of Challenger Deep in the bathyscaphe Trieste. Images for (c) and (d) provided by G. Matsumoto and J. Magnusson, respectively, 2025. > High res figure
|
Seeing is Believing
Advances in biogeochemical measurements have only recently given us the means to observe the basic vital signs of the global ocean. Understanding pelagic ecosystem dynamics and the role that animals play in the marine carbon cycle poses an entirely different and arguably far greater challenge. Since the time of the Challenger Expedition (Thomson, 1887), trawl nets have been used to search for life in the deep sea with success, but that method returns no context about the three-dimensional environment in which animals live, and it destroys fragile animals, thus obscuring their presence. Diving into the depths to observe life in its natural habitat, up close and in-person, offered an entirely new understanding compared to what nets yielded.
William Beebe (1934), in his book Half Mile Down, recounted his personal experiences of being lowered into the sea in a bathysphere. He described an abundance of strange deep-sea animals that frequently glowed in bedazzling ways that defied his explanation. One of his team members, Else Bostelmann, a talented artist, created original works for National Geographic magazine that reflected Bebee’s accounts and brought deep-sea biology to the public’s attention (Widder, 2016). Decades later, more sophisticated expeditions using self-propelled crewed submersibles, including single-person vehicles (e.g., Robison 1983; Alldredge et al., 1984; Widder et al., 1989), opened a new chapter of deep-water research and exploration.
With MBARI’s founding in the late 1980s, David Packard gave scientists and engineers a new platform for accessing the deep sea. His charge was to adapt an ROV dubbed Ventana, originally designed for use in the offshore oil and gas industry, for use as a multi-purpose research platform (Figure 3a,b). Prior to that time, no one had attempted to use an ROV for such purposes. Robison et al. (2017) offered a unique perspective on the history of initiating and developing a midwater research program using ROVs as did Haddock et al. (2017). At the time of its introduction to the ocean science community, Ventana, and its support vessel Point Lobos, seemed unremarkable compared to storied crewed submersibles such as Alvin and Johnson Sea Link and their much larger mother ships. But it was soon apparent that ROVs offered tremendous capabilities and were highly adaptable. They quickly became integral to the discovery of new species and revelations of pelagic ecosystem structure and function, in particular, the prevalence and importance of gelatinous animals (Haddock, 2004; Robison, 2004). ROV time-series studies also made possible the first-ever comprehensive description of a deep pelagic food web (Choy et al., 2017). All of these advancements were fundamentally enabled by telepresence—underwater video recordings—combined with concurrent measurements of temperature, oxygen, salinity, and other ocean variables. The addition of robotic sensors and samplers to ROVs also made it possible to collect specimens and conduct unique in situ experiments. A recent example of the utility of what ROVs can enable scientifically is particularly well illustrated in the detailed description of a deep-sea animal new to science that for years was known only as the “mystery mollusc” (Robison and Haddock, 2024; Figure 4). Similarly, ROVs have also proven to be valuable tools for evaluating the impacts of rising levels of CO2 on ocean biology and chemistry both in the water column and on the seafloor (e.g., Barry et al., 2017; Brewer et al., 2017; Robison et al., 2017). In today’s world, ROVs are integral to ocean exploration and are proliferating. The technology continues to evolve rapidly, making the platforms more capable, accessible, and affordable.
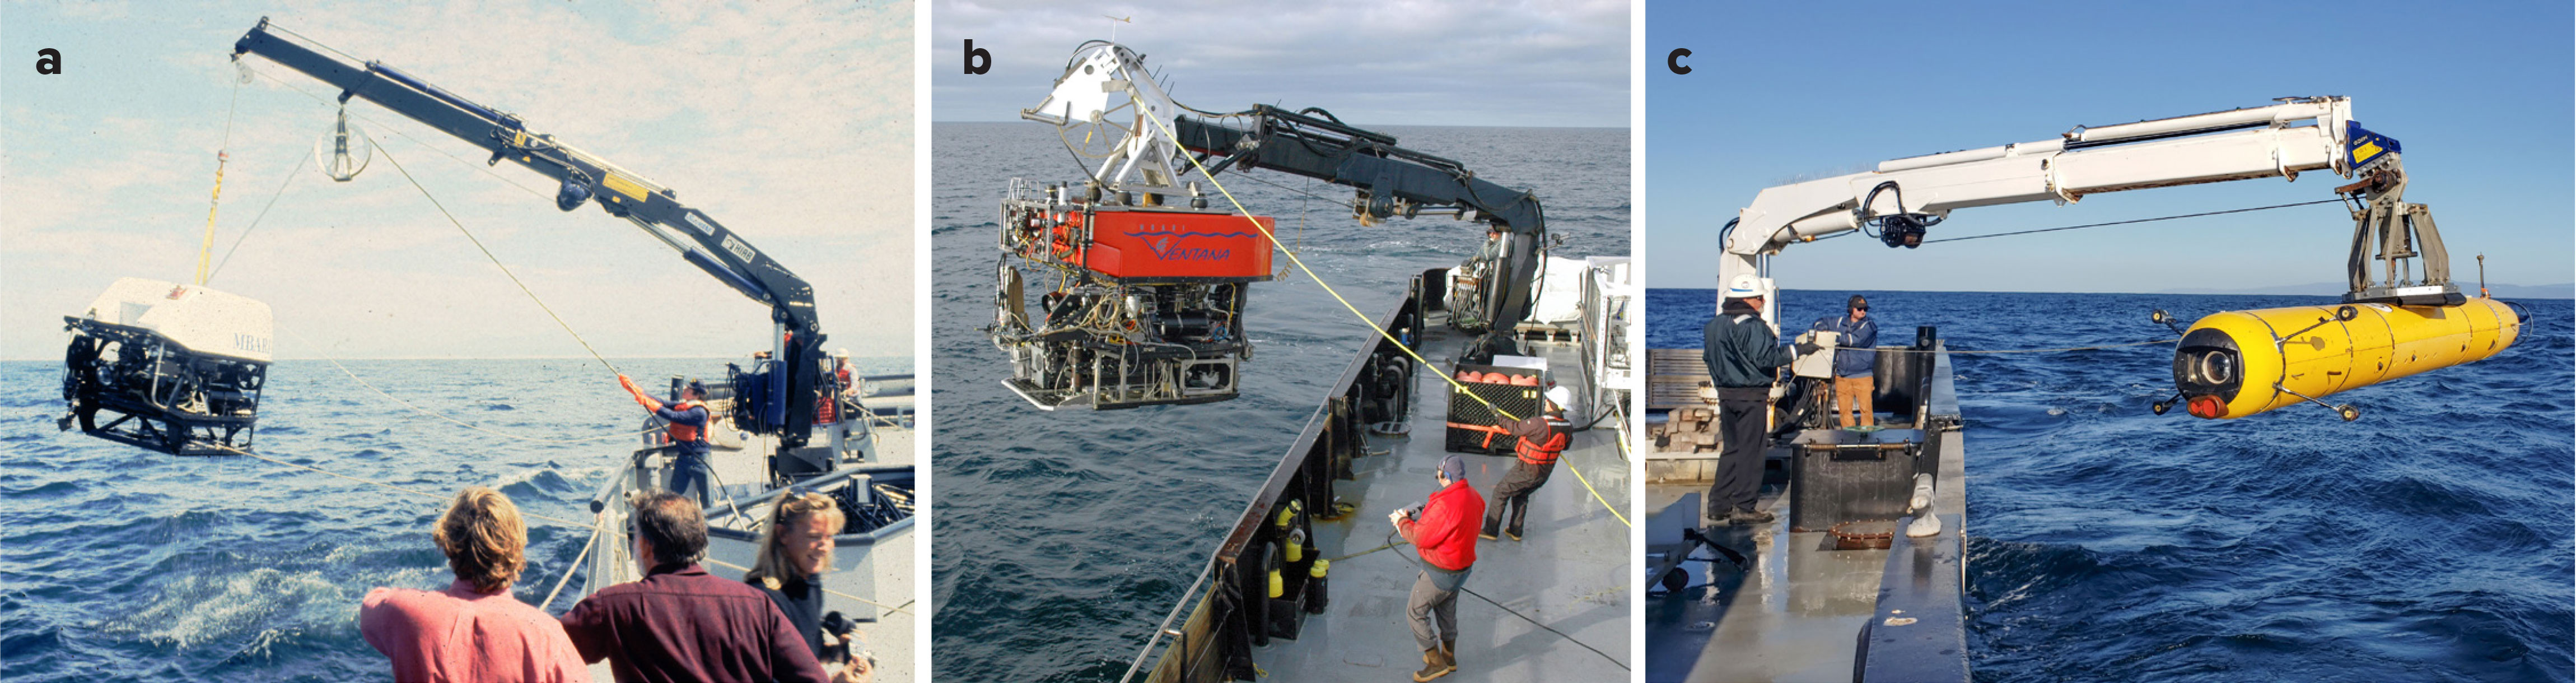
FIGURE 3. Evolution of platforms used for midwater research and time series studies at MBARI. (a) ROV Ventana’s first launch in 1988 from R/V Point Lobos © 1988 MBARI (b) Modern-day incarnation of Ventana being deployed from R/V Rachel Carson. Kim Fulton-Bennet © 2014 MBARI (c) The i2MAP AUV is designed for conducting midwater surveys. Kim Reisenbichler © 2022 MBARI. > High res figure
|
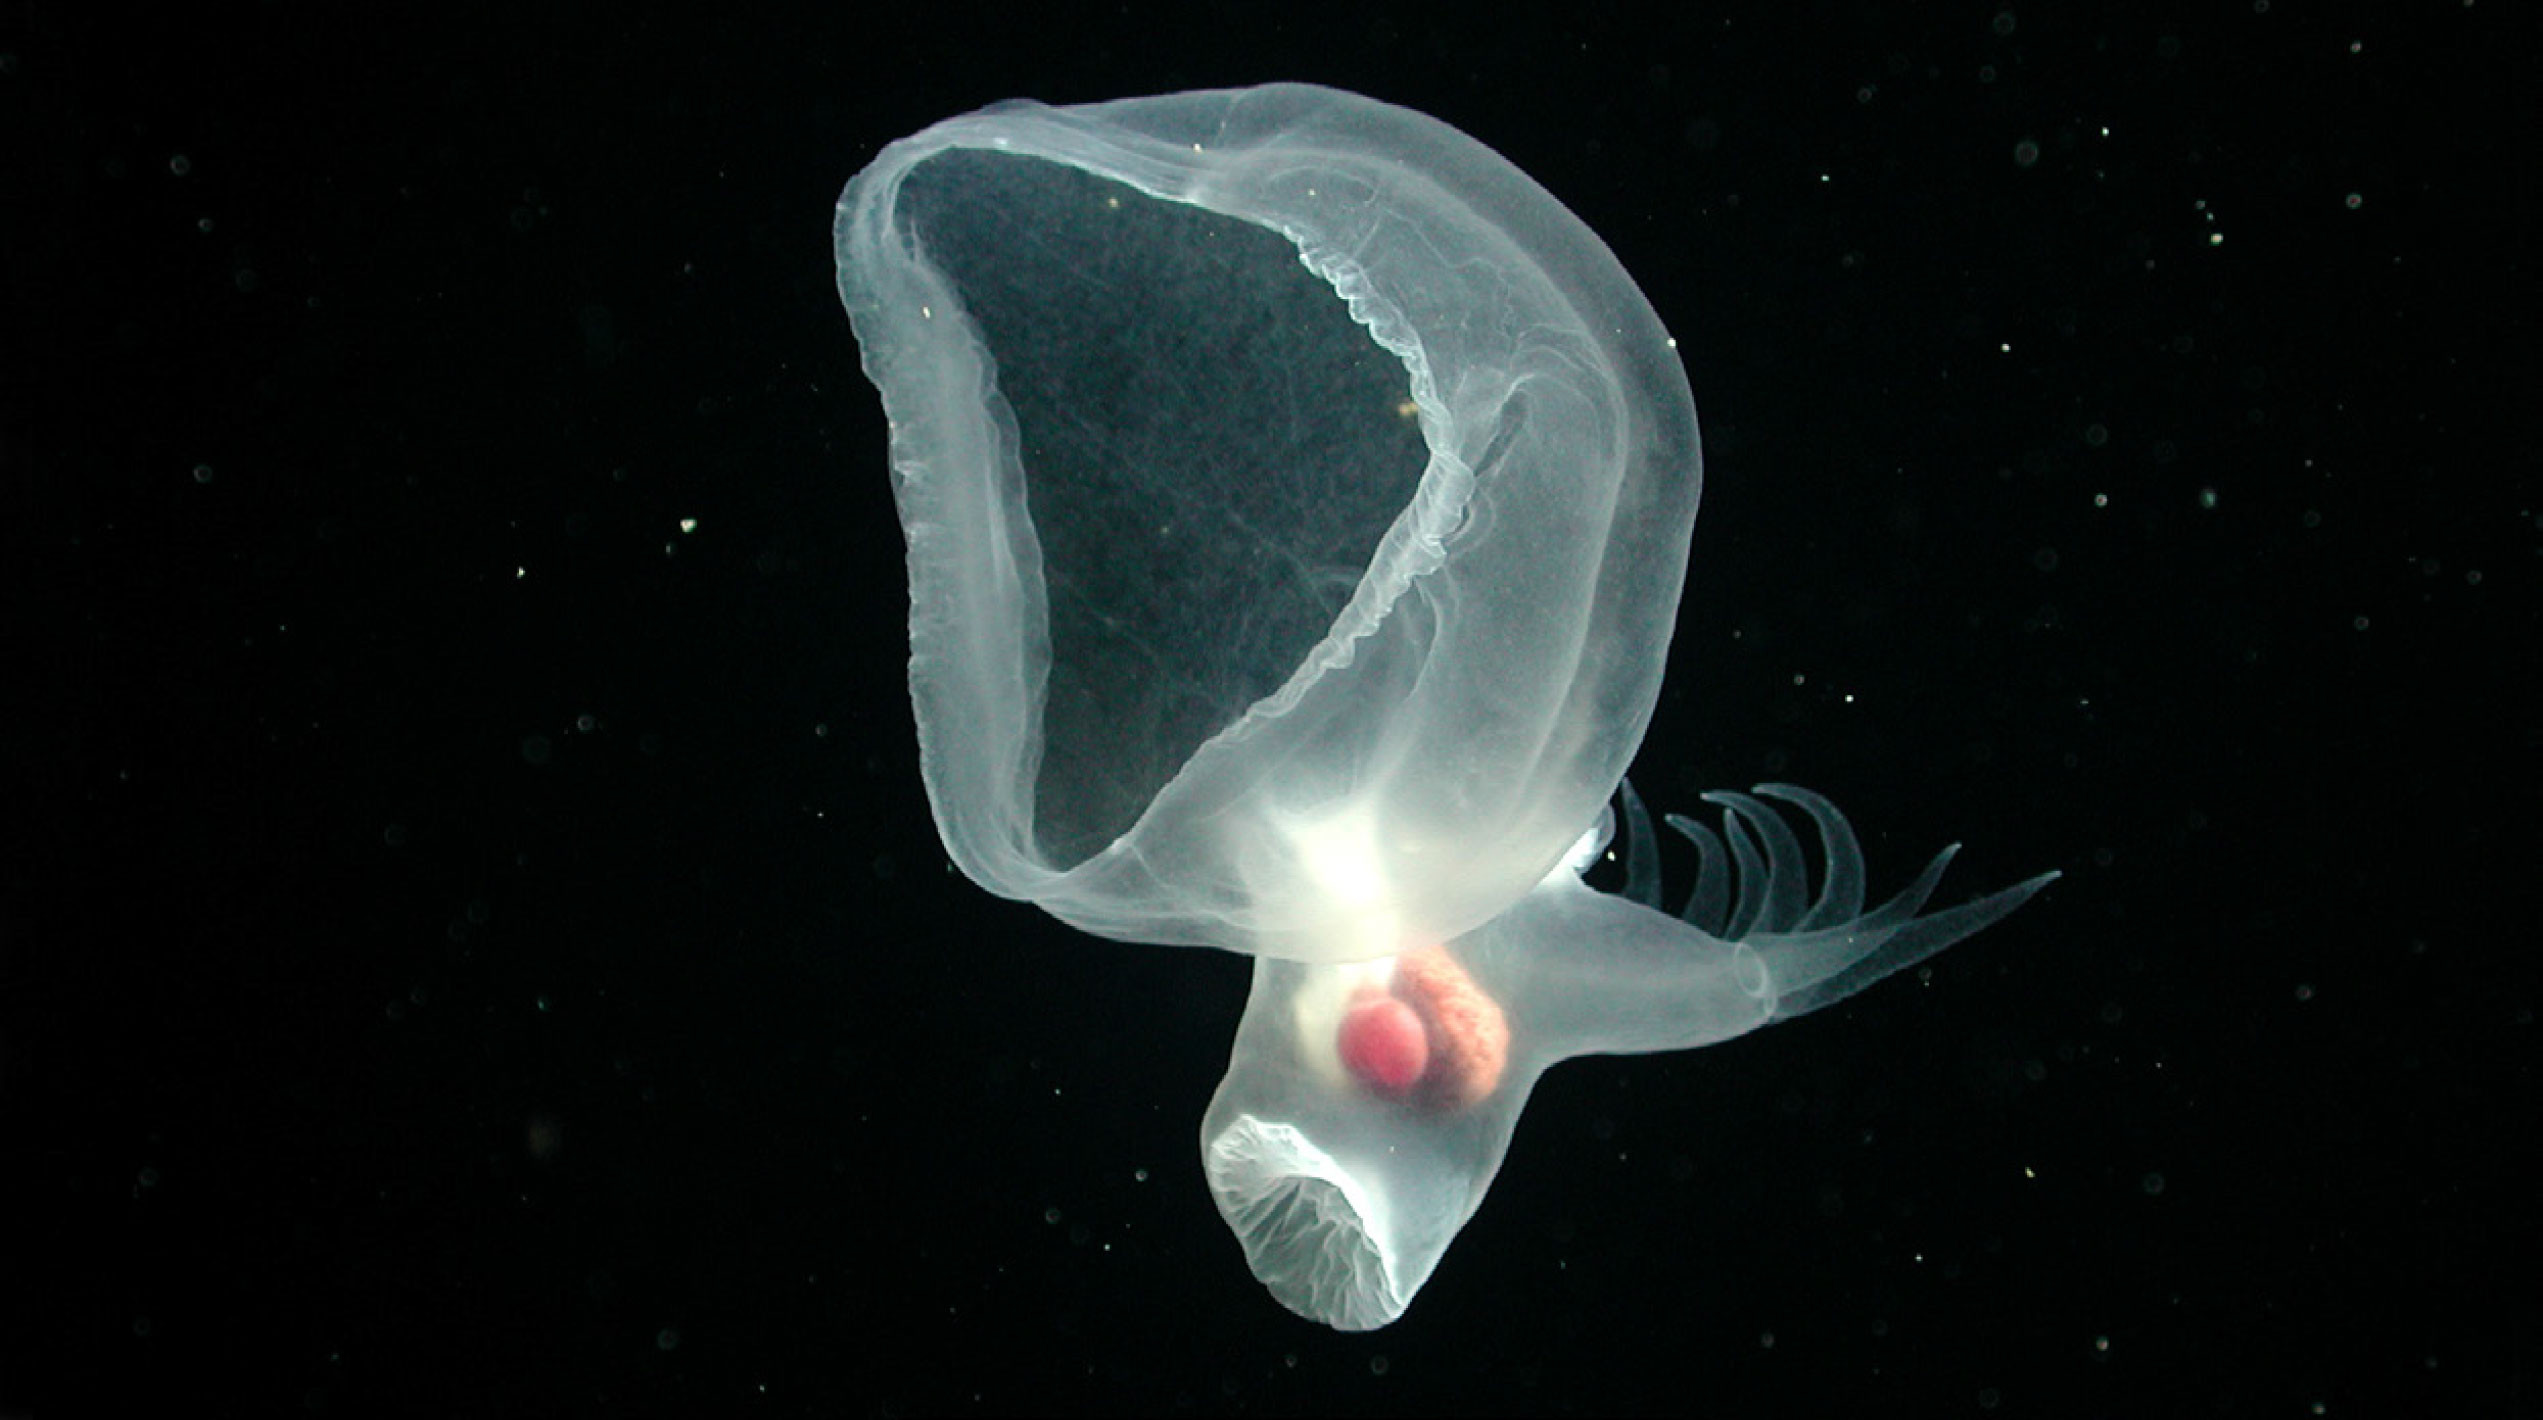
FIGURE 4. This animal was long known as “the mystery mollusc.” Years of observations, experimentation, and specimen collections using remotely operated vehicles (ROVs) ultimately led to its formal description as Bathydevius caudactylus, an entirely new bathypelagic nudibranch genus and species (Robison and Haddock, 2024). Watch the video in the flipbook version of this article. © 2002 MBARI. > High res figure
|
Operating ROVs is less costly and logistically less complex than crewed submersibles, but it still requires a surface support ship and skilled crew. In a step toward reducing the dependency on crewed ships, AUVs are being modified to conduct similar surveys. For example, the i2MAP vehicle built at MBARI (Figure 3c) carries imaging and acoustic systems along with other sensors to reproduce midwater transect capabilities that had long been refined using ROVs. The platform is able to travel faster than an ROV and is quieter (Reisenbichler et al., 2016; Robison et al., 2017). Other AUVs along these lines are rapidly becoming more common and trending smaller in size for both water column and seafloor observations. Just as robots have improved our capacity for biogeochemical sensing, ROVs and AUVs now offer another suite of platforms and tools for probing the “large scale geophysical experiment” that Revelle and Suess foretold.
The Data Deluge
Obtaining high-resolution underwater video observations and conducting in situ experiments have proven to be effective means for documenting ecosystem changes that are occurring over time. For example, in Monterey Bay, changes in oxygen in the water column are linked to observed changes in animal behavior, which in turn has significant implications for food web dynamics (e.g., Figure 5; Robison et al., 2017). A key enabling technology that has made this observation possible is the Video Annotation and Reference System (VARS; Schlining and Stout, 2006; VARS Overview). VARS provides the means to expertly identify what is seen in underwater imagery—a process known as annotation—and merge it with concurrent measurements of relevant physical and chemical parameters. The result is a searchable database that contains geolocated quantitative sightings of particular animals cross referenced with the environmental conditions under which they were observed. VARS is an open-source application that has been adopted by a number groups, including Australia’s Commonwealth Science and Industrial Research Organization (CSIRO), Oregon State University, the University of Hawai‘i School of Ocean and Earth Science and Technology (SOEST), and the National Oceanic and Atmospheric Administration (NOAA). At MBARI, to date, VARS has grown to include nearly 29,000 hours of underwater imagery from which almost 11 million observations of over 4,400 unique “concepts” (e.g., animals, debris, geologic formations) have been cataloged. Nearly 600 peer-reviewed publications and over 300 new species have been described drawing from that archive. The Deep-Sea Guide offers a publicly accessible portal for accessing a portion of VARS content.
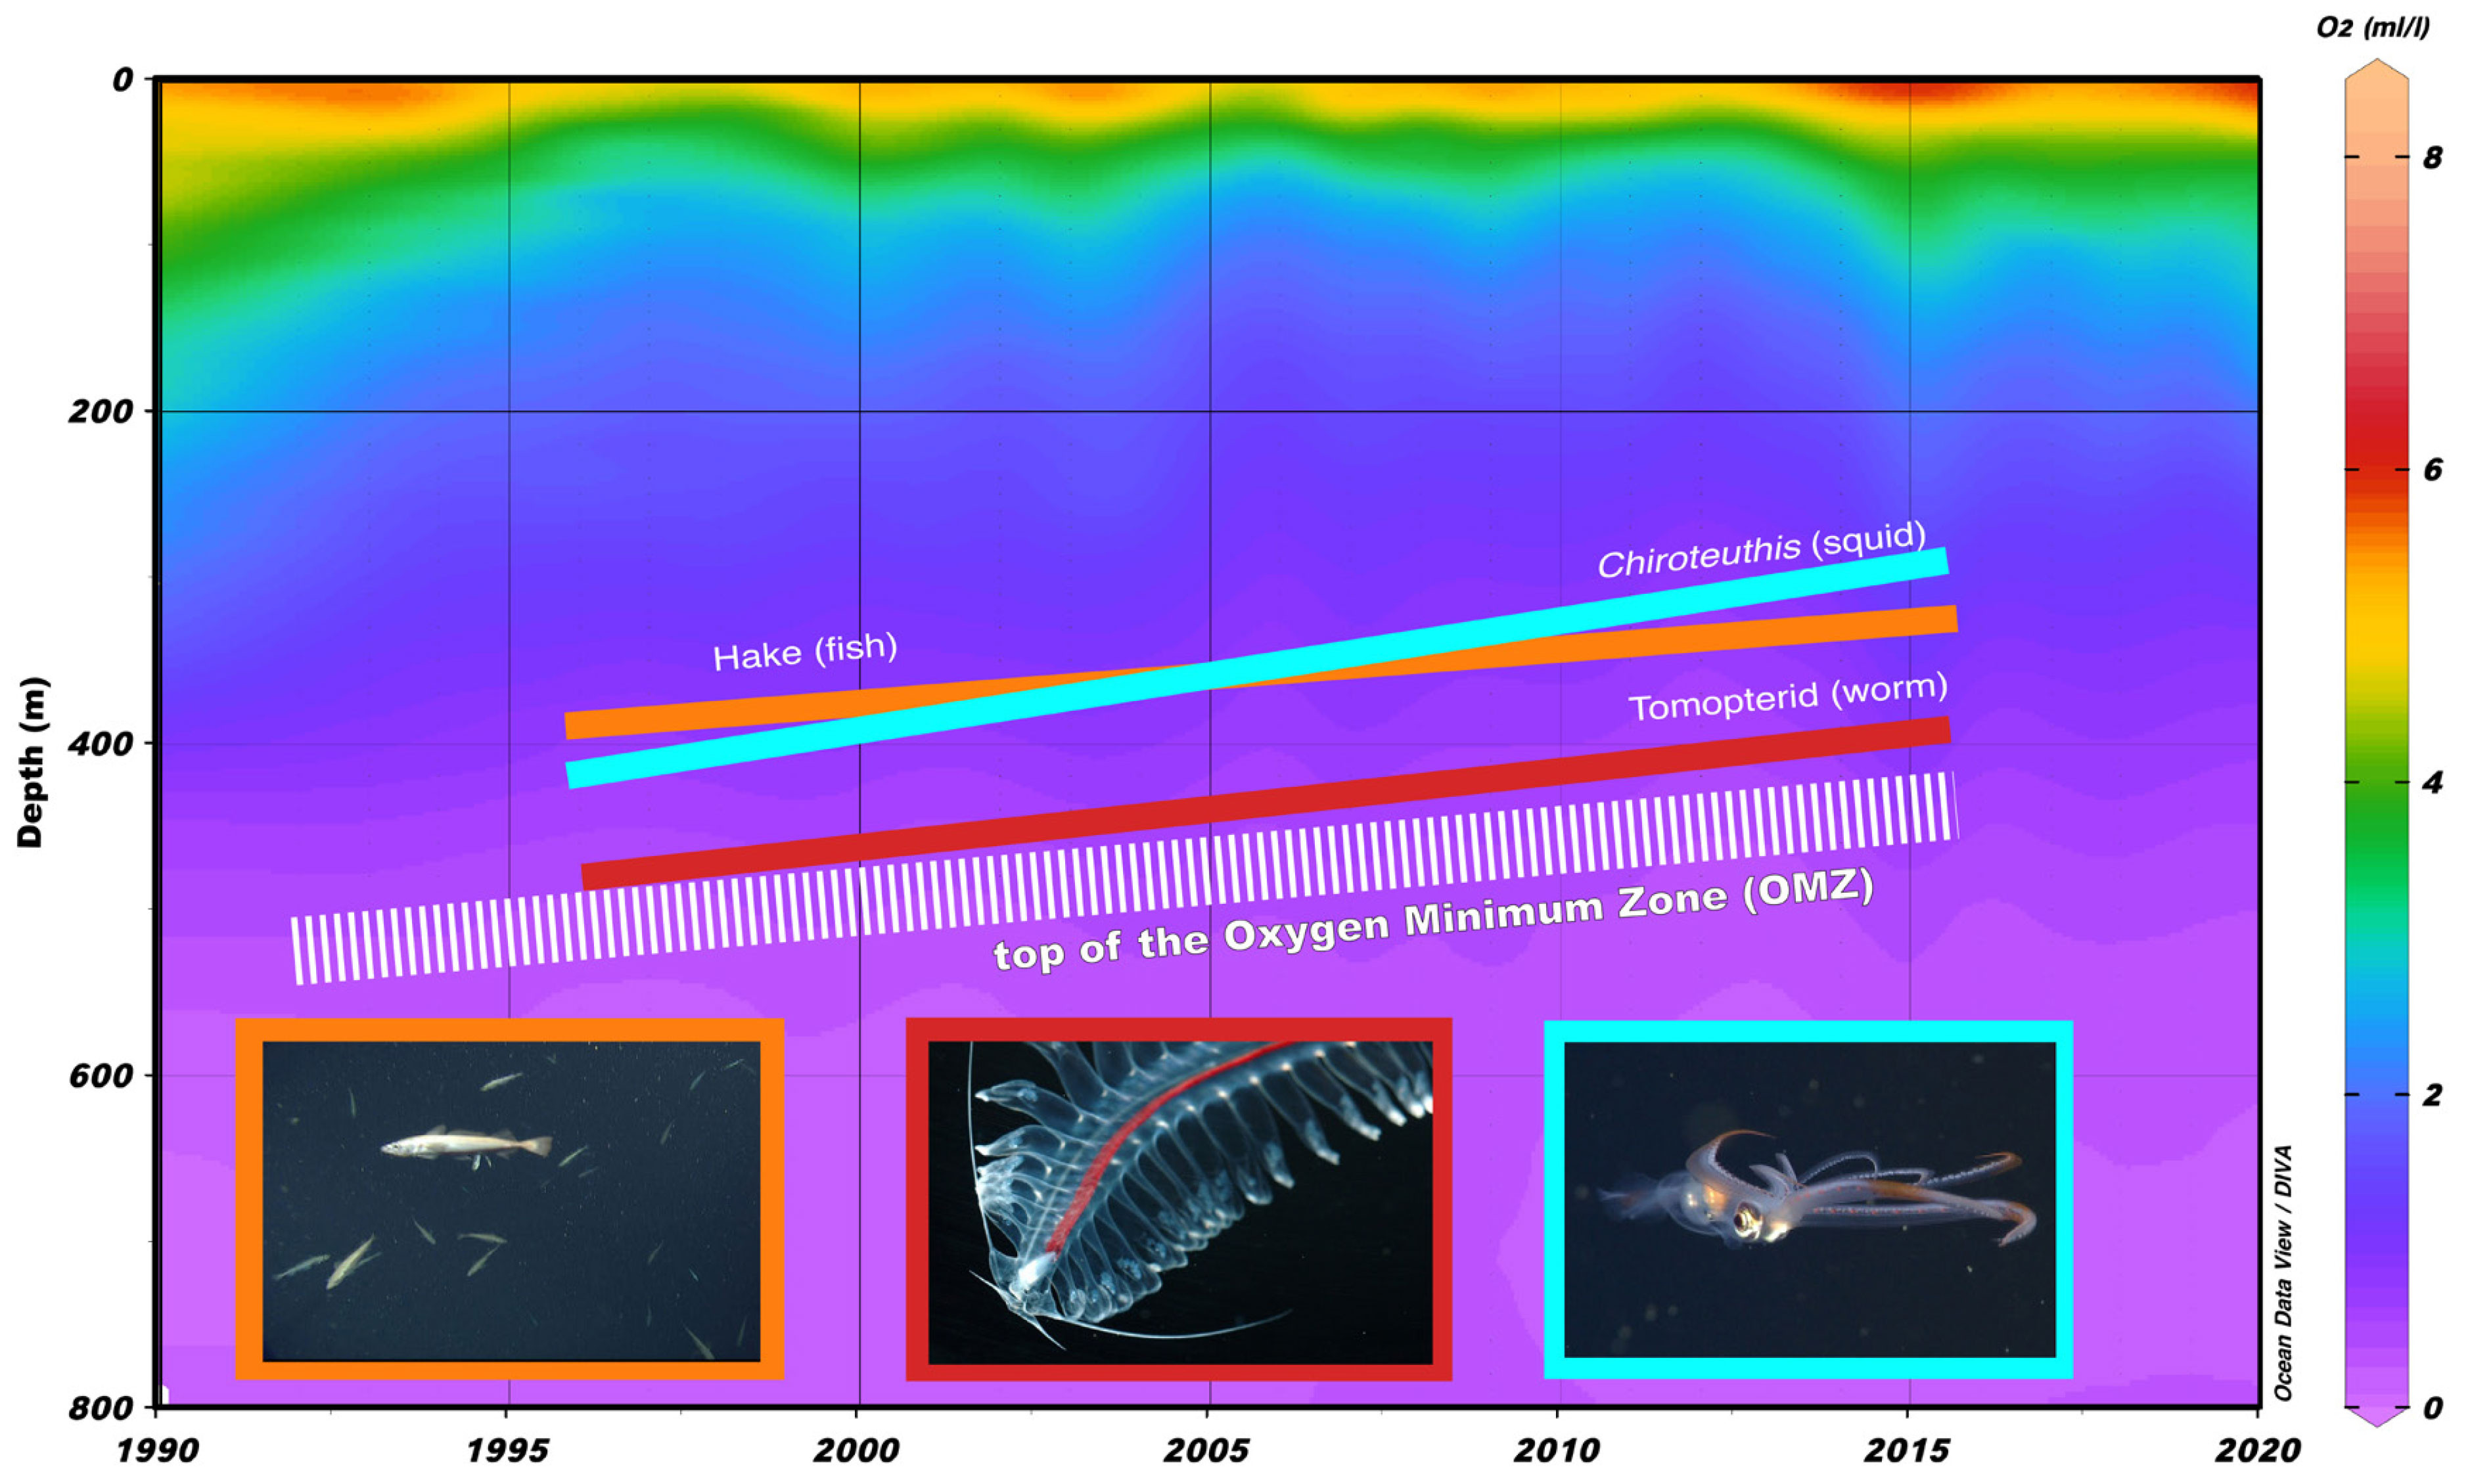
FIGURE 5. Time-series observations document the displacement of several midwater animals toward the surface in response to a shoaling oxygen minimum zone (after Robison et al., 2017). Hake and Chiroteuthis images © 2025 MBARI; Tomopterid image Rob Sherlock © 2007 MBARI. > High res figure
|
With the ever-growing collection of imagery from a multitude of platforms, humans can no longer keep pace with the demand for video annotation and the ancillary data that come with it. Machine learning is now playing a central role in processing that information. At the time of this writing, the VARS annotation pipeline has been improved by using computer models trained on approximately 900,000 localizations of over 1,600 expertly curated concepts to assist with image annotation and identification (Figure 6; VARS-ML). In an effort to federate and coordinate this line of research, FathomNet offers a publicly accessible platform for sharing images and accessing artificial intelligence and machine learning tools to accelerate the analysis of ocean visual data (Katija et al., 2022; Crosby et al., 2023). A companion program, FathomVerse, a free mobile game, offers an interactive science community experience where players engage with real ocean images collected by researchers and robots from around the world. Participants who play the game contribute to improving computer algorithms used to chronicle ocean life while learning about the animals they see, which is proving to be a technologically novel way to expand participation in ocean exploration and discovery.
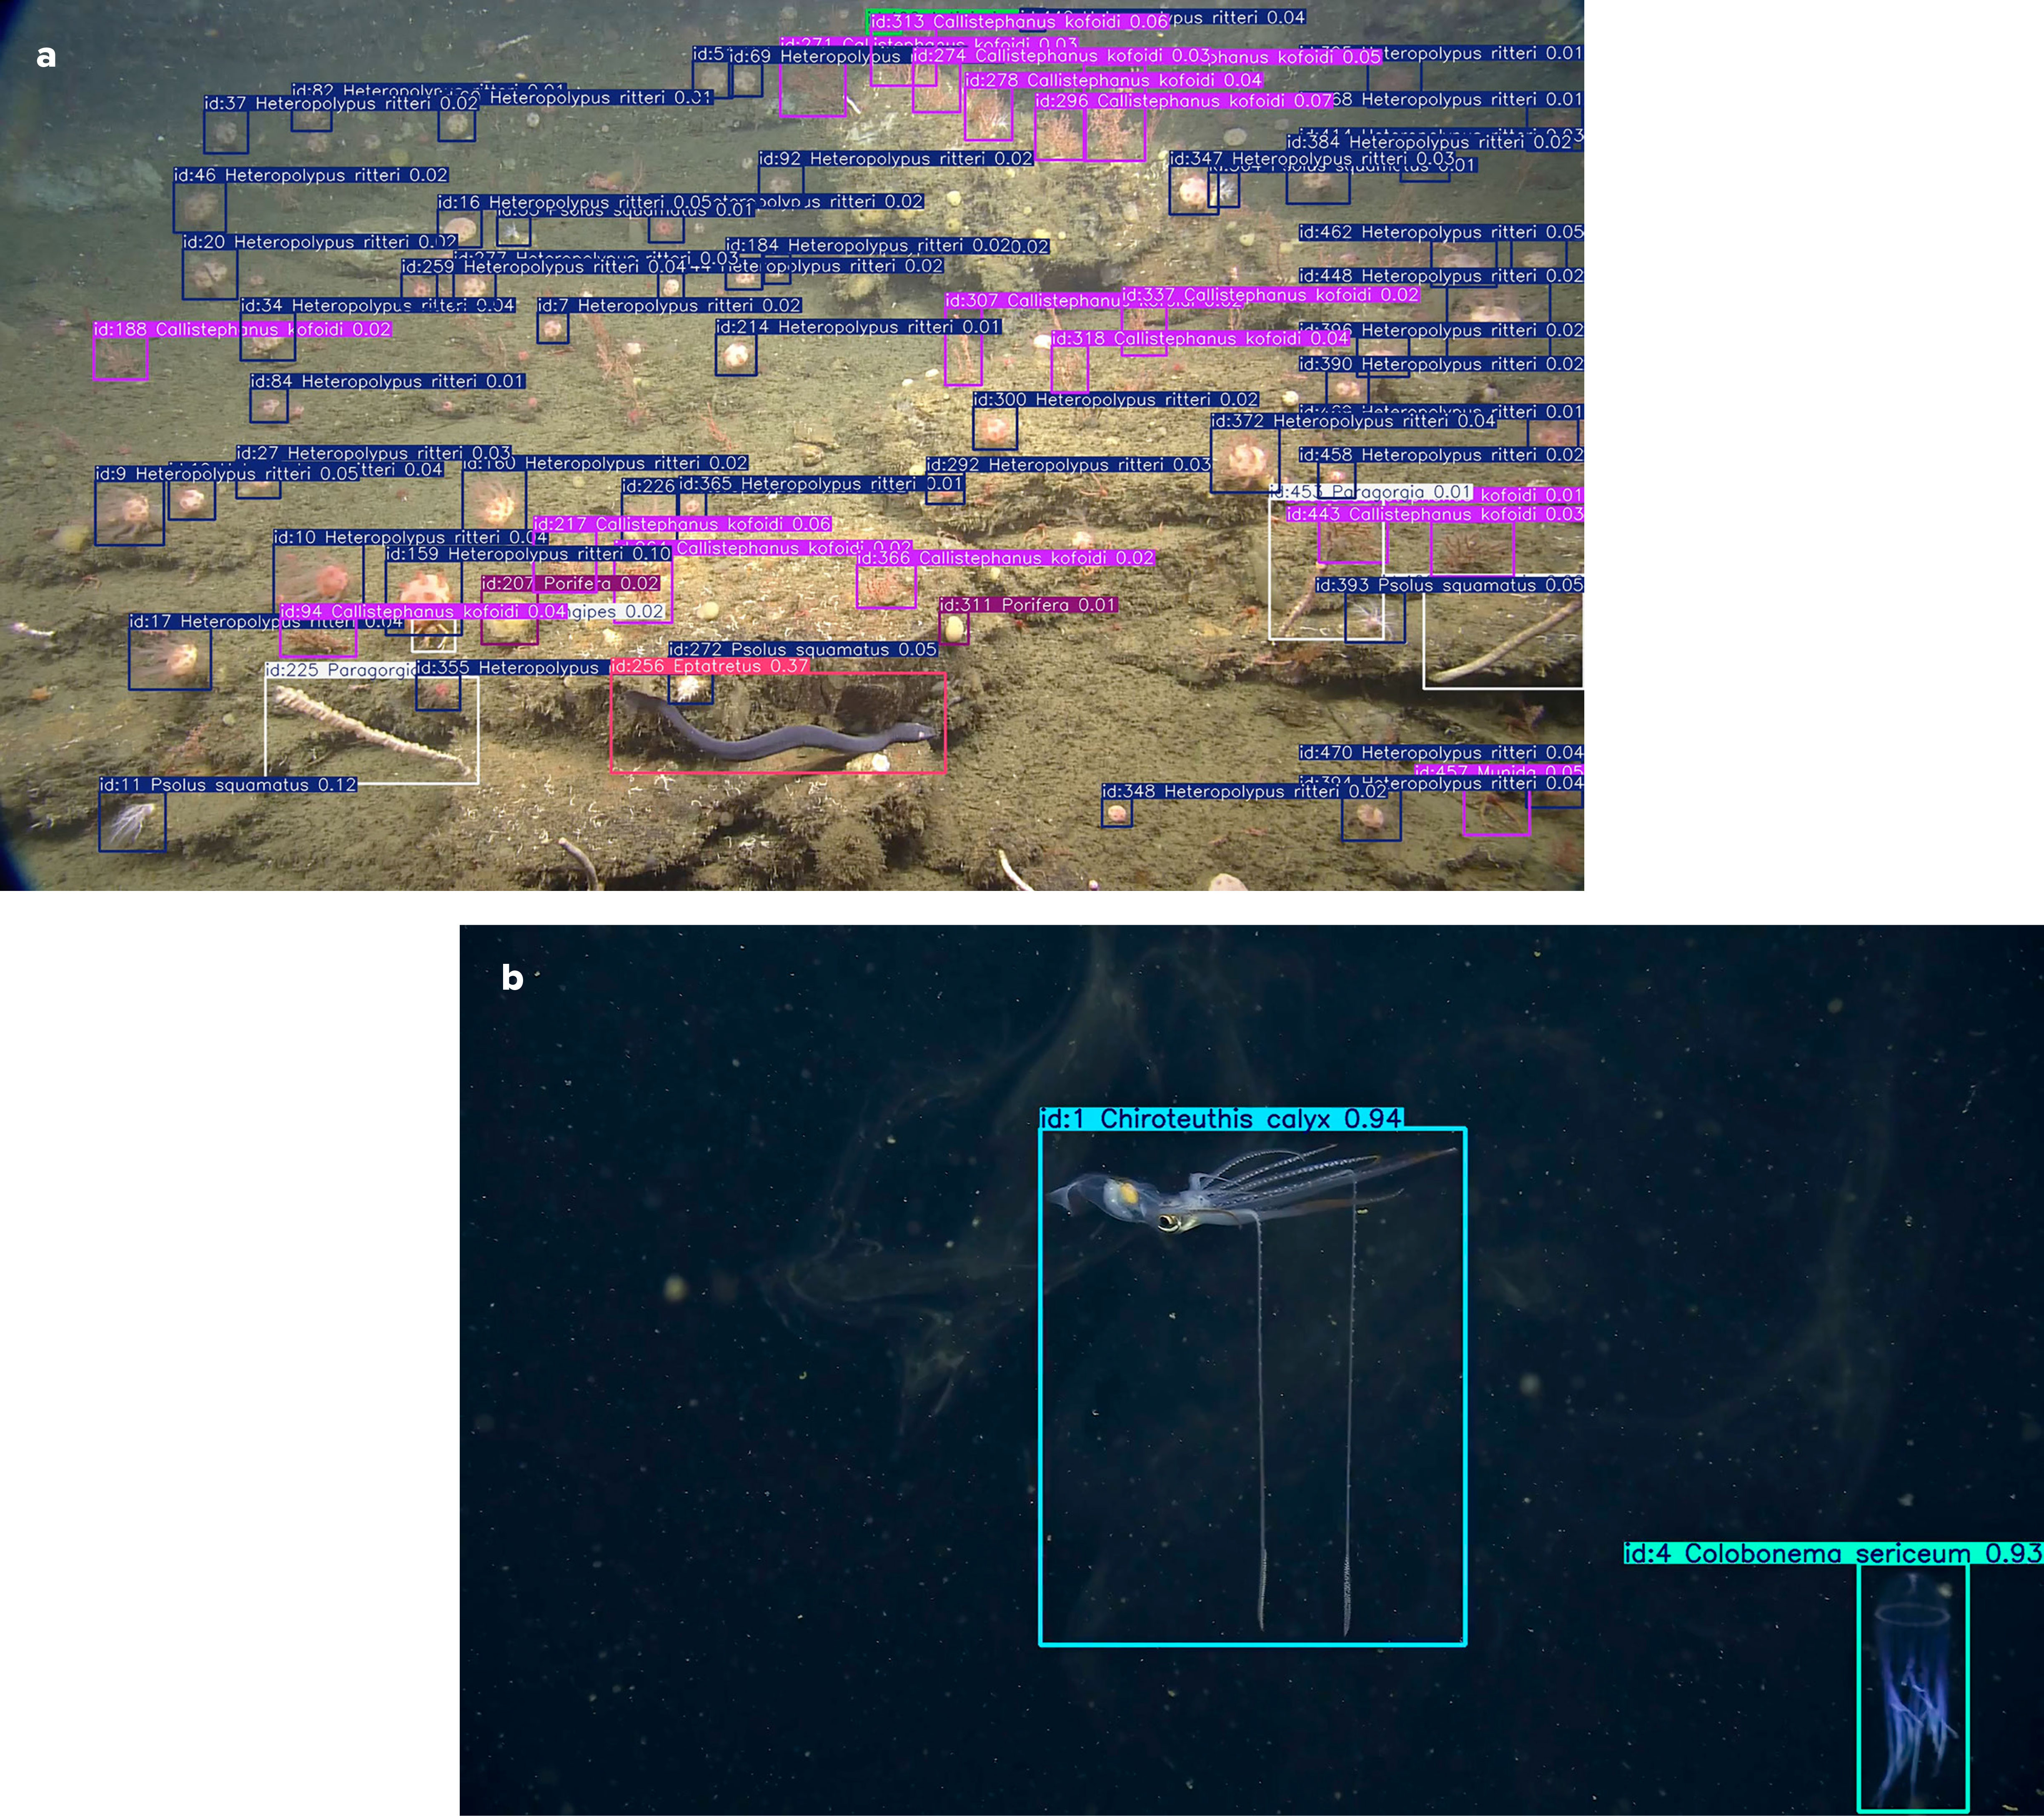
FIGURE 6. Videos are processed using an integration of MBARI’s Video Annotation and Reference System (VARS) with advanced machine learning tools (VARS-ML) to identify and track animals (a) on the seafloor and (b) in the water column. The VARS-ML initiative combines the expertise of marine scientists, engineers, and data scientists. Watch the videos in the flipbook version of this article. Source: Lonny Lundsten and Nancy Jacobsen Stout. Images © 2025 MBARI. > High res figure
|
Machine learning and artificial intelligence can also be used aboard remotely operated and autonomous platforms to process visual and other sensory data in real time. Without any human intervention, vehicles can adapt to dynamic environmental conditions by leveraging physical, chemical, and biological cues that enable them to track marine life over extended periods (e.g., Zhang et al., 2021a, 2021b) and navigate complex terrain in the absence of detailed maps (e.g., Troni et al., in press a, in press b). The power and potential of machine learning and artificial intelligence is only beginning to alter our ability to observe the ocean holistically. In the years ahead, this area of rapid innovation will undoubtedly transform data acquisition, analysis, and dissemination both ashore and at sea. This technology is also an effective means for engaging the next generation of ocean enthusiasts. Robots supercharged with artificial intelligence offer something for everyone. Whether it is the science they enable, the imagery they produce, the computational capability that makes them “smart,” the missions they undertake, or just the impressiveness of the machines themselves, people are simply fascinated by robots.
The Biological Carbon Pump and Vertical Migration
World Wars I and II sparked a revolution in ocean engineering. Submarines were proving to be very effective at sinking combatants and ships carrying supplies to aid the war effort, and a technological advance was needed to detect and intercept them. Sonar (SOund Navigation And Ranging) offered an answer while also providing a way to gauge the depth of the seafloor. As the technology was refined, a reflective layer was sometimes detected in the water column that could be so dense it gave a false sense of the actual depth of the seafloor, even to the extent that ships traveling in uncharted waters reported the presence of phantom shoals. Stranger still, that feature was usually observed to move in rhythm with the time of day, rising at night and descending during the day. The deep scattering layer (DSL), as it came be known, was later associated with dense aggregates of animals (e.g., Ritche, 1953; Dietz, 1962).
The advent of sonar had revealed something amazing: diel vertical migration. Animals who spent daylight hours in the twilight of the deep rose at night to feed, and drew organic carbon with them when descending back to the depths during the day. This behavior accelerates the transport of carbon from surface to deep waters—a phenomenon known as the biological pump—contributing to the ocean’s role in modulating climate while also providing food for animals and microbes throughout the water column and on the seafloor (e.g., Robison et al., 2005; Brierley, 2014; Honjo et al., 2014; K.L. Smith et al., 2017; Archibald et al., 2019). The same processes can also transport microplastics, which has led to the suggestion that a large, previously unknown reservoir of marine microplastics may be contained within animal communities living in the deep sea. (Choy et al., 2019).
Comprehensively investigating the players and processes that transform and transport organic matter from the sea surface to the seafloor over decades is not easy (e.g., Messié et al., 2023). The distribution and behavior of the participants and the material they transform and produce varies tremendously in time and space, challenging our ability to model biologically driven carbon flux and resultant climate influence. Persistent observations of the ocean using a variety of tools is a necessary step toward meeting that grand challenge (e.g., Karl, 2014; Chavez et al., 2021a).
Listening and Decoding What Animals Leave in Their Wake
It is truly amazing what you can learn by listening. The history of ocean soundscape analysis is a great example. In the mid-4th century BCE, the ancient Greek philosopher Aristotle in his landmark work History of Animals noted that sea creatures produced sounds (see Thompson, 1910). Ancient mariners also marveled at the mysterious noises that occasionally resonated through the hulls of their ships. Over millennia, these astute observations gave way to curiosity-driven research and wartime pursuits that exploited ocean sound. Following World War II, revelations about the lives and vocalizations of charismatic megafauna piqued the public’s interest, popularizing the idea of an ocean soundscape and highlighting the mysteries of marine mammal communication (e.g., Schevill and Lawrence, 1949; Payne and McVay, 1971). In an all too familiar fashion, it did not take long to learn that human activities are a source of ocean soundscape pollution that can be injurious to marine wildlife (e.g., Hildebrand, 2009). Although the notion of an ocean soundscape is ancient, and its use in ocean studies has long been the subject of intensive research and development, we continue to make remarkable discoveries by simply listening with increasingly sophisticated means for doing so.
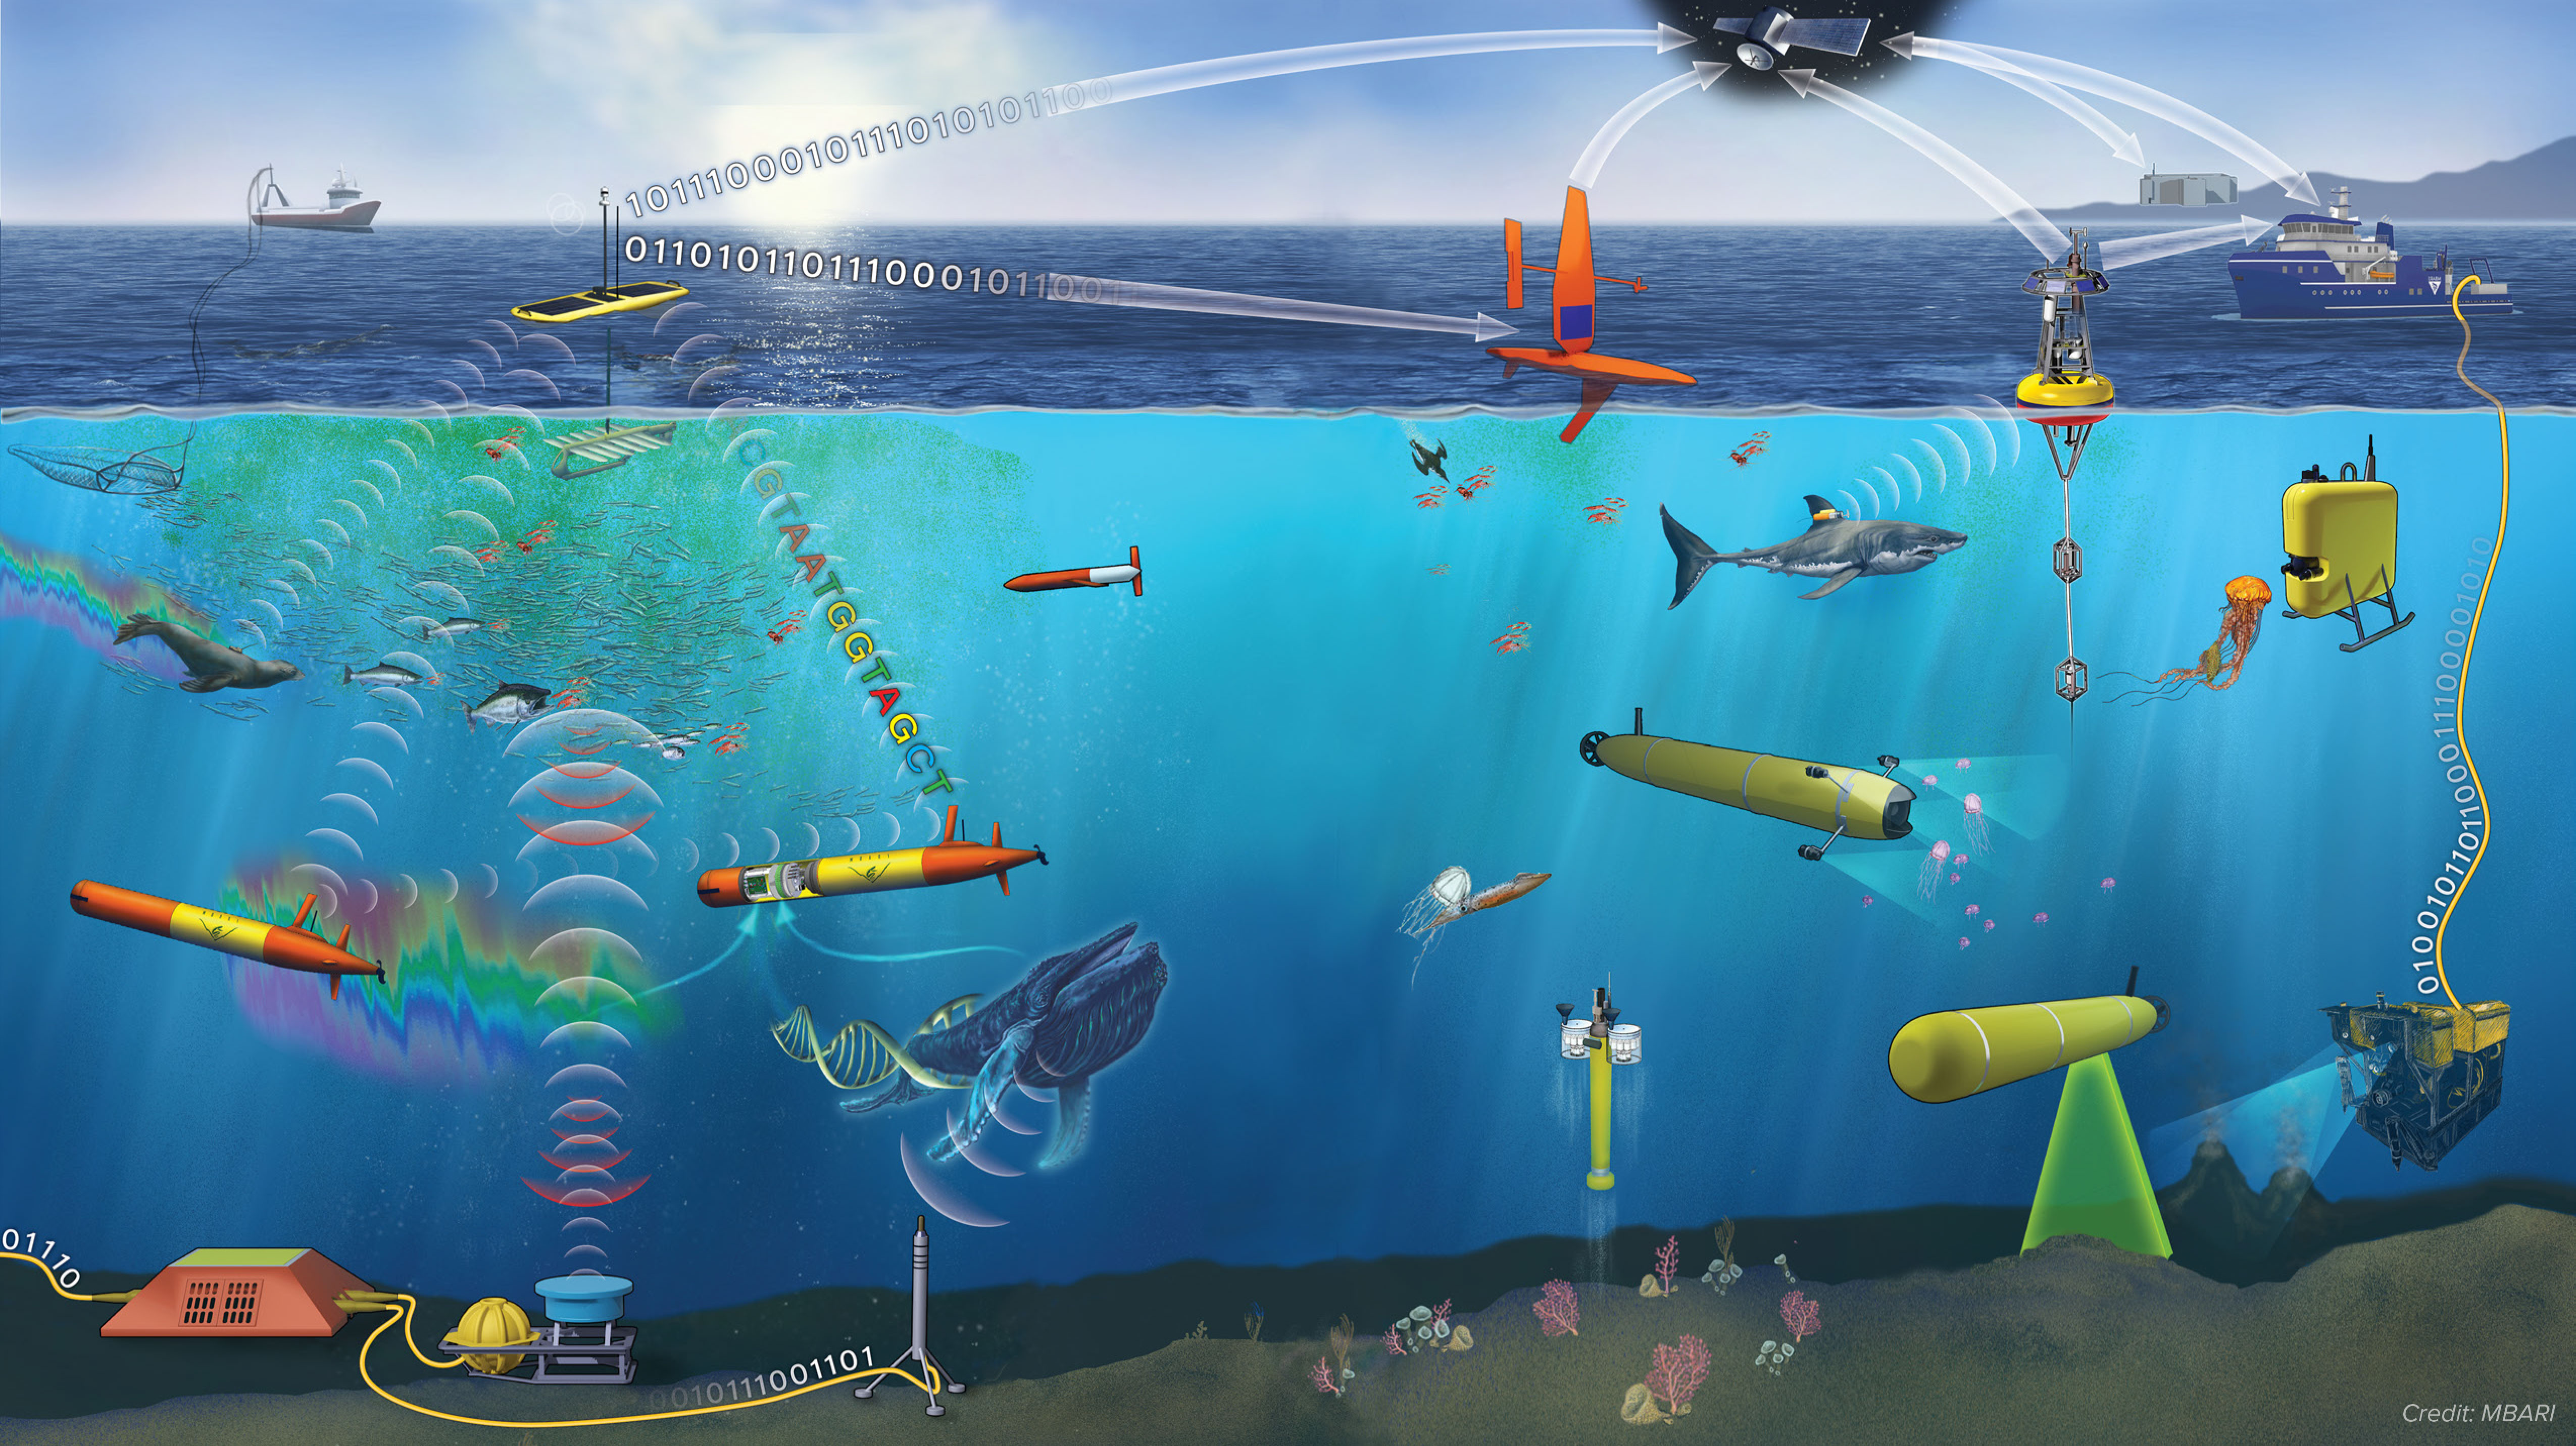
Today, detailed observations of the comings and goings of marine animals is greatly enhanced by soundscape analysis (e.g., Oestreich et al., 2022, 2024; Ryan et al., 2022, 2025). The combination of passive and active acoustic observations has proven useful in investigating predator foraging behaviors and the ecology of fear (e.g., Benoit-Bird et al., 2019; Urmy and Benoit-Bird, 2021). “Listening with light” by way of using fiber-optic cables as vibration sensors—a technique known as distributed acoustic sensing (DAS)—is the latest evolution in the ongoing push to broaden access to and analysis of the ocean soundscape (Saw et al., 2025). By combining fleets of ASVs and AUVs equipped with acoustic, imaging, and water sampling payloads, a new perspective on the movements of animals traversing the environment in response to ever changing ocean conditions is emerging, including by tracking the traces of “genetic soup” shed in their wakes (e.g., Zhang et al., 2021b; Figure 7).
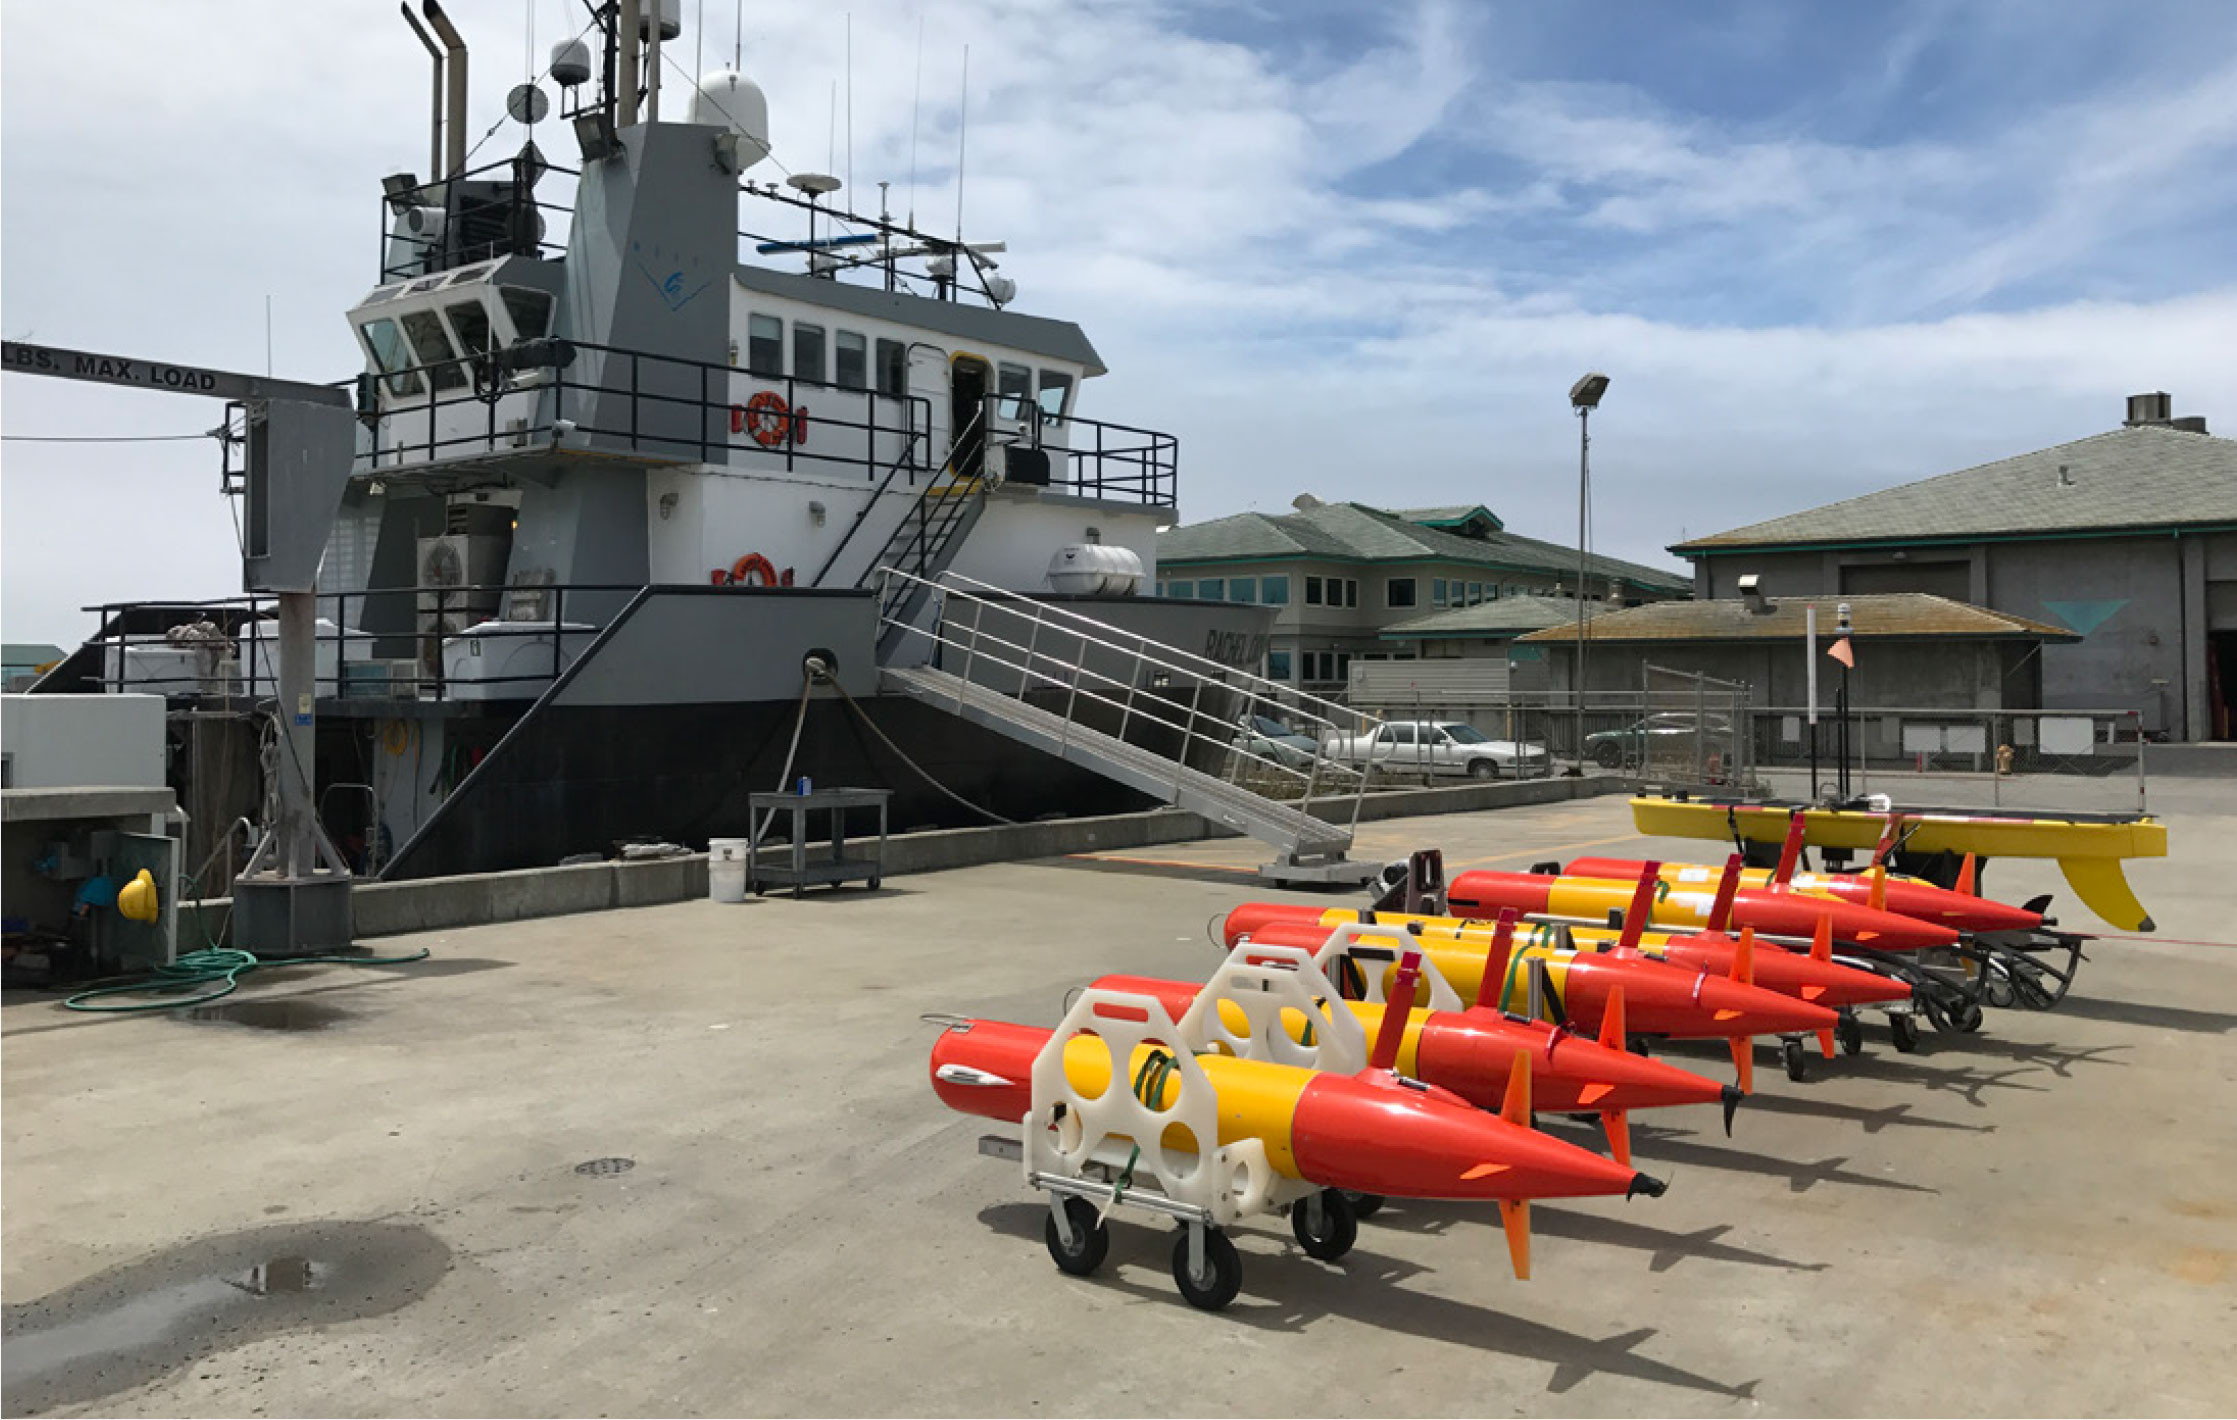
FIGURE 7. A fleet of long-range autonomous underwater vehicles (AUVs; Hobson et al., 2012) fitted with different imaging, water sampling, and eDNA collection payloads are lined up alongside a Liquid Robotics Wave Glider, all readied for deployment in Monterey Bay. The fleet of vehicles allows coordinated observations for extended periods to provide a multifaceted view of dynamic ecosystem processes. After Zhang et al. (2021a,b). Susan von Thun © 2017 MBARI. > High res figure
|
The use of organisms’ DNA and RNA (and other methods) to reveal what species are present and how they are responding to their environments has advanced in concert with the development and application of ocean imaging and acoustics. The tools and techniques employed have storied pasts and spring from the creativity and insights of many investigators over decades. What has come to be known as “ecogenomics” is deeply rooted in subcellular biological studies and molecular analytical methods for detecting and decoding the very essence of life itself. Just as underwater imaging and soundscape analysis grew from industrial uses and for purposes unrelated to ocean ecology, molecular biology, nucleic acid sequencing, bioinformatics, and other methods unrelated to marine science were adopted for ocean applications, forever altering the course of modern marine biology. Microbial ecologists arguably led the way (e.g., Pace, 1985; Karl, 2014).
In a surprising twist, Ficetola et al. (2008) discovered that DNA shed by frogs could be detected in the environment in which they lived even when you could not see the animals themselves, sparking an environmental DNA (eDNA) forensics revolution (e.g., Kelly et al., 2014; Stoeckle et al., 2024). The analysis of eDNA offers a noninvasive method for assessing biodiversity and tracking animal movements by collecting samples of water and sequencing the recovered material, enabling simultaneous detection of marine organisms across multiple trophic levels (e.g., Chavez et al., 2021b). As eDNA analysis has evolved, our eyes have been opened to the notion of “genetic dark matter” that is recoverable from the environment but has no described source or, in some cases, no well-characterized function (e.g., Venter et al., 2004; Roux et al., 2015; Delmont et al., 2022). Analysis of the sea’s genetic soup tells us that there is a great deal of marine life and genetic capacity that has not yet been characterized.
Just as machine learning and artificial intelligence have played a huge role in analyzing and reacting to ocean imagery and sound, they are likewise fueling the analysis of eDNA to synthesize an integrated picture of a complex web of life. Although the detection and real-time analysis of imagery, sound, and other bulk water properties are now commonly employed to guide autonomous platforms during targeted field observations, devices that enable in situ, “hands off,” real-time analysis of eDNA and other cellular metabolites are still very much in their infancy (e.g., Scholin et al., 2017). With a few notable examples (e.g., Truelove et al., 2019; Peter Thielen et al., Johns Hopkins University, pers. comm., 2025), marine eDNA surveys rest largely on the acquisition, preservation, and return of samples for shoreside analysis (Yamahara et al., 2019; Zhang et al., 2021a; Truelove et al., 2022; Preston et al., 2023). Despite the progress, scaling up the use of robots that enable integrated optical, acoustic, and “omic” characterization of the sea presents a very significant technological challenge when compared to using profiling floats to conduct global scale biogeochemical observations.
To the Seafloor
Descending to the seafloor, whether using a crewed submersible or an ROV, has been likened to being dropped into a pitch-black room and using only a flashlight to see what lies ahead. Remarkable discoveries have been made by picking dive sites that are known to offer different types of terrain that might lead to finding something novel. The discovery of the “octopus garden” near the base of Davidson Seamount offers an excellent, recent example of using ship-acquired bathymetry to guide an exploratory ROV dive that serendipitously uncovered something remarkable (King and Brown, 2019). No doubt that method works, but the area that can be covered is limited, and for the most part, you have no detailed map to lead the way. AUVs are changing that calculus. Low-resolution, surface-vessel-based maps can now be used to guide higher-resolution AUV-based surveys. AUVs can run in close proximity to the ground compared to a vessel at the sea surface, thus providing much more detail on what lies below. The combination of nested surface vessel-AUV-ROV surveys has greatly aided our understanding of underwater landscapes and how they evolve, and this approach now informs choices on what locations to observe more closely and repeatedly to improve the odds of making new discoveries (e.g., Caress et al., 2008, 2012; Paull et al., 2010; Paduan et al., 2018, Figure 8).
Even highly detailed bathymetric surveys fail to reveal much about the animals that inhabit the seafloor. With relatively few exceptions, most life on the seabed is sub-meter scaled and often transparent to acoustic energy. By combining high-resolution laser and optical imagery with acoustic mapping, a truly astounding view of the seafloor emerges (Figure 9). The systems for acquiring that information can be deployed on ROVs (e.g., Caress et al., 2025) and are extendable to AUVs, greatly expanding the area that can be surveyed in detail. Processing the imagery collected using machine learning techniques also holds promise for significantly speeding up quantitative assessments of specific animals or other features of interest even while the vehicle is underway. Further study of the famed octopus garden provides a stunning example of what is possible when combining different modes of seafloor visualizations to inform targeted studies that not long ago would have seemed a pipe dream (Barry et al., 2023; Figure 9). Similar studies of deep-sea coral and sponge communities found serendipitously at Sur Ridge and elsewhere paint a similar picture (Girard et al., 2024; Figure 10). These discoveries highlight what is made possible by using a combination of hybrid human-machine and fully autonomous systems for visualizing the seafloor.
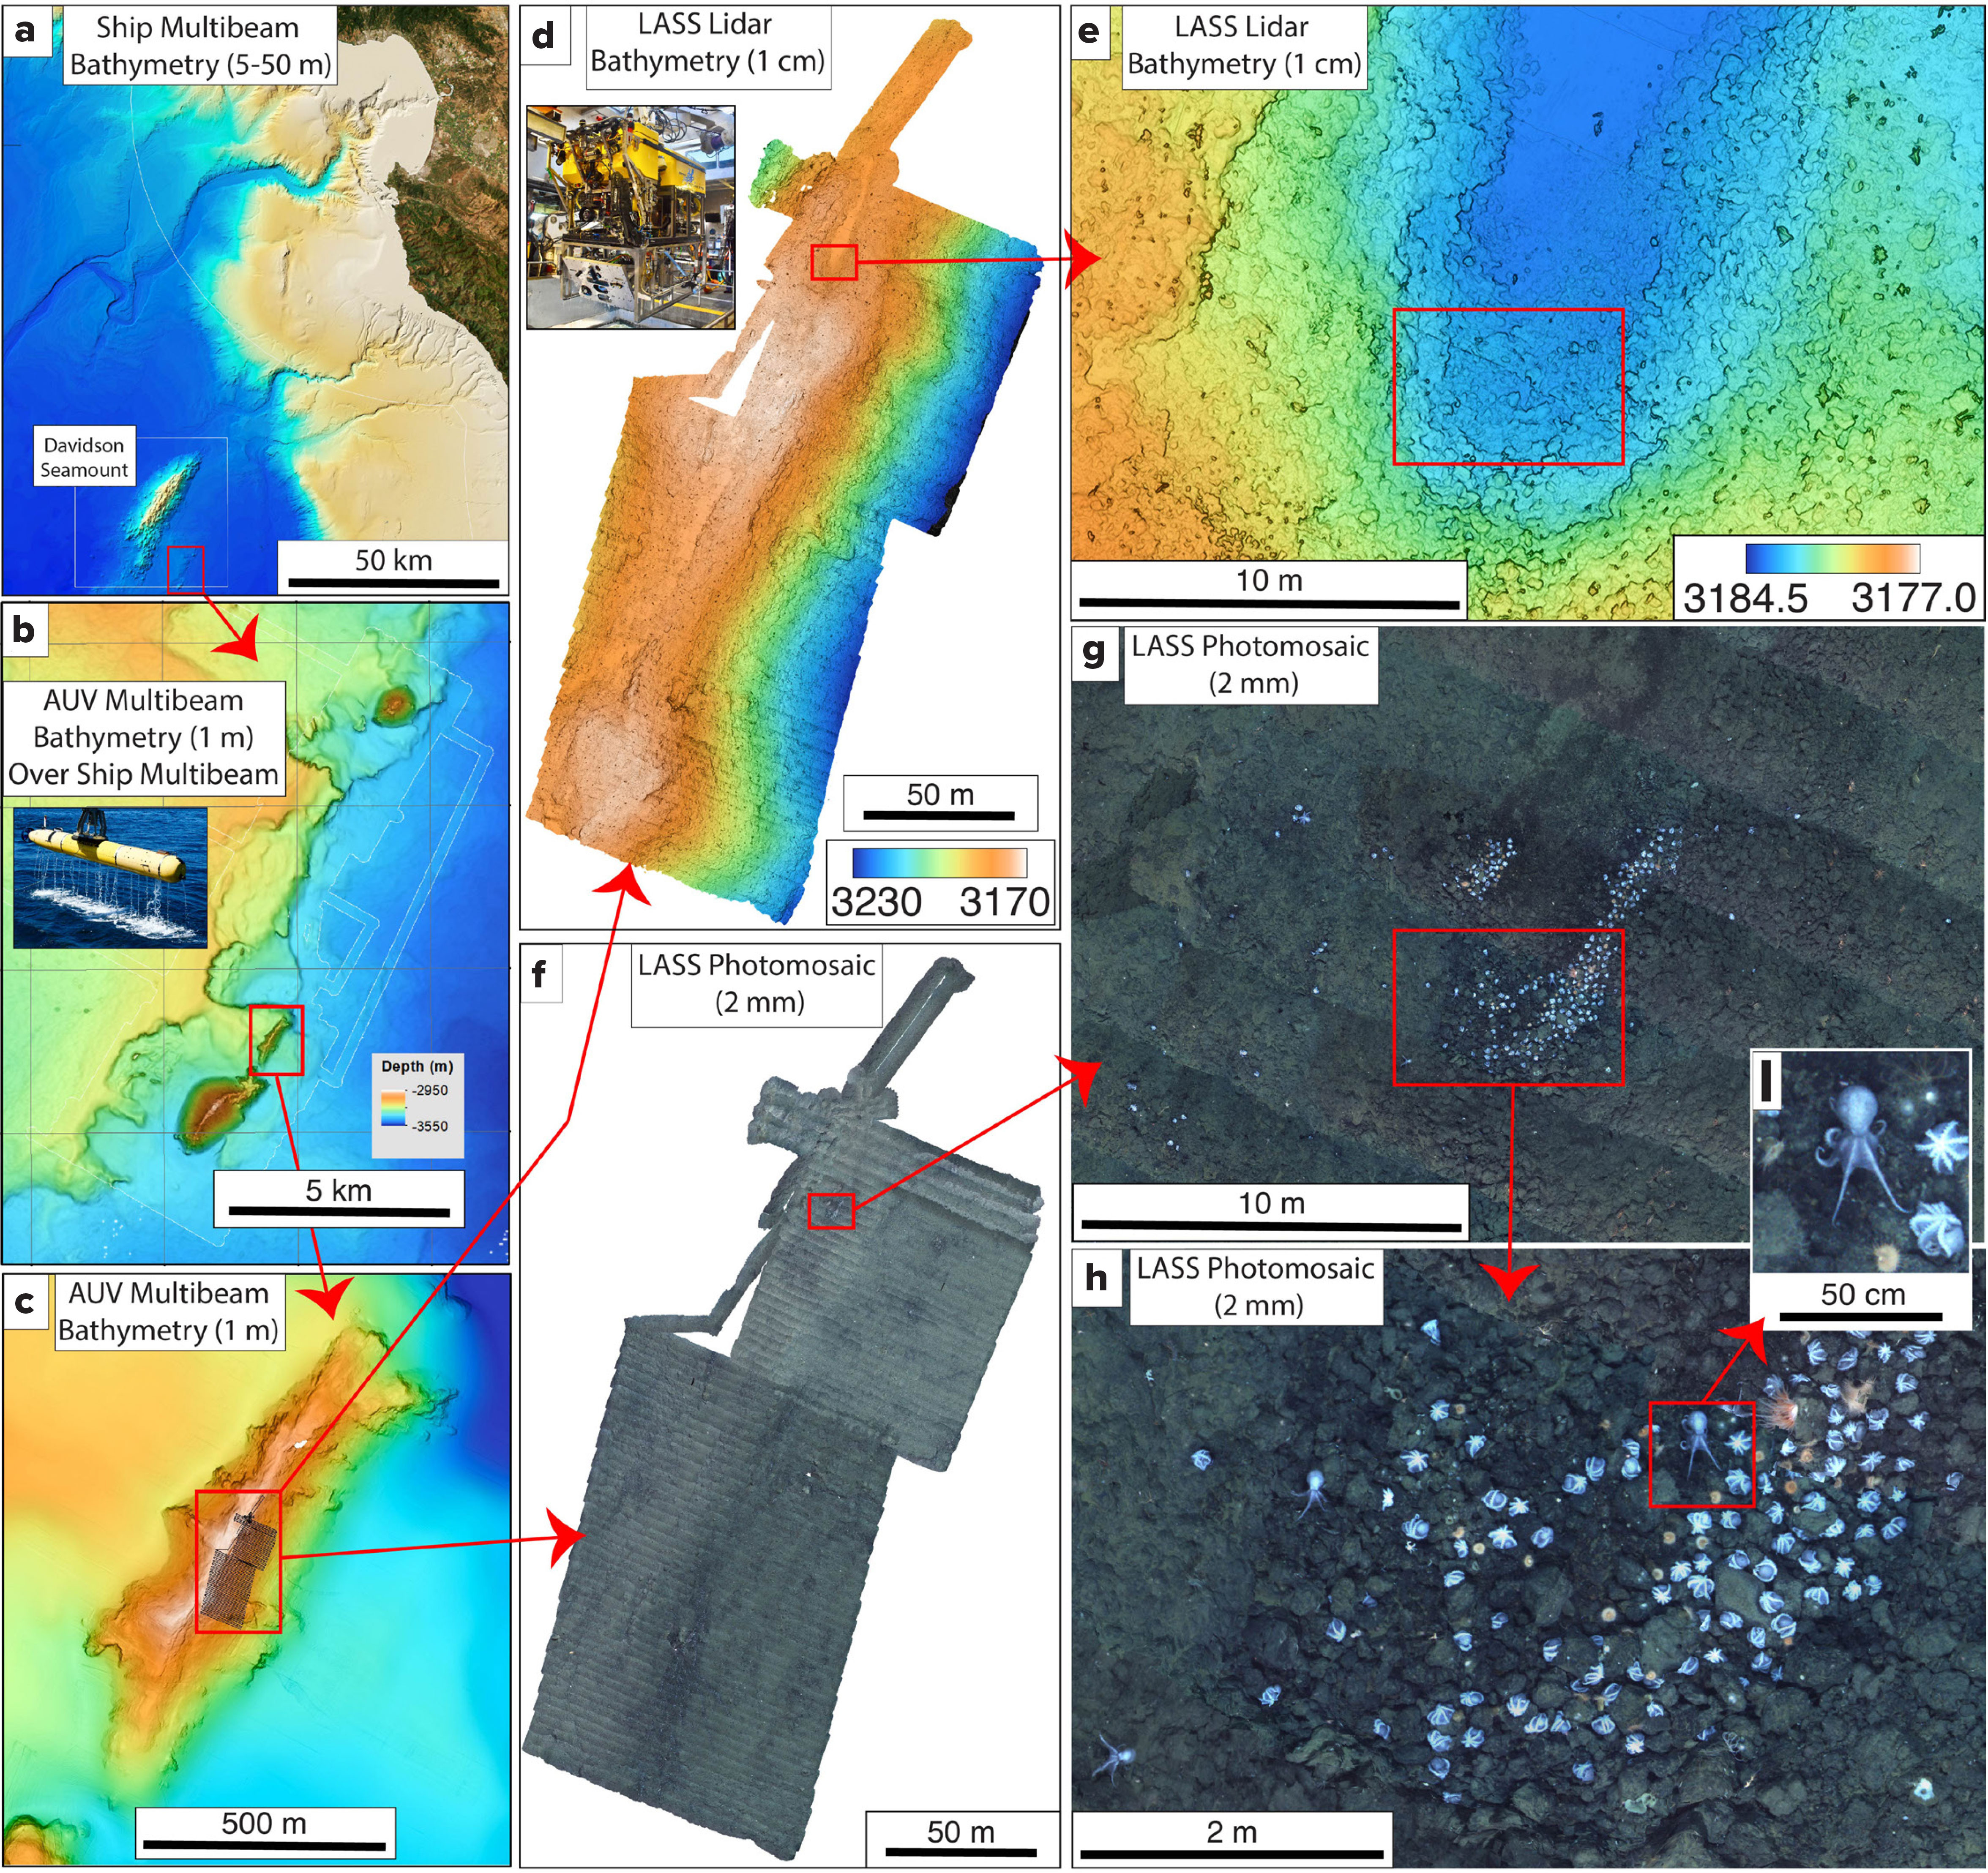
FIGURE 9. The use of nested resolution seafloor mapping to reveal the Octopus Garden. (a) Seafloor bathymetry collected using ship-based multibeam sonar yielded 5–50 m resolution, depending on water depth. The red box indicates the location of the Octopus Garden pearl octopus (Muusoctopus robustus) brooding site, southeast of Davidson Seamount. (b) MBARI’s seafloor mapping AUV (inset) provides 1 m resolution bathymetry that is shown here overlain on the base map acquired from ships. The red box indicates the location of Octopus Garden Ridge. (c) Octopus Garden Ridge at 1 m-scale is overlain here with ROV survey track lines. (d) The ROV-mounted Low Altitude Survey System (LASS; inset) is used to provide 1 cm resolution bathymetry and 2 mm resolution seafloor photography using a combination of multibeam sonar, lidar, and color still cameras. (d) and (e) The 1 cm LASS lidar bathymetry is shown at two map scales. (f), (g), (h), and (i) These panels show the 2 mm-scale color photomosaics at four map scales, zooming in to individual animals. Source: David Caress and James Barry. Images © 2025 MBARI. > High res figure
|
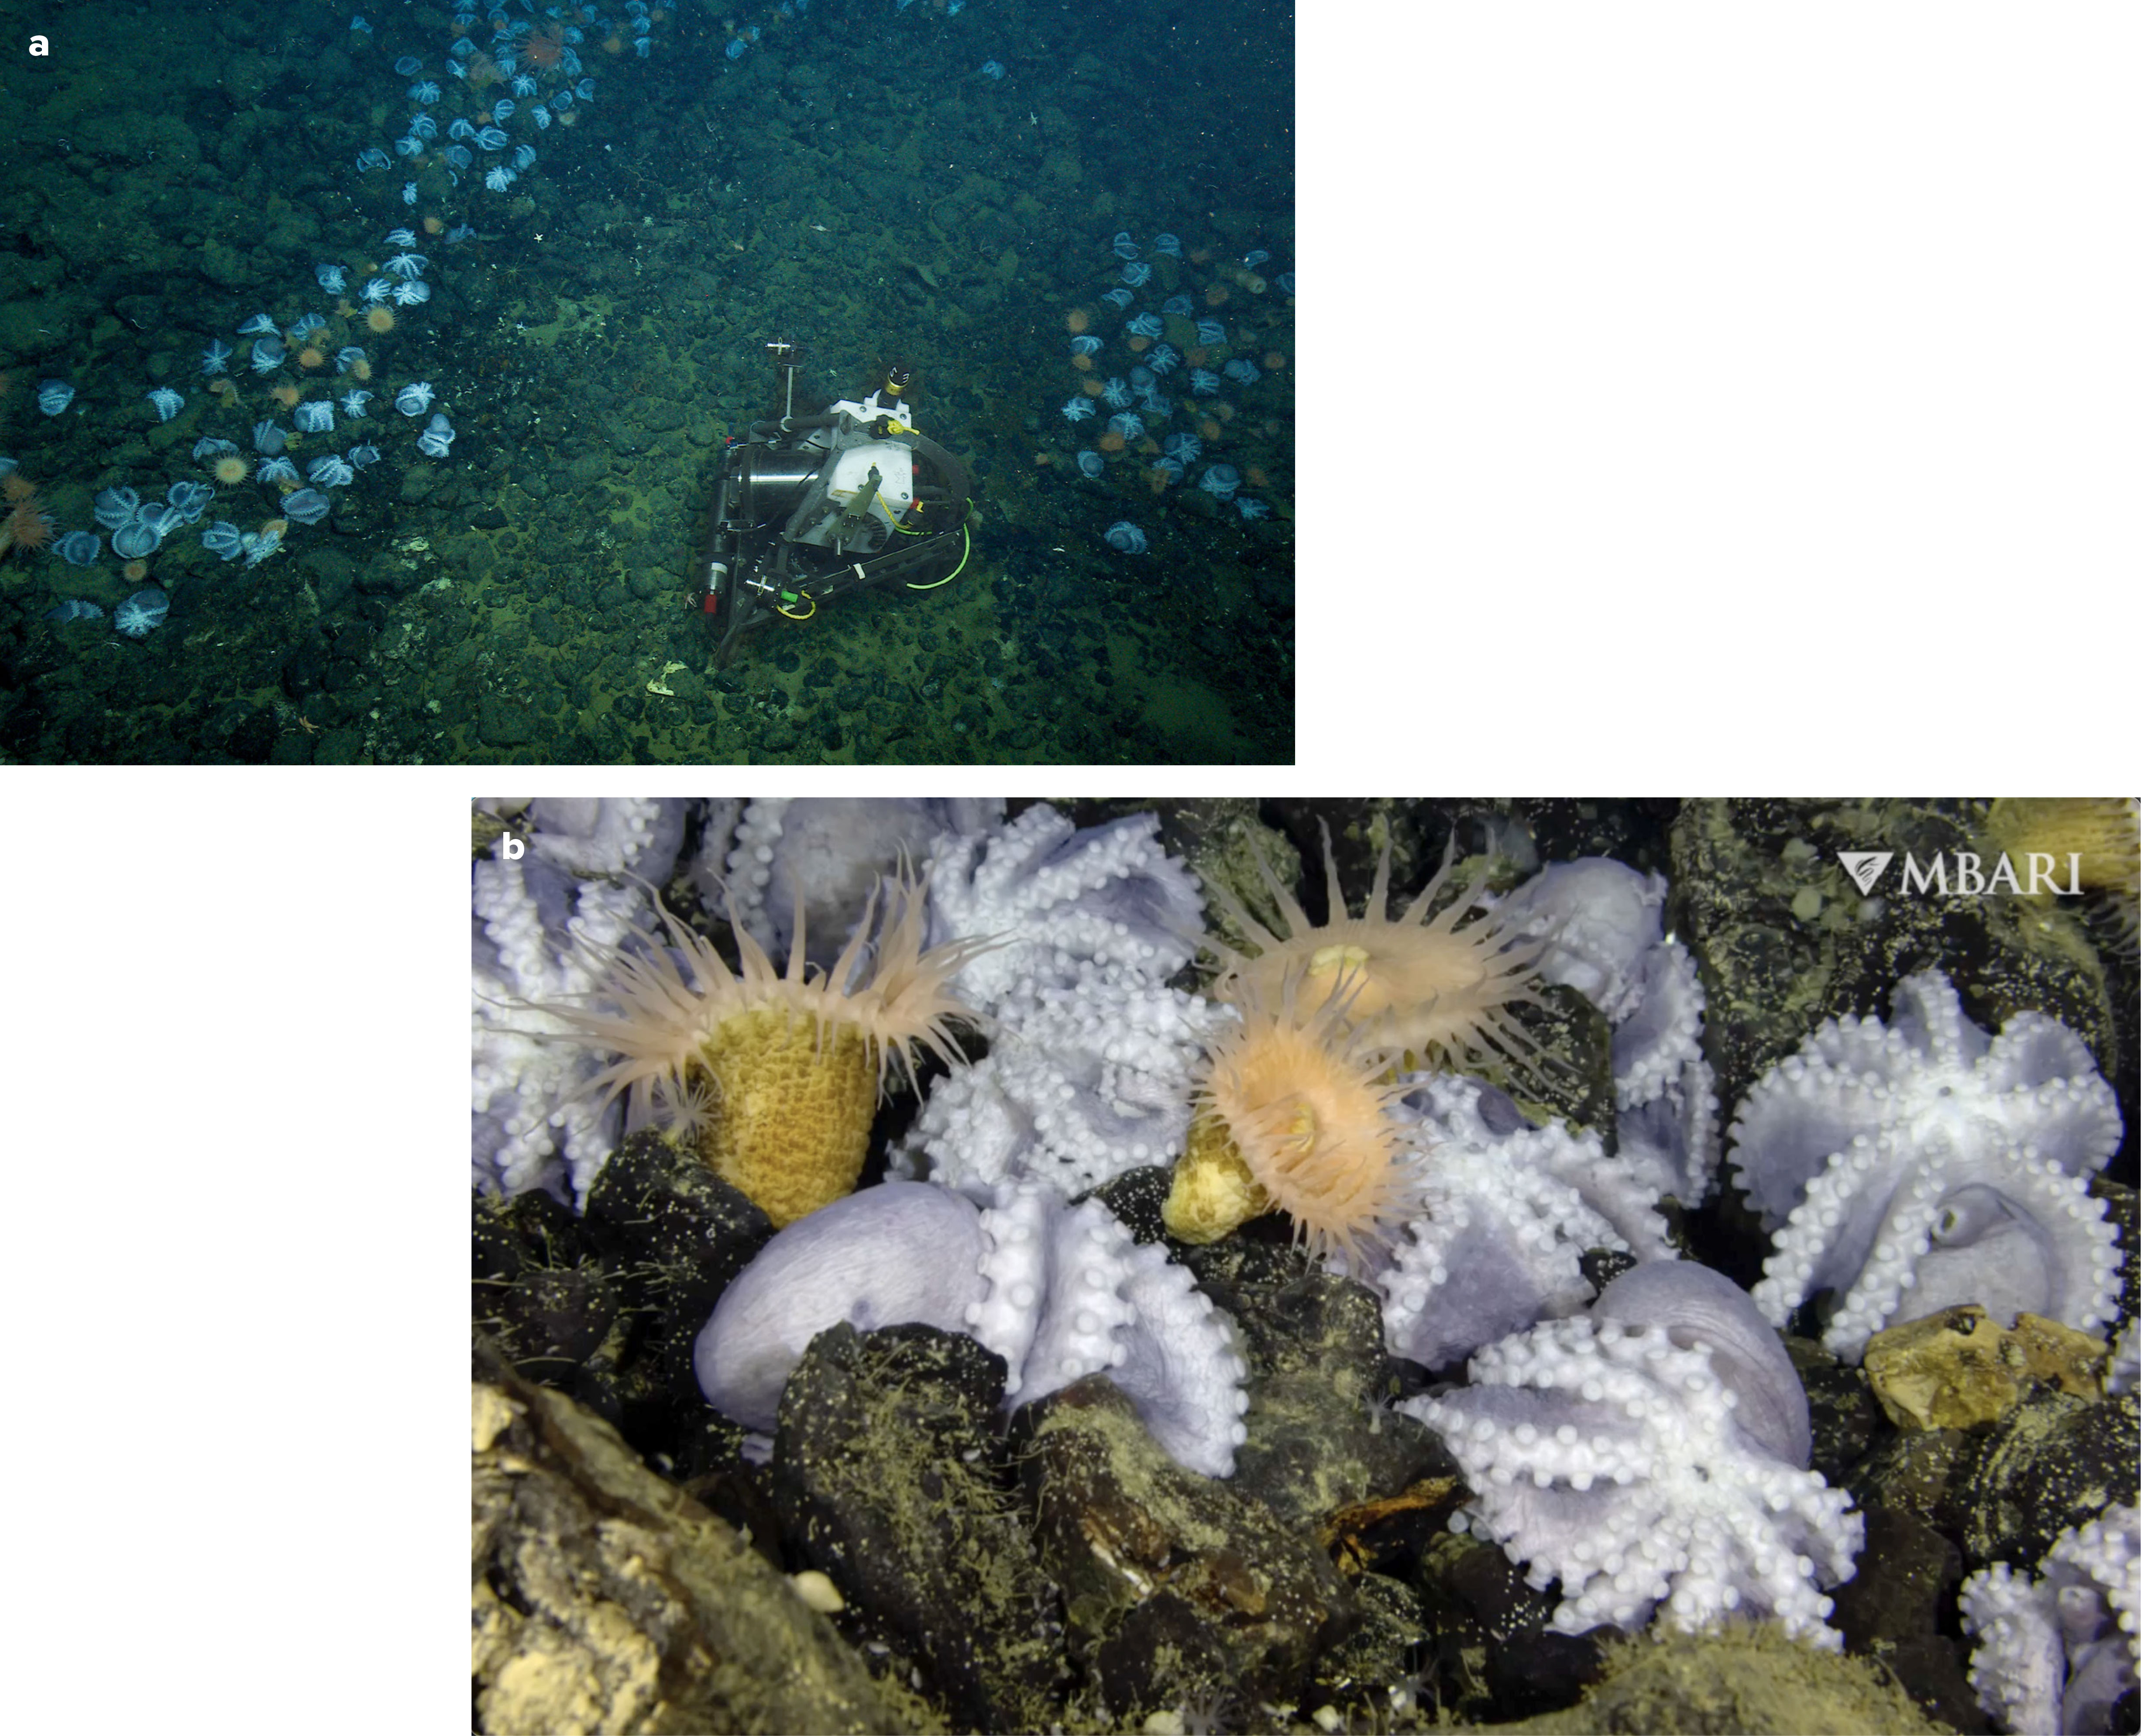
FIGURE 10. High-resolution mapping and imaging of the Octopus Garden (Figure 9) provided the basis for conducting targeted studies of the animals utilizing that habitat (Barry et al., 2023). In one instance, a time lapse camera was deployed from a ship on an ROV and then deposited precisely among benthic fauna where it operated autonomously (a). Still images from that vantage point were taken every 20 minutes from March 3, 2022, to August 29, 2022, revealing animals arriving, nesting, or dying post-breeding (b). The time lapse imagery provided a unique perspective on the dynamics of the community from scientific as well as educational and outreach purposes (Secrets of the Octopus Garden). Watch the video in the flipbook version of this article. Images © 2022 MBARI. > High res figure
|
Despite that progress, the vast majority of the seabed has never been mapped at scales needed to reveal underwater landscapes in detail. Satellite altimetry-derived maps provide ~5 km grid resolution estimates of seafloor depth for the entire ocean bottom using gravity anomalies (W.H.F. Smith and Sandwell, 1997), but those maps provide only a coarse perspective on what lies below, much like a person viewing a large terrestrial mountain range, deep valley, or vast plain from a great distance. High-resolution maps of the seafloor acquired using surface vessel-mounted multibeam sonar varies linearly with water column depth, typically on the order of 2 m at 100 m depth to 100 m at 5,000 m depth (Mayer, 2006), but even those maps currently cover only ~26% of the ocean bottom. Visualizing deep-sea biological communities requires much higher resolution, ideally centimeter or even millimeter scale, as shown in Figure 9. In other words, much of what lies below has never been seen by human eyes. Although the technology for doing so is available, actually accomplishing that goal globally is an enormous task and not likely to come to fruition anytime soon. Once again, robots offer a path forward for tackling that challenge because they can work when and where people cannot, dare not, or just prefer to avoid for many practical and logistical reasons.
A combination of crewed and uncrewed surface and subsurface vessels are now actively engaged in mapping the entirety of the seafloor as a contribution to the Seabed 2030 initiative. Seabed 2030 is a collaborative project sponsored by the Nippon Foundation and the General Bathymetric Chart of the Ocean (GEBCO) that aims to assemble all available bathymetric data into a single, freely accessible map for the benefit of all. Like the global fleet of profiling floats returning data on the vital signs of the world’s ocean, Seabed 2030 is a great example of what can be accomplished through public-private partnerships, international cooperation, and data sharing to grow our understanding of seafloor bathymetry. Given the task at hand and its relevance to society, it speaks to the age-old adage that “necessity is the mother of invention.” Developing new means for comprehensively mapping the seafloor is ripe for innovation, following in the footsteps of developing and deploying platforms and sensors for assessing ocean biogeochemistry on a global scale.
Conclusions
The history of technology development in the quest to explore and observe the ocean offers many enduring lessons. At least five takeaways are apparent:
- There is much to gain by working as an interdisciplinary team to tackle daunting challenges, even when those problems may require years or decades to overcome.
- Fostering an enduring peer relationship among scientists, engineers, and marine operations specialists in concert with the public fuels discovery.
- Being open-minded to what is possible even though it may seem improbable or counter to current thought begets innovation.
- “Failures” are inevitable if one attempts to do something that has not been done before; failures are stepping stones toward transformative engineering development and scientific advancements.
- Never underestimate the potential of serendipity, and be open-minded to changing course when an opportunity or new technology presents itself.
The foregoing consideration of how ocean technology has evolved in recent years and how it has impacted ocean science is a powerful endorsement of those lessons and a tribute to all who have walked that path.
Much of the technological revolution that has been brought to bear on ocean exploration and observation was primarily driven by a variety of achievements in industrial settings that often had nothing to do with marine science. Advancements in microelectronics, biopharma, aerospace, manufacturing, material and computer science, and other disciplines, as well as social media, have dramatically transformed our ability to access the sea, reveal its mysteries, and share the findings with a global audience. This cycle is accelerating. Every time we return to the ocean with new technologies in hand, we learn something new (e.g., Chisholm et al., 1988) and grow to appreciate the connection between societal well-being and the health of the sea.
Throughout history, we have approached ocean exploration and observation through a decidedly human sensory perspective. There is still much to learn. Ocean-dwelling animals perceive their environments in many ways we humans have not yet learned to interpret or fully comprehend; examples include their responses to electromagnetic fields and their use of chemosensory capabilities. Looking forward, it is likely that just as the use of biogeochemical, optical, acoustic, and omic sensing has revealed surprising insights about the interplay between marine chemistry, physics, biology, and geology, so too will new sensor systems give us a better appreciation of the lives of ocean animals. As Bruce Robison (MBARI, pers. comm., 2025) aptly put it:
To the inhabitants of the deep sea, their world must seem very different than it seems to us, because they are comprehending it with vastly different sensors than we have. The more we can perceive their world the way they do, the better we’ll understand it. Our inherent biases limit us.
Revelle and Suess’s “large scale geophysical experiment” is ongoing. We are in a race to learn more about the ocean and the seafloor, and the incredible diversity of life therein, as it undergoes increasingly rapid change due to human activities. A sustained commitment to technology development is integral to competing in that race. President J.F. Kennedy, who was a strong advocate for ocean exploration, marine conservation, and weather research, summed it up well at his 1961 commencement address at the US Naval Academy:
Knowledge of the oceans is more than a matter of curiosity. Our very survival may hinge upon it.
Acknowledgments
This work was supported by the Monterey Bay Aquarium Research Institute (MBARI) with funding from the David and Lucile Packard Foundation. The author acknowledges many contributions and informative discussions with his MBARI colleagues who helped to shape this article, in particular Kelly Benoit-Bird, Peter Brewer, James Barry, James Birch, Dave Caress, Francisco Chavez, Nancy Jacobsen-Stout, Ken Johnson, Eve and Lonny Lundsten, Raúl Nava, Bruce Robison, John Ryan, Rob Sherlock, Yui Takeshita, Susan von Thun, Giancarlo Troni, and Yanwu Zhang. With great appreciation, the author also thanks the Ocean Studies Board for extending the invitation to present this overview at the 26th Annual Roger Revelle Lecture and to the National Academies for hosting the event. Stacee Karras and Claudia Benitez-Nelson graciously and patiently provided invaluable assistance with preparing and improving this presentation and made significant contributions to developing the concepts on which it is based. The author also thanks Oceanography editor Ellen Kappel for her work to improve the final version of this manuscript ahead of its publication.
 > High res figure
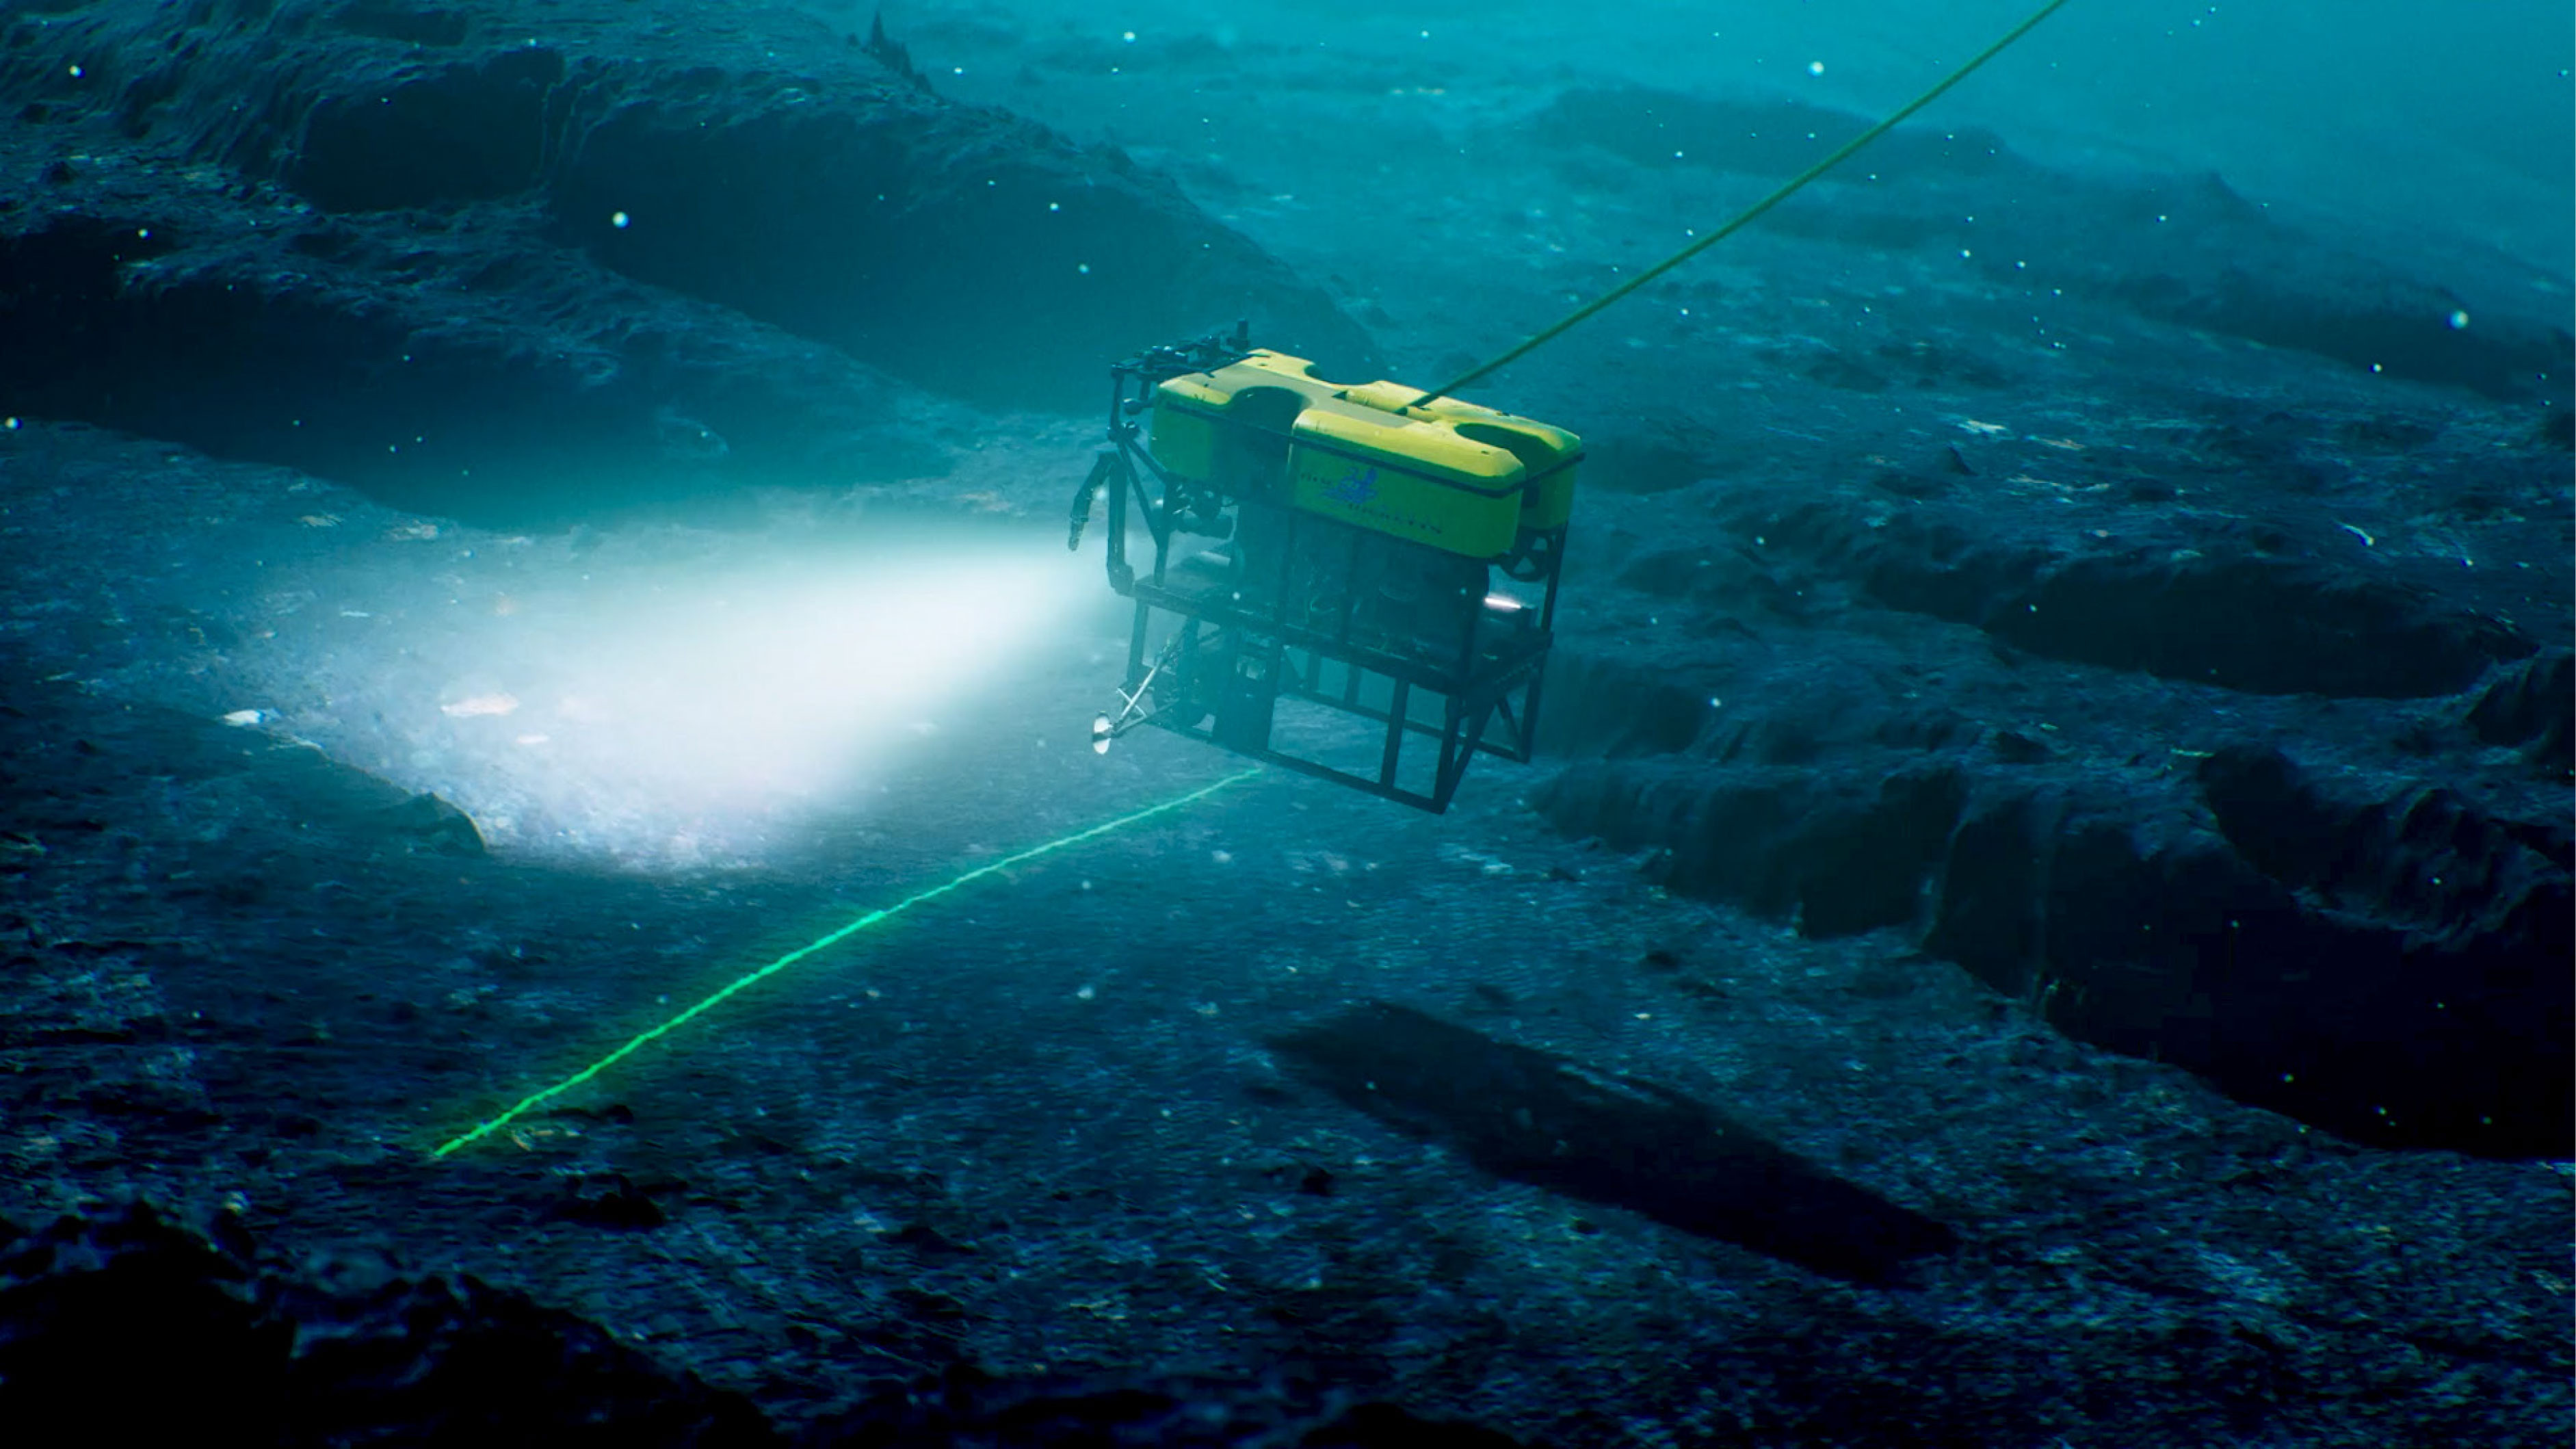
 > High res box