Introduction
Macronutrients, essential for fundamental life processes, have been traditionally categorized in marine sciences as primarily encompassing carbon, nitrogen, phosphorus, and silicon. However, micronutrients, such as iron, also play significant roles in marine ecosystems (Emerson and Hedges, 2008; Hutchins and Boyd, 2016). The regulation of nutrient concentrations in the ocean depends on the interplay of the geophysical and biogeochemical processes governing the introduction of these elements into seawater and their subsequent dispersion, advection, and removal (K.-K. Liu et al., 2000; J. Zhang et al., 2007; Chen, 2009; Umezawa et al., 2014; W. Wang et al., 2016).
When viewing the ocean as a system, the primary external sources of most nutrients can be attributed to rock weathering, organic matter decomposition, and land-based waste discharge. However, on an annual global scale, the recycling and internal transport of nutrients within the ocean provide the vast majority of the nutrients required to sustain primary production, greatly exceeding the contributions from terrestrial sources such as rivers and atmospheric deposition (Schlesinger and Bernhardt, 2020). This can be exemplified by considering the East China Sea (ECS), one of the most productive marine regions globally (K.-K. Liu et al., 2010; J. Zhang et al., 2019). It has been reported that the supply of phosphorus from the subsurface waters of the Kuroshio, a powerful western boundary current, outweighs the contributions from all rivers, including the mighty Changjiang River (Yangtze River; C.T.A. Chen, 1996; Zhao and Guo, 2011). Similarly, in another western boundary current system, upwelling driven by the Loop Current serves as the primary source of nutrients for the South Atlantic Bight and the West Florida Shelf in the Gulf of Mexico (Ishizaka, 1990; Lee et al., 1991; Y. Liu et al., 2016; Weisberg and Liu, 2025).
Phytoplankton play a central role in the biological removal of inorganic macronutrients, namely nitrogen, phosphorus, and silicon, from seawater. While coastal and benthic algae also contribute to nutrient removal, their impact is relatively minor (Cloern, 2001). This biological removal primarily occurs within the euphotic layer, which tends to be thin on continental shelves due to high turbidity caused by terrestrial particle inputs (He et al., 2013, 2014). The marine food web, which includes zooplankton, bacteria, and higher consumers, recycles nitrogen, phosphorus, and silicon by breaking down organic matter and releasing these nutrients as dissolved inorganic forms, thereby sustaining primary production and completing the oceanic nutrient cycle. In addition to macronutrients, the growth and metabolic functioning of phytoplankton also depend on a suite of trace elements known as micronutrients. Micronutrients such as iron, nickel, copper, and zinc are essential cofactors in phytoplankton metabolic processes, including photosynthesis and nitrogen fixation, despite their trace concentrations in seawater (Morel and Price, 2003). In the Kuroshio region, these trace metals originate predominantly from anthropogenic aerosol deposition, sediment resuspension on the ECS shelf, and terrestrial inputs via riverine discharge, with additional contributions from intermediate waters and lateral transport from marginal seas (W.H. Liao and Ho, 2018; Takano et al., 2022; Hsieh and Ho, 2024).
The ECS has been a focal point of numerous studies investigating biological productivity, particularly in relation to nutrient availability. Five external sources of nutrients have been identified for the ECS: Kuroshio Current, Taiwan Strait, river inputs, submarine groundwater discharge, and atmospheric deposition (C.T.A. Chen and Wang, 1999; Gong et al., 2003; S.L. Wang et al., 2018; J. Zhang et al., 2019). The Changjiang River, especially during the summer, significantly contributes to nutrient inputs in its estuary (Sun et al., 2023). Nevertheless, it is widely accepted that the primary source of nutrients for the ECS is the subsurface waters of the Kuroshio (C.T.A. Chen, 2008; Liu et al., 2010; X. Guo et al., 2012; Umezawa et al., 2014). Various processes, including upwelling, Kuroshio frontal eddies, and filaments extending onto the shelf, result in supply of nutrients to continental shelf waters (Li et al., 2016; Meng et al., 2020; Su and Pan, 1987; Yuan et al., 2015; Zheng and Zhai, 2021; Zhou et al., 2015; Jiang et al., 2023).
The Kuroshio is characterized by its oligotrophic nature in the euphotic zone but nutrient-rich characteristics in subsurface layers. Furthermore, due to the weakening of the Kuroshio Current with depth, the nutrient flux exhibits a subsurface maximum, referred to as the “nutrient stream” (Pelegri and Csanady, 1991; C.T.A. Chen et al., 1995; X. Guo et al., 2012). Kuroshio Intermediate Water (KIW), originating from North Pacific Intermediate Water (NPIW), is the primary contributor to the Kuroshio nutrient stream and has been identified as the major source of nutrients for the ECS continental shelf (C.T.A. Chen and Huang, 1996; Nagai et al., 2019; S.M. Liu et al., 2020; C.T.A. Chen et al., 2021; Long et al., 2022).
To shed light on this intricate nutrient flow, we track macronutrients along their journey from the source of the Kuroshio east of the Philippines and onto the ECS continental shelf, after receiving contributions from the South China Sea (SCS). This research aims to enhance our understanding of the origin and transformation of nutrient-rich water masses that sustain the vibrant primary productivity of the ECS.
Study Area and Methods
In this study, we analyzed data sourced from various locations proximal to the Kuroshio Current, within and adjacent to the ECS (Figure 1). Our data originated from multiple research cruises, arrayed from south to north as follows: east of Philippines (INDOPAC leg II, May 1976), southeast of Taiwan (ORI-462, September 1996), southeastern ECS (ORI-179, September 1988), eastern ECS (TPS-24, June 1985), and northeastern ECS (KEEP-MASS, July 1992).
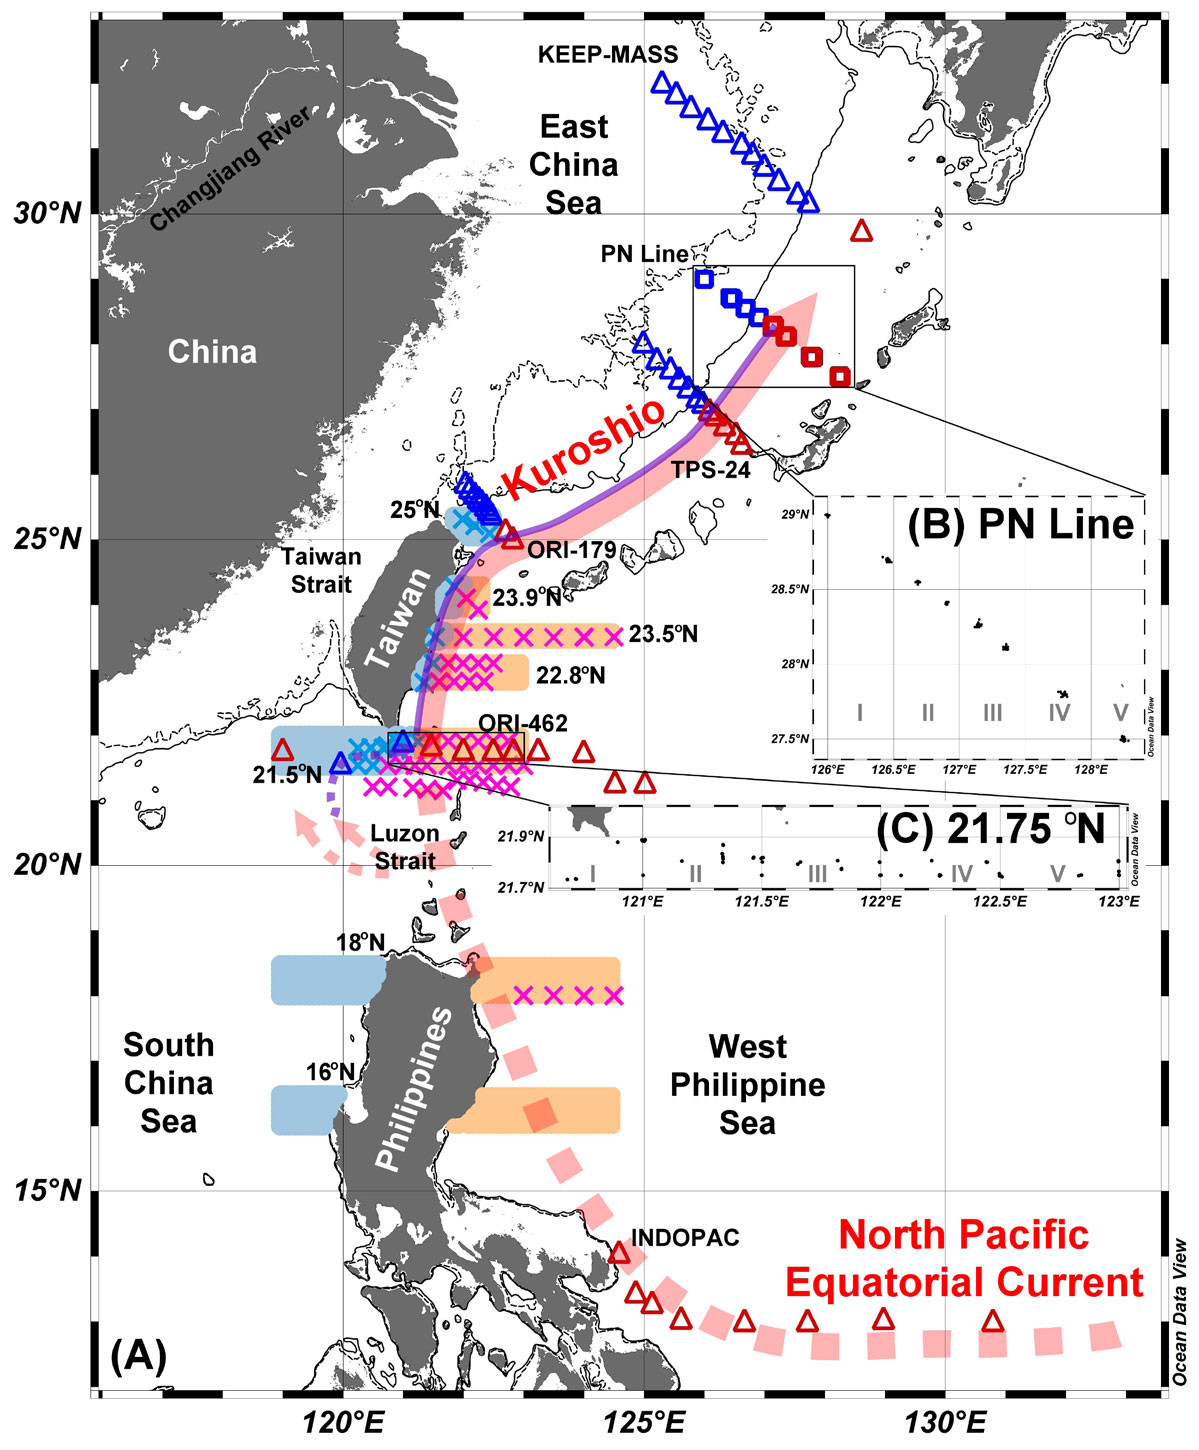
FIGURE 1. (A) The map shows the main pathways of the Kuroshio Current and its branches, indicated by colored arrows. Different symbols represent various sampling stations and research lines: KEEP-MASS, TPS-24, ORI-179, ORI-462, and INDOPAC (triangles); CTD data collected in September 2000 (crosses). Shaded areas indicate HYCOM model data from September 2000. Red, orange, and purple indicate regions mostly influenced by the West Philippine Sea (WPS), while blue denotes areas mainly influenced by the South China Sea (SCS). (B,C) Repeated sampling tracks at the PN Line and 21.75°N, respectively. The different area numbers correspond to Table S1. > High res figure
|
These cruises were selected to offer a comprehensive perspective on the Kuroshio Current’s dynamics across different locales and temporal stages, particularly before and after the current veers eastward to exit the ECS. Most of the data from these cruises are publicly accessible, having been previously published or available through datasets. Each cruise recorded measurements of nutrients and dissolved oxygen (DO)—parameters influenced by biological activity as well as by temperature and salinity fluctuations.
Apparent oxygen utilization (AOU) is calculated by subtracting the measured DO from its saturation value at the in situ temperature and salinity (AOU = [O2]theoretically saturated – [O2]measured; C.T.A. Chen, 1981). AOU serves as a crucial indicator of the net production or consumption of DO. Unlike DO, AOU is unaffected by temperature and salinity variations, making it a more robust indicator of biological respiration and oxygen consumption in seawater.
Further, the PN line data from 2000 to 2020 were selected for this study, with long-term observations conducted semi-annually to quarterly during this period by the Japan Meteorological Agency. Additional longitudinal data were obtained from a repeated-measurement study southeast of Taiwan along 21.75°N, with sampling conducted in November 1990, June 1991, May 1994, May 1995, October 1995, September 1996, July 2004, May 2006, June 2011, and August 2015.
Collection of these shipboard data, although covering a large area, occurred in different years. For data synthesis across similar sampling periods, hydrographic data from the same study areas were collated during September and October 2000. Shipboard CTD data extending from the northeastern coast of the Philippines to northeastern Taiwan were sourced from the Ocean Data Bank. Concurrently, model temperature and salinity data for September 2000 were obtained from the HYbrid Coordinate Ocean Model (HYCOM). To estimate nutrient concentrations, empirical formulas derived from repeated measurements along 21.45°N during 10 cruises were applied, utilizing temperature data in conjunction with the specific water mass characteristics of SCS-like (South China Sea-like) and WPS-like (West Philippine Sea-like) waters (Figure S1 in the online supplementary materials). This categorization is based on whether the maximum salinity (S-max) is lower or greater than 34.75, which approximates the median of the S-max values for typical WPS (S ≈ 34.94) and typical SCS (S ≈ 34.53) around σθ = 24.5–25 (Figure S2A).
Results
Hydrographic Features East of Luzon Island
Figure 2 focuses on the origin of the Kuroshio Current, where the North Pacific Equatorial Current (NPEC) encounters the NPIW near the Philippines. The cross-sectional (14°N, INDOPAC) parameters encompass temperature (T), salinity (S), AOU, nitrate (NO3), phosphate (PO4), and silicate (Si(OH)4). While temperature shows a decreasing trend with depth, AOU, nitrate, phosphate, and silicate all exhibit an increasing trend with depth (Figure 2). The primary thermocline is observed at depths ranging from 200 m to 500 m, coinciding with the nutricline. Salinity, on the other hand, behaves differently, increasing initially with depth until reaching a maximum at around 200 m, referred to as Kuroshio Tropical Water (KTW). Below this point, salinity decreases with depth until it reaches a minimum, namely the KIW at approximately 400 m, and then increases again (Tsuchiya, 1968; Qu et al., 2000).
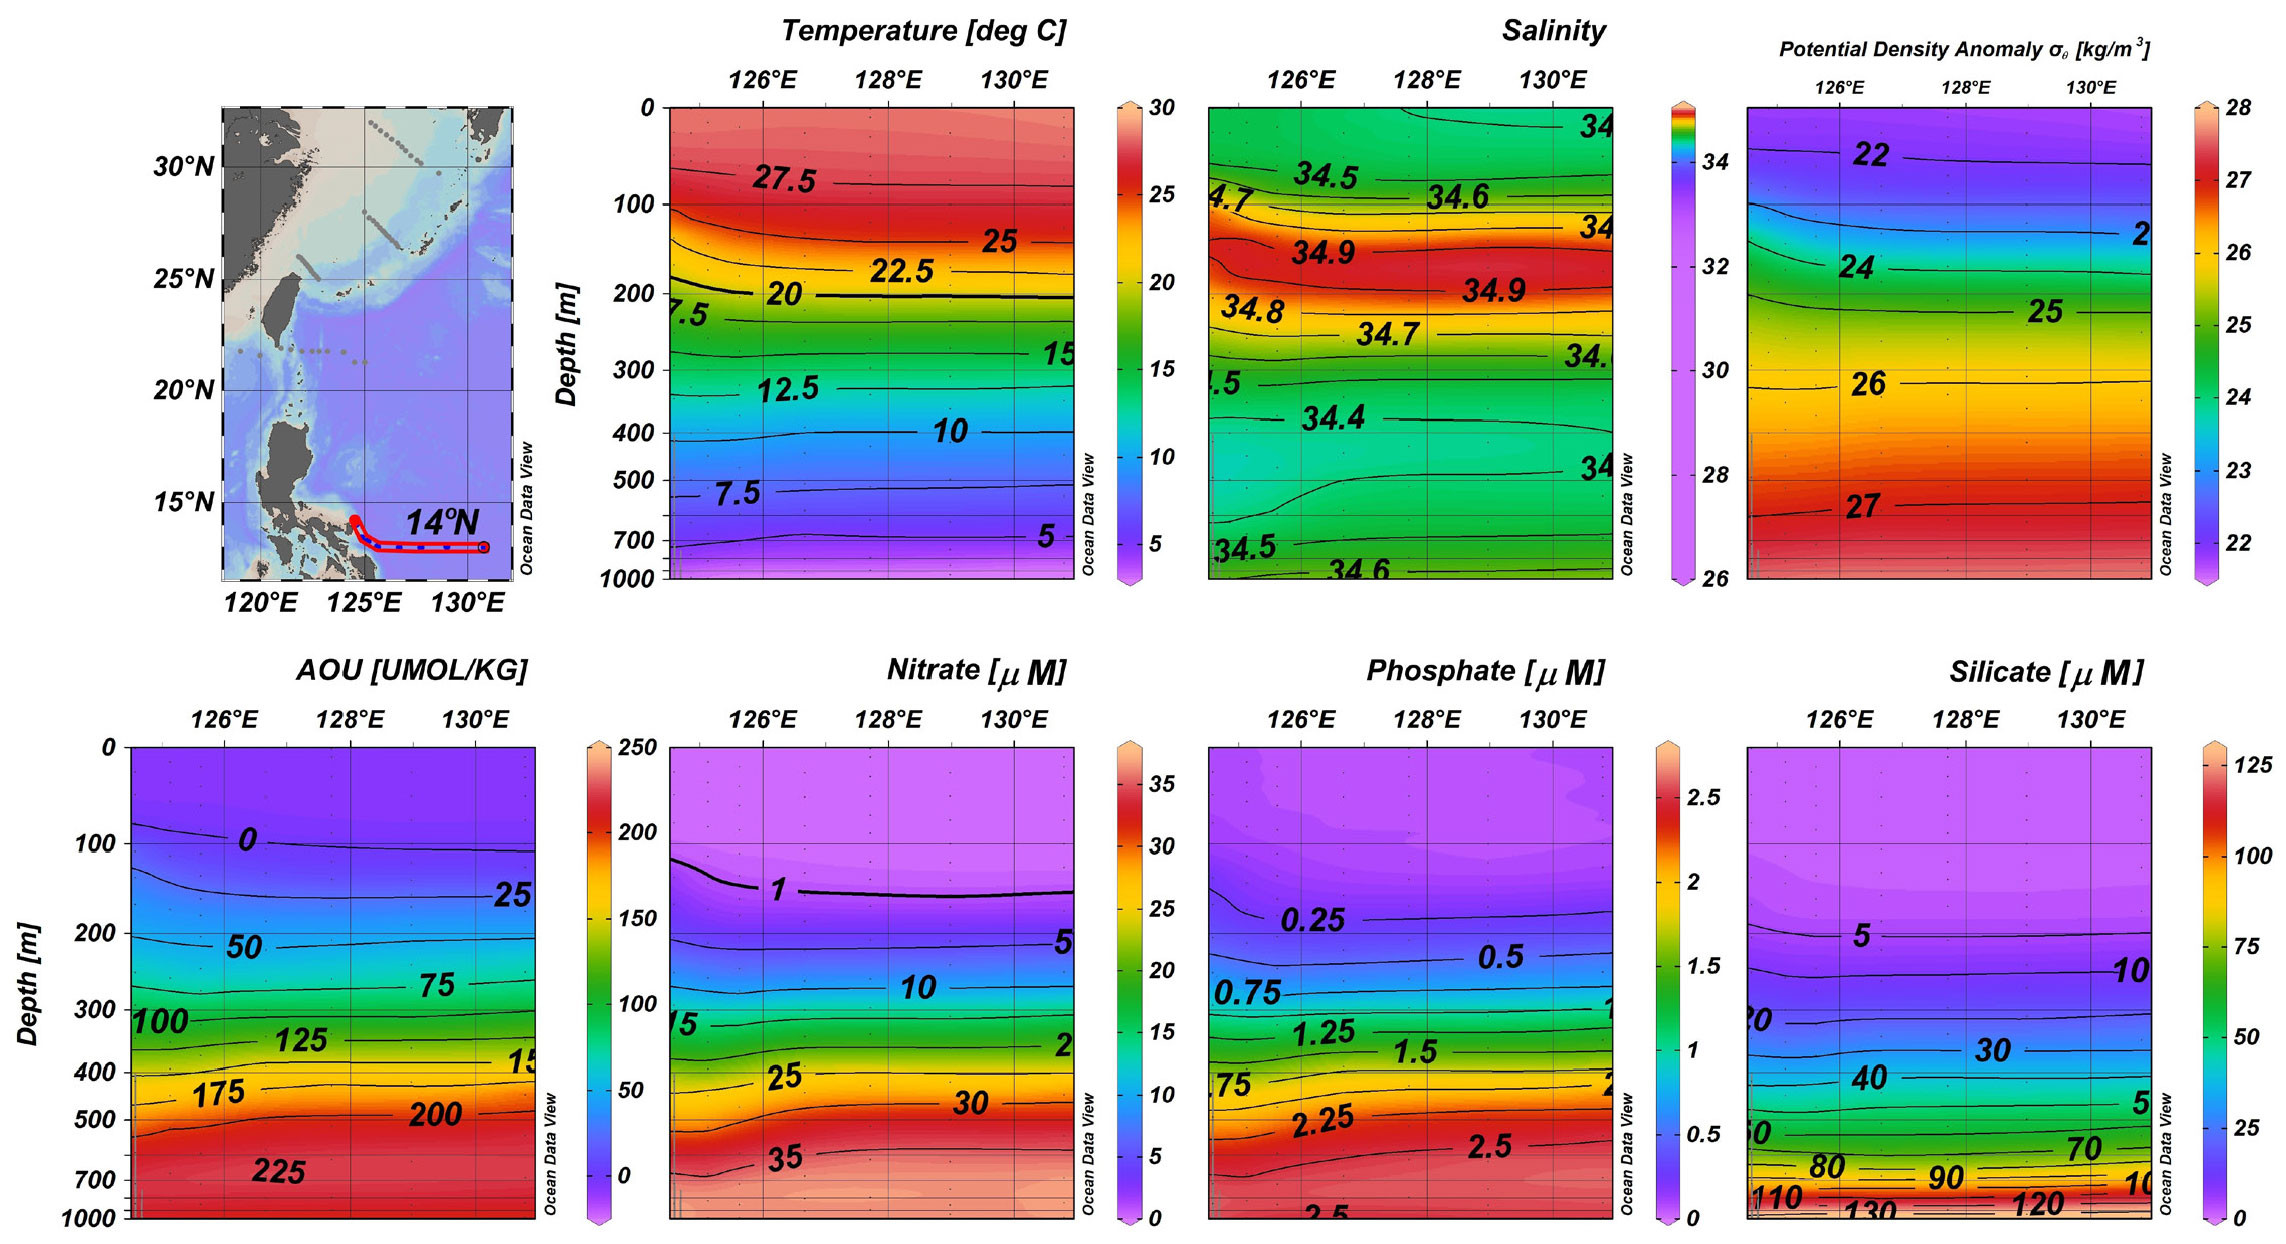
FIGURE 2. Zonal cross sections of temperature, salinity, potential density anomaly (σθ), apparent oxygen utilization (AOU), nitrate, phosphate, and silicate east of the Philippines based on INDOPAC, Leg II, data. Color shading and black contours represent the values of individual parameters. > High res figure
|
For the profile made east of Luzon Island (Figure 2), an essential observation is that parameter contours remain relatively flat below 400 m east of 126°E within the NPIW domain. However, above 400 m and west of 126°E, the contours tilt upward by as much as 100 m. For example, the 1 µM contour for NO3 is around 160 m deep east of 126°E (Figure 2), where it is too deep for phytoplankton to utilize sunlight for photosynthesis. Near the Philippine coast, this contour reaches depths of about 100 m, closer to the euphotic zone, where some light penetration can support biological production. This phenomenon is primarily driven by the force of the pressure gradient and the Coriolis effect (Qu et al., 1998; Schaeffer et al., 2013; F. Liao et al., 2022). It is noteworthy that AOU is negative above 100 m, reflecting net primary productivity in the euphotic zone. The AOU reaches 25–50 µmol kg–1 at the depth where the nitrate concentration is approximately 1 µM. This suggests that significant organic matter decomposition, a process that consumes oxygen, occurs at a depth of around 160 m east of 126°E (Figure 2).
Temperature, salinity, and AOU contours all show an upward trend near the Philippine coast (west of 126°E, Figure 2), accompanied by a shoaling of nutriclines, including nitrate, phosphate, and silicate, toward the coast. This increase in nutrients is not associated with SCS waters, as little SCS water is present in the study area east of the Philippines (Lien et al., 2015).
Upwelling and Nutrient Dynamics Southeast of Taiwan
The situation changes significantly off southeast Taiwan. In the NPIW domain (east of 126°E in Figure 2), contours remain relatively flat below 400 m. However, to the southeast of Taiwan (Figure 3, 21.75°N), waters shallower than 600 m start to tilt up toward the west. The southern tip of a ridge that lies between the Philippines and Taiwan is located at approximately 121°E, with the SCS to its west and the WPS to its east. The temperature, AOU, and nutrient contours all indicate a westward upwelling feature that occurs most prominently west of 121°E (Figure 3). This upwelling is so intense that the 1 µM nitrate contour, which was previously at a depth of 100 m west of 126°E (Figure 2), emerges at a depth of 50 m at 121°E (Figure 3). This phenomenon, including the influence of the SCS water, is beyond the scope of this study but undoubtedly results in higher nutrient concentrations compared to the Kuroshio (K.-C. Yang et al., 2015).
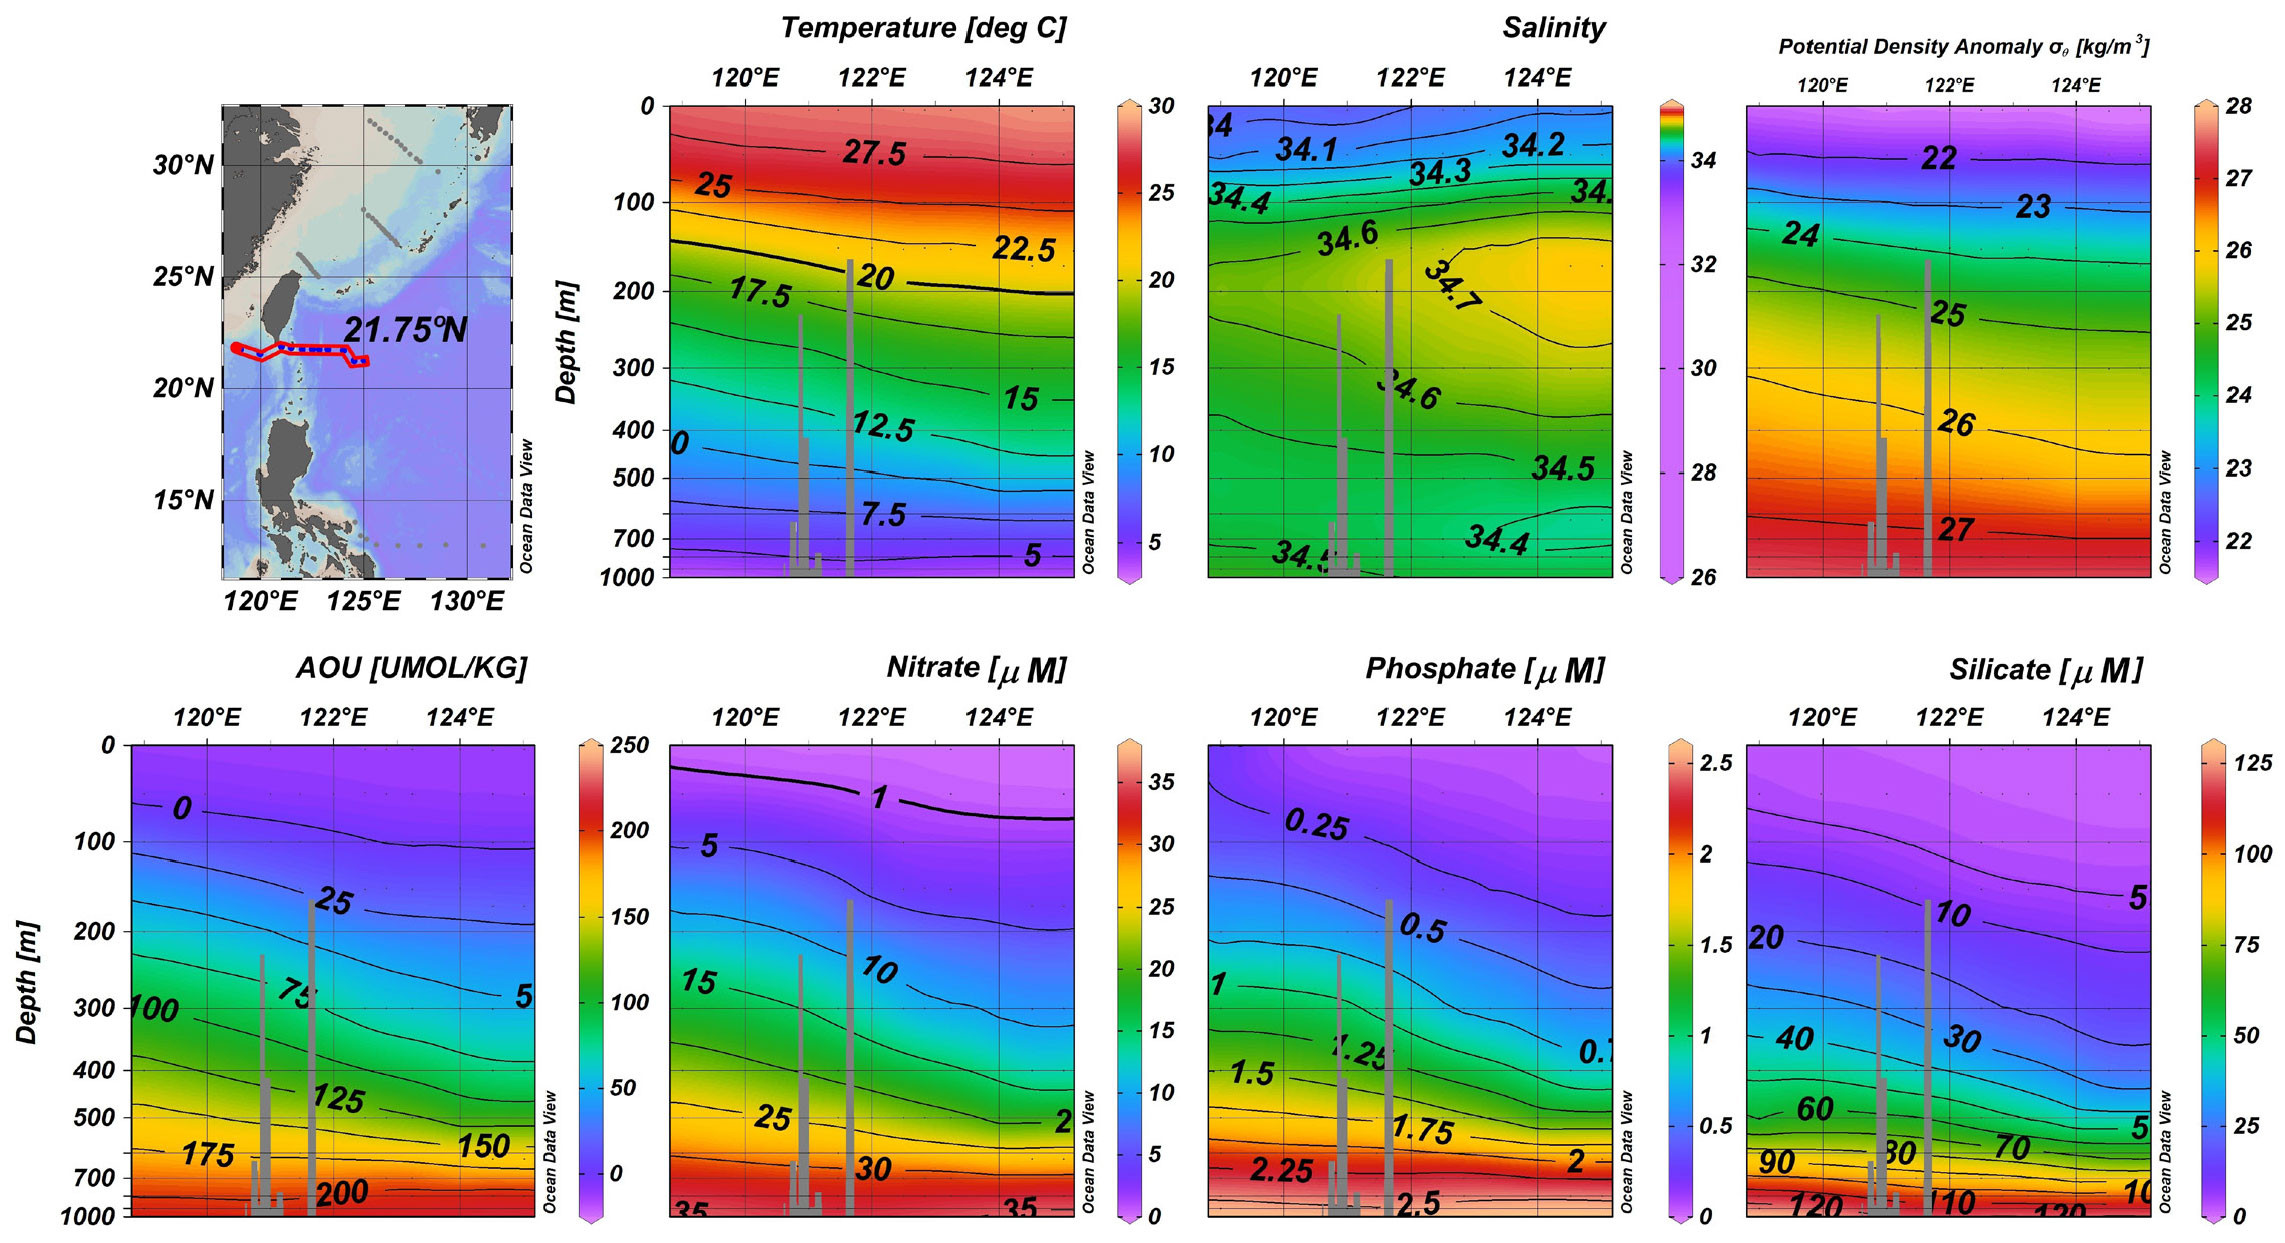
FIGURE 3. Zonal cross sections of temperature, salinity, σθ, AOU, nitrate, phosphate, and silicate southeast of Taiwan based on the ORI-462 data. Color shading and black contours represent the values of individual parameters. > High res figure
|
It is important to note that Kuroshio waters are significantly modified by water exchange involving SCS water in the LS (C.T.A. Chen and Huang, 1996; Matsuno et al., 2009; Yuan et al., 2014; Nakamura, 2020). Figures 2 and 3 illustrate that in the Kuroshio and the WPS regions, the S-max reaches values near 35. However, along 21.45°N latitude, waters with a salinity of 34.8 do not appear to penetrate the SCS west of 121°E. Extensive upwelling and vertical mixing in the SCS weaken the salinity maximum, and decrease temperature, but elevate nutrient concentrations in the subsurface layer (Figure S3; Chao et al., 1996; Lu et al., 2020). These characteristics gradually attenuate along the Kuroshio’s northward path.
In September 2000, CTD salinity cross sections from stations northeast of Luzon Island to the northern LS indicate that the S-max is around 34.8 east of 120.7°E (Figure S4A–C). This observation is consistent with the climatological salinity distribution in the LS. In the sigma-theta range of 24.6 to 24.9 (corresponding to a water depth of approximately 150–250 m), waters with S = 34.8 are found east of 120.5°E in the northern LS (Y. Chen et al., 2016). In other words, the S-max is reduced due to mixing with lower S-max SCS seawater west of 120.7°E (Figure S4D). The S-max in the Kuroshio east of Taiwan decreases from >34.8 offshore to ~34.6 as it nears the coast (Figure S4E–G; Mensah et al., 2014).
Kuroshio Influence North of Taiwan
By the time the Kuroshio, now influenced by the SCS, reaches the region north of Taiwan, the S-max has a salinity of around 34.8 in the ORI-179 cross section east of 122.8°E (Figure 4, 25°N). This cross section is perpendicular to the shelf break, which runs from southwest to northeast. As a result, the Kuroshio is forced to turn northeastward due to the topography (C.T.A. Chen, 2011). Temperature, salinity, AOU, and nutrient contours indicate the presence of high-nutrient waters (NO3 > 5 µM, PO4 > 0.2 µM, and Si(OH)4 > 5 µM) along the shelf edge at depths as shallow as 60 m. These subsurface nutrient-rich waters continue moving toward the ECS shelf, making them available for photosynthesis. Current-meter measurements and models confirm this onshore movement of surface waters (Chuang and Liang, 1994; Matsuno et al., 2009; D. Yang et al., 2011; Wu et al., 2017).
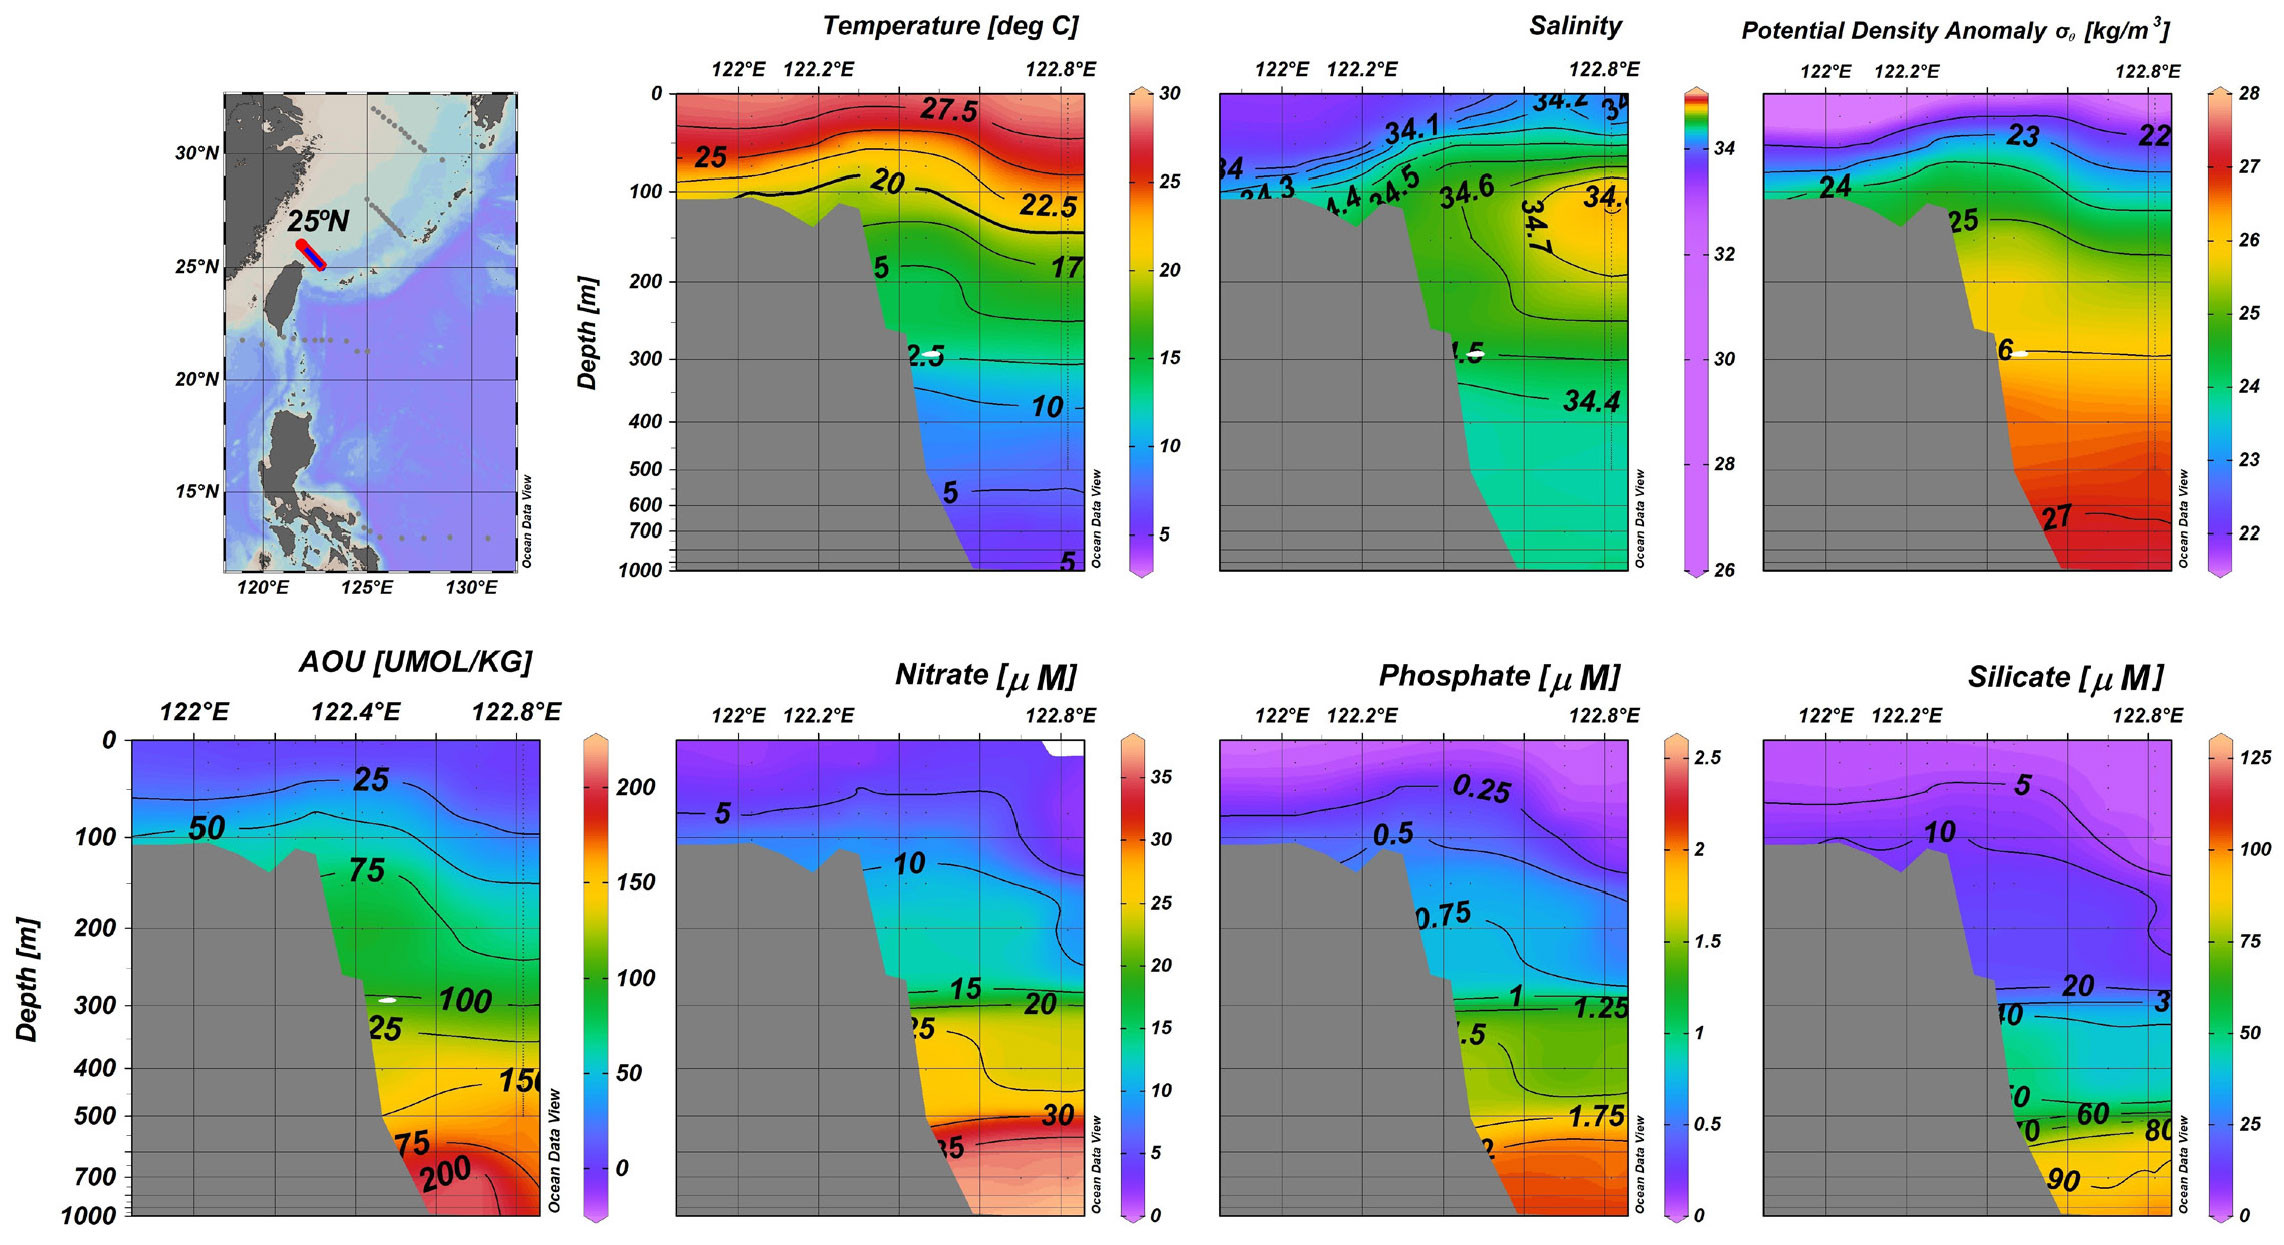
FIGURE 4. Zonal cross sections of temperature, salinity, σθ, AOU, nitrate, phosphate, and silicate northeast of Taiwan based on the ORI-179 data. Color shading and black contours represent the values of individual parameters. > High res figure
|
Nutrient Enrichment in the Middle Latitude East China Sea
Further north, in the TPS-24 cross section (Figure 5, 29°N), the S-max core exhibits a salinity exceeding 34.8 between depths of 100 m and 200 m in regions with water depths greater than 1,000 m, indicating a significant contribution from the original Kuroshio. However, the salinity quickly drops to 34.6 west of 126°E at depths of 100–200 m, where a salinity front appears to exist (C.T.A. Chen, 2005). West of this front, the influence of the SCS water is evident, with high-nutrient subsurface waters moving further westward toward the shelf break. For instance, the NO3 = 15 µM contour is approximately 100 m shallower (Figure 5) compared to the area northeast of Taiwan (Figure 4). The PO4 = 1 µM and Si(OH)4 = 20 µM contours also move up by about 100 m.
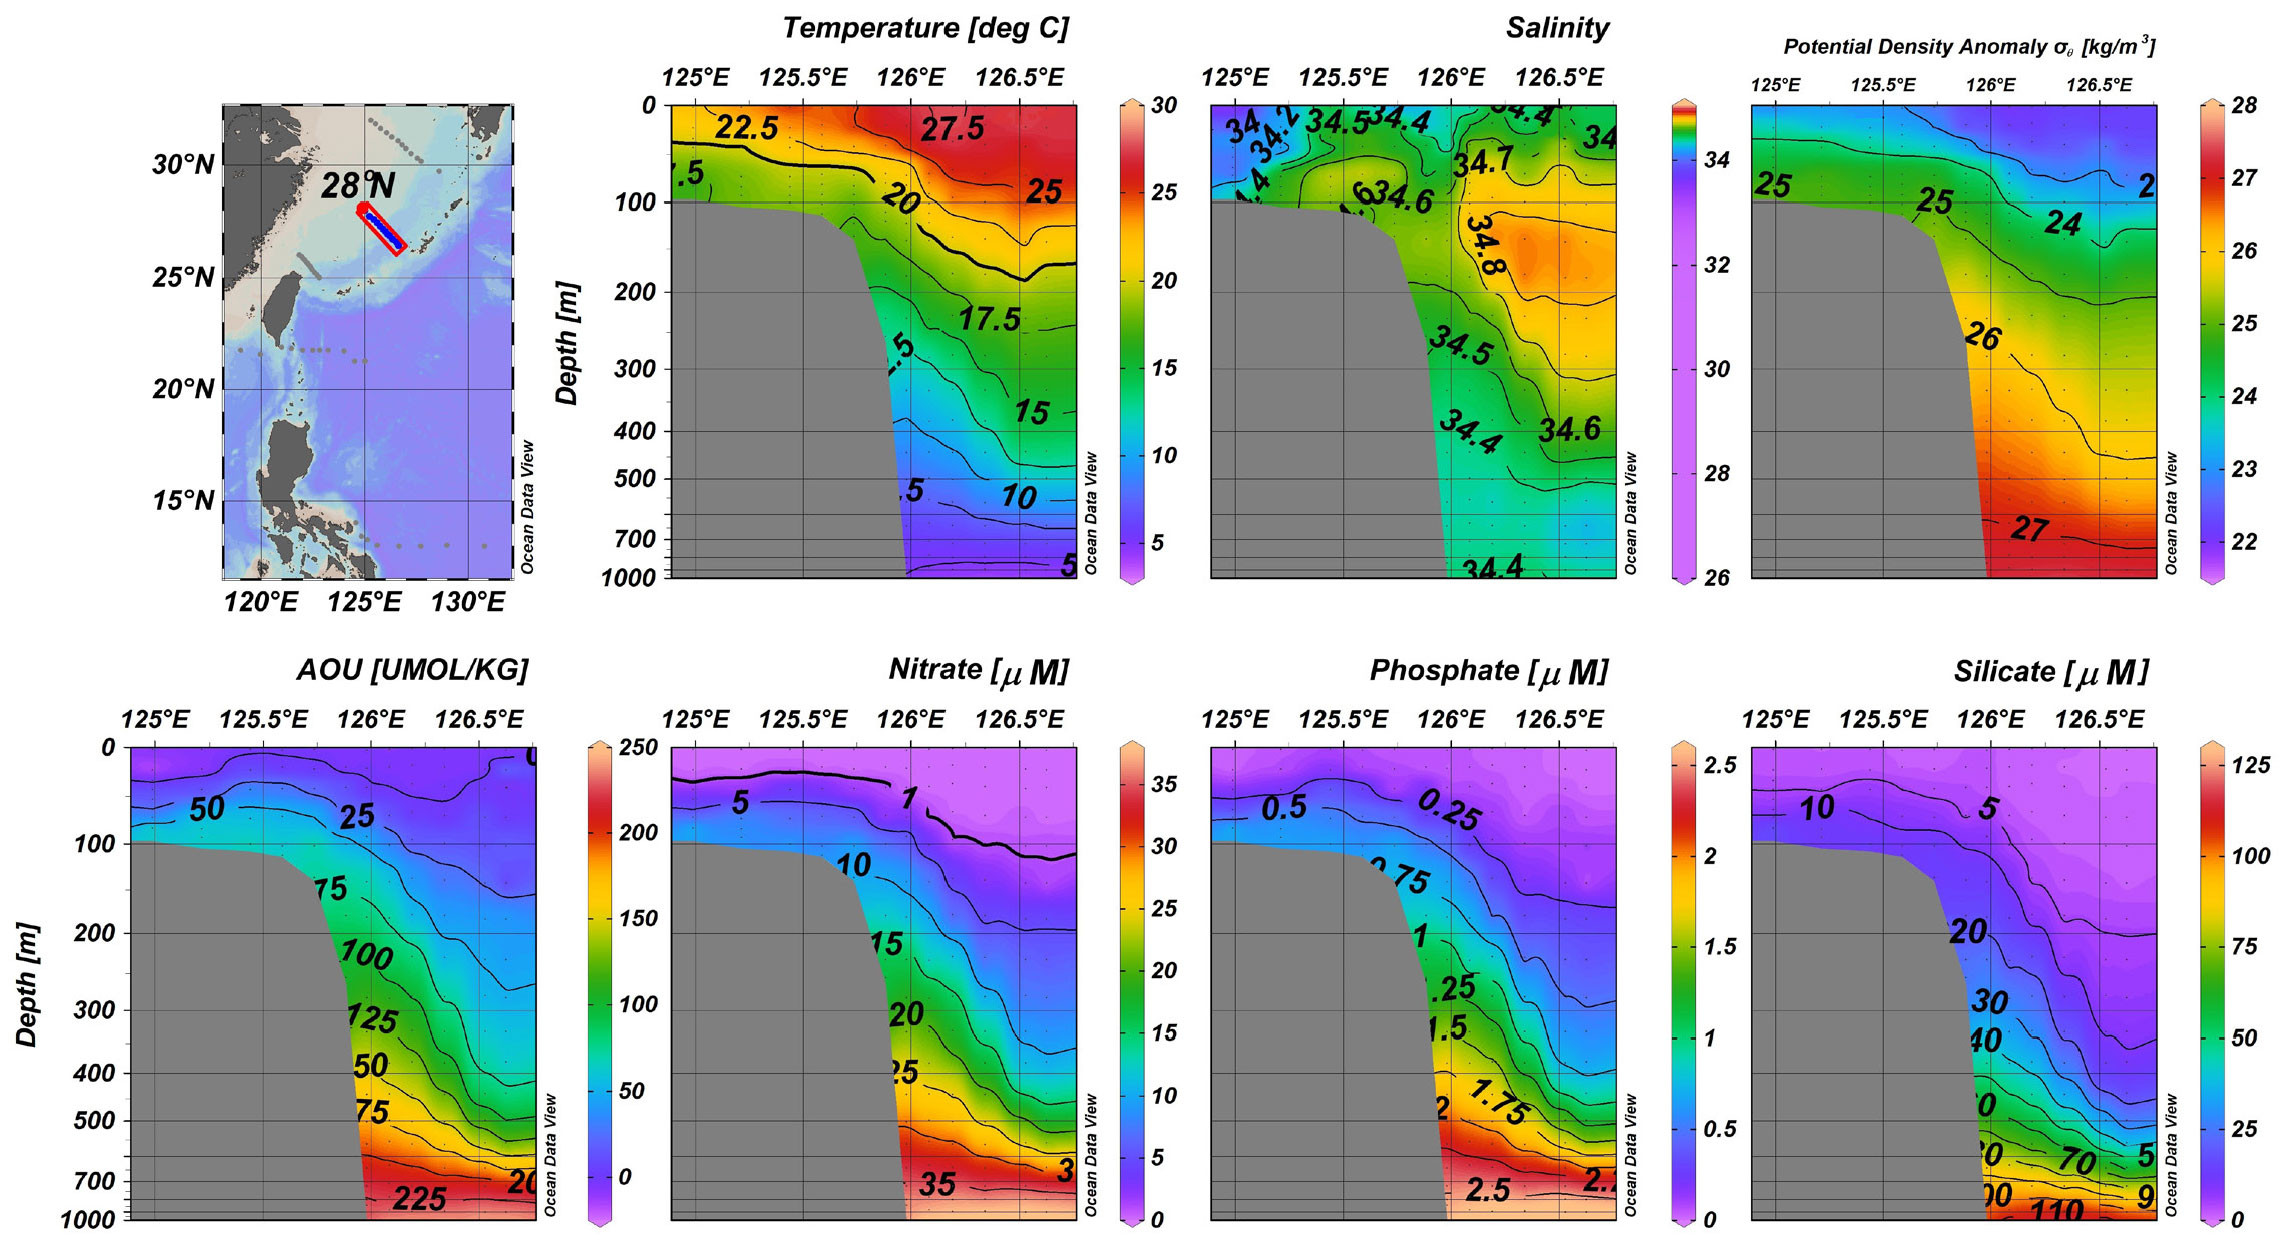
FIGURE 5. Zonal cross sections of temperature, salinity, σθ, AOU, nitrate, phosphate, and silicate east of the ECS based on the TPS-24 data. Color shading and black contours represent the values of individual parameters. > High res figure
|
Nutrient Dynamics in the Northern East China Sea Shelf Break
Moving further north, the KEEP-MASS data reach a water depth of approximately 80 m to the west (Figure 6, 32°N). While a lack of data near the shelf break makes it challenging to demonstrate the upwelling feature, the salinity, consistently lower than 34.6, suggests that the upwelled waters are significantly influenced by the SCS outflow or the ECS shelf waters. Notably, this region exhibits much higher nutrient concentrations, even in the surface layer, compared to the surface waters at the Kuroshio’s origin (Figure 2). While the Changjiang River outflow may play a role, it is likely minimal in supporting productivity given its low phosphate concentration. Factors such as winter cooling, typhoons, and strong winds could mix high-nutrient subsurface waters into the surface euphotic layer on the shallow shelf. It is worth mentioning that this area is some distance from the Kuroshio recirculation that contributes to nutrient supply in the entire Kuroshio region south of Japan (X. Guo et al., 2019). Therefore, the higher nutrient concentrations in this cross section likely originate from the SCS-influenced Kuroshio coming from the southwest.
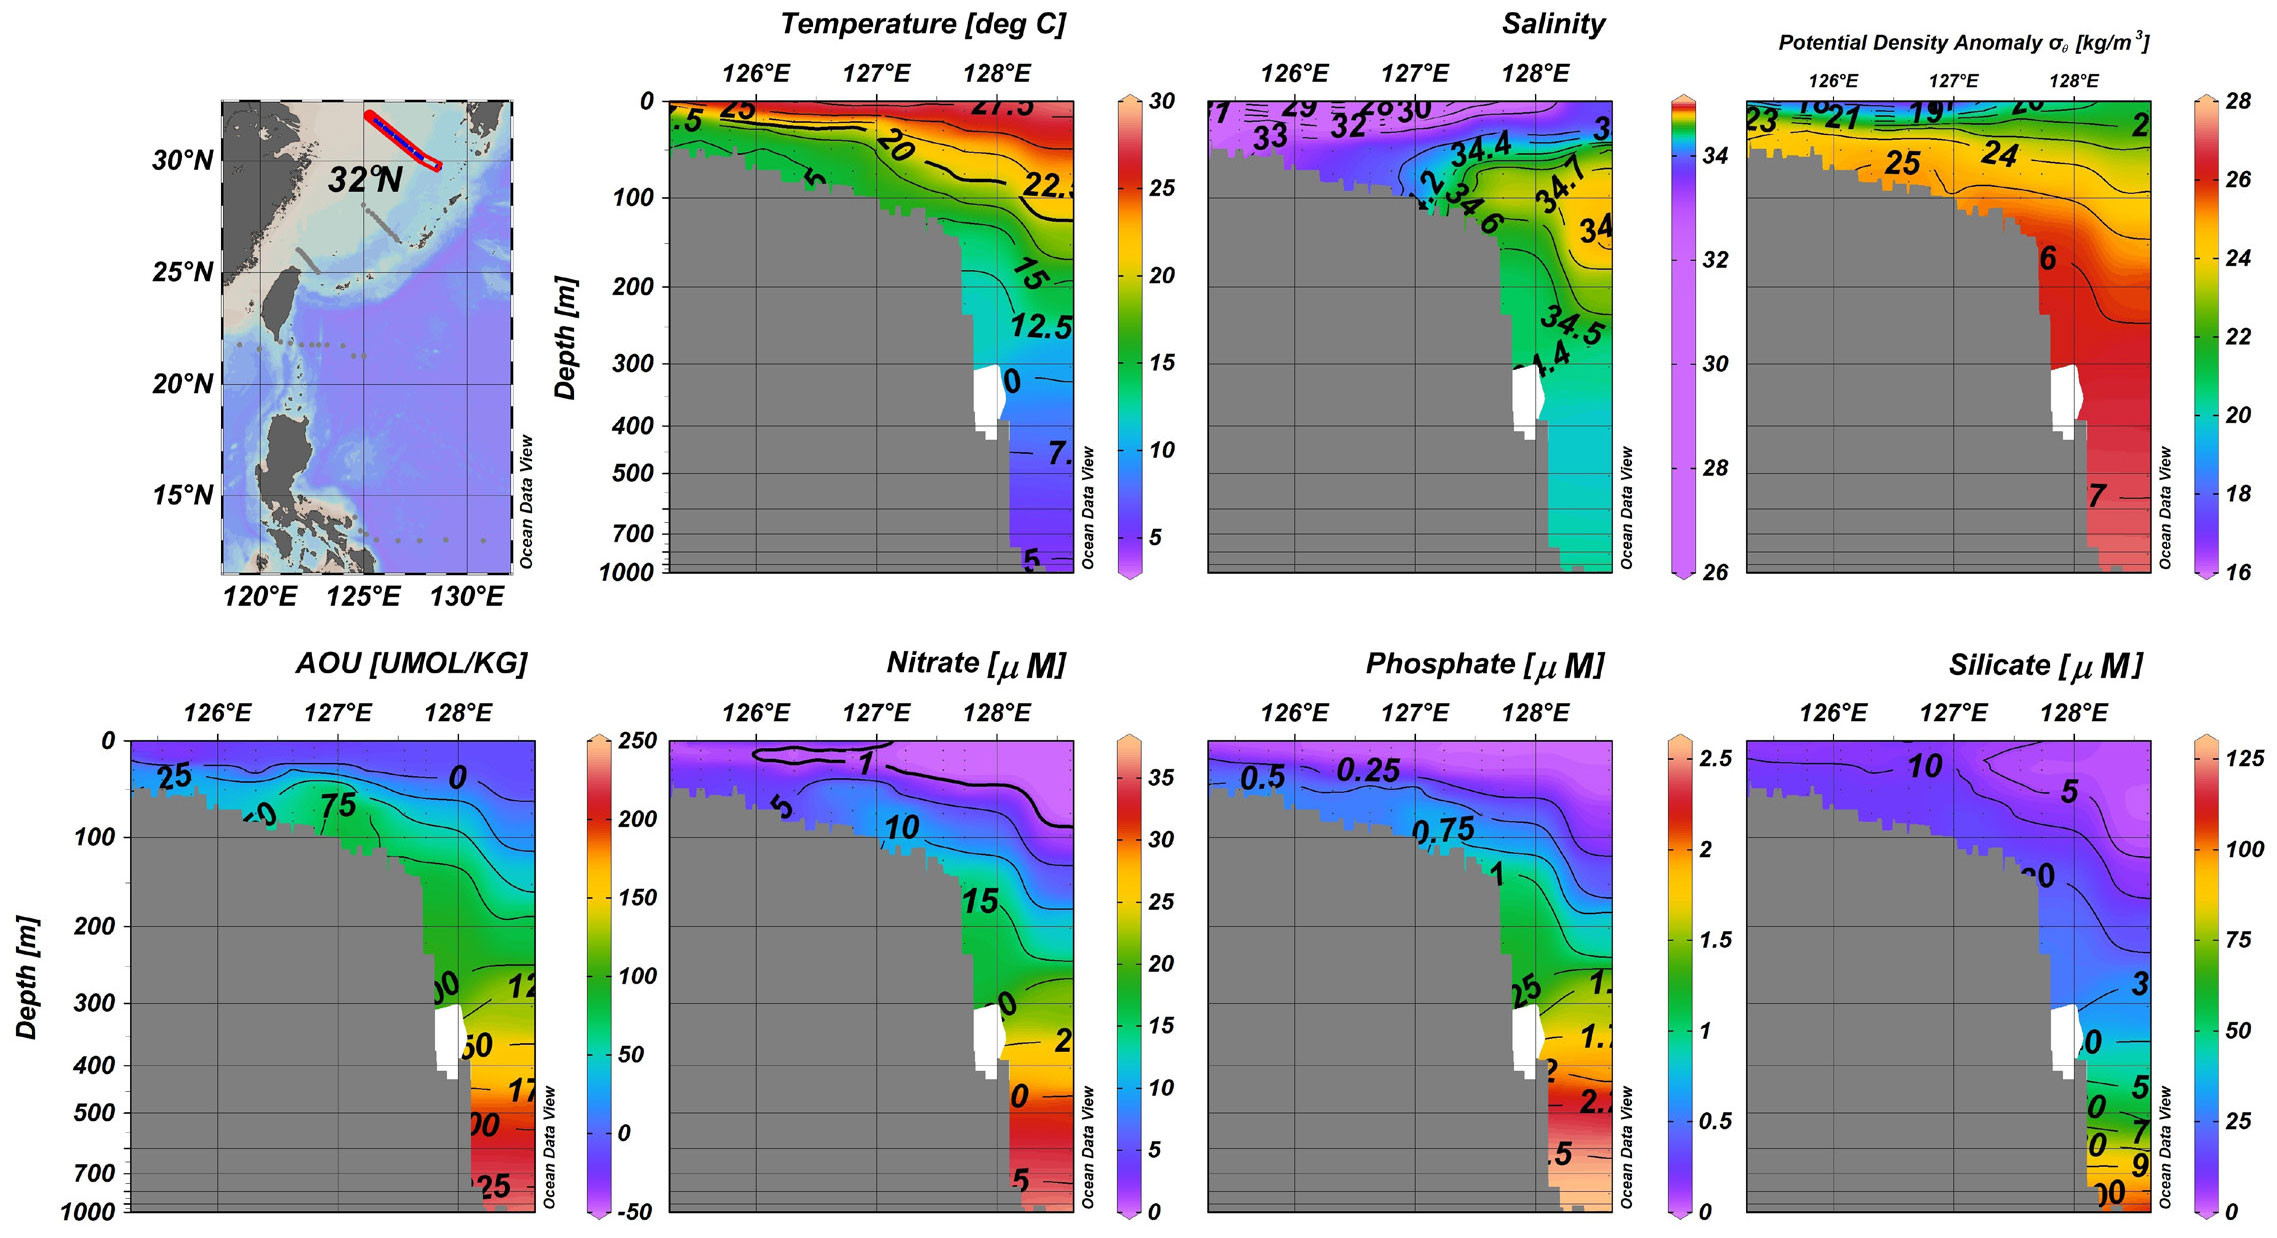
FIGURE 6. Zonal cross sections of temperature, salinity, σθ, AOU, nitrate, phosphate, and silicate northern of the ECS based on the KEEP-MASS data. Color shading and black contours represent the values of individual parameters. > High res figure
|
Discussion
Water Mass Dynamics in Luzon Strait
The water mass exchange in the LS is well known for its sandwich-like pattern. In the upper layer (water depth shallower than 500 m), there is a complex two-way exchange, but the net flux is westward. In the middle layer (water depth between 500 m and 1,500 m), the net flux is eastward, while in the deep layer (water depth deeper than 1,500 m), the net flux is westward. Though the major source of SCS seawater is WPS seawater, the upwelling and intense vertical mixing cause the salinity and temperature maxima to decrease while the salinity and temperature minima increase in the SCS (C.-T.A. Chen et al., 2001, 2006; Gan et al., 2006; Y. Liu et al., 2000; Tian et al., 2006).
Figure S1 presents temperature/salinity plots that indicate different water masses, which are simplified into two types—SCS-like and WPS-like—based on the salinity maximum in this study area. The corresponding locations are marked as red triangles and pink Xs, and blue triangles and light blue Xs in Figure 1. The value of 34.75 represents the S-max from an equal mixture of WPS and SCS portions. Although mixing in the subsurface water may differ from that in the middle layer, this study focuses only on the upper layer. The WPS-like water occupies the regions east of Luzon Island, the LS, and the eastern side of the Kuroshio Current. It is worth noting that a WPS-like station at 119°E (Figure 1), which was expected to exhibit an SCS-like pattern, may result from incomplete mixing. The SCS-like water is found in the western Luzon Islands, the northwest LS, and off the east coast of Taiwan, to the left of the Kuroshio, between approximately 21.75°N and 25°N, and even extends to the ECS region (Figure 1). The influence of fresher ECS water reduces the salinity in the region north of 25°N, where the lowest salinity value, around 28, is found in the surface layer (not shown in Figure S1A). Some data indicate vertical mixing phenomena off the northeast coast of Taiwan that also involve shelf water and further reduce the salinity to below the typical SCS water pattern (Hsueh et al., 1992). As the WPS water mixes with SCS water along the isopycnal, the mixed water exhibits lower temperature and salinity values than the original WPS water. This mixing also suggests an increase in nutrient concentration, as the SCS has higher nutrient values than the WPS at the same depth in the upper layer (Figure S2).
Nutrient Distribution and Latitudinal Trends
It’s important to note that various oceanographic factors, such as stratification, vertical mixing, eddy-driven transport, typhoons, winter cooling, horizontal advection, and geostrophic currents interacting with terrain effects, play significant roles in controlling the behavior and distribution of nutrients in the regions studied (Andres et al., 2015; Uchiyama et al., 2017; Jan et al., 2019; Y. Zhang et al., 2020). These physical conditions and processes influence the transport and availability of nutrients in the marine environment, contributing to the observed patterns in nutrient concentrations. For instance, a cyclonic eddy impinging on the Kuroshio east of Taiwan weakened poleward transport and reduced pycnocline slopes across the Kuroshio (Jan et al., 2017). As a result, the nitrate inventory changed, increasing when the pycnocline was uplifted and decreasing when it was depressed.
The 20°C isotherm (Figure S4) was used as a reference to compare uplift occurrences at different latitudes. At 18°N and 21.2°N, it lies at 200 m. However, at 21.5°N and 21.75°N, it tilts westward to a depth of 150 m. Off the east coast of Taiwan (22.8°–25.2°N), it uplifts to a depth of around 100 m. Further along the PN Line (28°N), the 20°C isotherm reaches approximately 60 m during September and October 2000. The depth difference of the 20°C isotherm between the WPS- and SCS-like water near the LS is around 50 m at 21.5°N and 21.75°N, and this disparity is similar to data collected from the WPS and the LS (Shaw, 1991). As the latitude increases, the difference also increases to about 100 m between 22.8°N and 24.2°N (east of Taiwan); the colder water is also discernible in satellite images (Figure 1 in Z. Huang et al., 2021). This uplift in the coastal area is influenced by both the interaction of different water masses and terrain effects, with half of the uplift resulting from the mixing of these water masses before terrain interactions. At 28°N on the PN Line, the depth difference of the 20°C isotherm between the western and eastern sides increases to approximately 120 m, as the main Kuroshio current is located at the shelf break (Y. Liu and Yuan, 1999; Yuan et al., 1998). In addition to the mechanisms described, year-round upwelling in northeast Taiwan contributes to bringing cold water to the surface layer (at least 60 m depth; Wu et al., 2008).
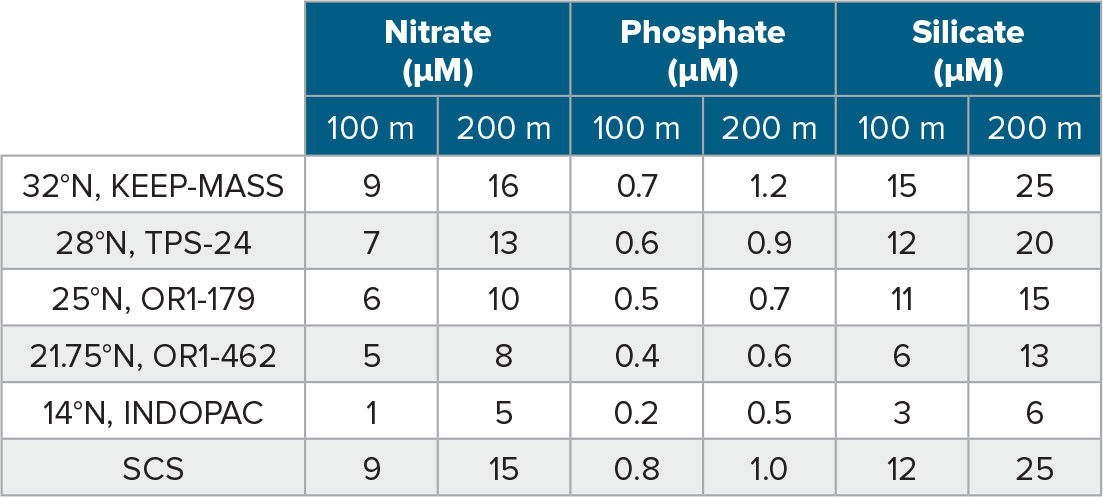
Seawater temperatures are generally inversely correlated with nutrient concentrations (Kamykowski and Zentara, 1986). Table 1 provides a summary of the uplifted features observed in the five cross sections studied. Nutrient concentrations are the most striking differences among these cross sections, especially when comparing data at depths of 100 m and 200 m. They are lowest in the southernmost cross section. The most extreme case is nitrate at 100 m, which is only about 1 µM, compared to around 9 µM in the northernmost cross section. At 200 m, nitrate increases from 5 µM at 14°N to 16 µM at 32°N (Table 1). In the southernmost section (14°N in Table 1), phosphate, the limiting nutrient in the inner ECS, registers the lowest concentrations, with values of 0.2 µM at 100 m and 0.5 µM at 200 m. In the northernmost section (32°N in Table 1), phosphate increases to 0.7 µM at 100 m and 1.2 µM at 200 m, playing a critical role in supplying essential nutrients to the ECS (T.-H. Huang et al., 2019). Similarly, silicate is abundantly available in the ECS, and its concentration shows a four- to fivefold increase in the northernmost section compared to the origin area of the Kuroshio, likely contributing to the silicate supply to the ECS.
TABLE 1. Concentrations of nitrate, phosphate, and silicate at different depths in various cross-sections. > High res table
|
Nutrient Inventories and Research Implications
The uplifted cold waters interact and mix with the surrounding waters, but nitrate behaves conservatively below 50 m on the shelf due to limited biological activity, as decreased sunlight inhibits the light-sensitive nitrifying bacteria (Guerrero and Jones, 1996a,b; Merbt et al., 2012). Nitrite in the euphotic zone primarily originates from phytoplankton metabolism (Kiefer et al., 1976), underlining the importance of biological factors in its distribution. For spatial comparison, nitrate concentration is integrated over depths of 120 m and 300 m in the repeat transects—the PN Line and 21.75°N (Table S1, Figure 1B,C). The shallowest area of the PN Line (Area I of Figure 1B, the ECS shelf) is around 120 m, so the depth-integrated nitrate concentrations represent the whole water column nitrate inventory. At a depth of 120 m in Areas I and II of Figure 1B,C, the nitrate inventory values along the PN Line are more than twice those along 21.75°N. This phenomenon results from the deeper nutricline depth at 21.75°N and the addition of nitrates from decomposed organic material on the ECS shelf (Y. Chen et al., 2016; J. Guo et al., 2018). The nitrate inventory values remain at similar levels from Areas III to V in Figure 1B,C between 0 m and 120 m, as the dominant water mass is WPS-like water. At a depth of 300 m in the PN Line (Area III of Figure 1B), the integrated nitrate concentration is higher than at 21.75°N. This is because the PN Line (Area III of Figure 1B) is close to the continental slope, where deeper water is uplifted by the terrain and mixed with high-nutrient concentration water from the SCS. The nitrate inventory values are at comparable levels in Areas IV and V of Figure 1B,C between 0 m and 300 m.
Table S1 shows the depth-integrated nitrate inventories between 0 m and 120/125 m and 0–300 m at different latitudes during September and October 2000. Overall, the SCS-like seawater has two to six times higher nitrate inventories than the WPS-like seawater, and these inventories increase with latitude. From 16°N to 25°N, the SCS-like nitrate inventories double at 125 m, whereas the values remain similar at 300 m. This phenomenon suggests that uplifting only influences the seawater at the 120 m layer but does not affect the deeper layer. In contrast, the WPS-like nitrate inventories are stable at 125 m. At the 300 m layer, the values rise significantly at 24.2°N, which is close to a ridge (about 800–1,000 m depth). This suggests that the terrain effect also increases the nitrate inventories of WPS-like seawater. The SCS-like nitrate inventory at 120 m on the PN Line is nearly twice as high as the result at 16°N due to the significant increase in nitrate concentration near the bottom layer. However, the WPS-like nitrate inventories at 120 m and 300 m are consistently around 50 mmol·m–2 and 600 mmol·m–2.
It is important to note that this analysis is preliminary at best, as it does not account for seasonal effects, and all the data were collected between May and November. Additionally, the study did not investigate potential variabilities influenced by factors such as the El Niño-Southern Oscillation, the Pacific Decadal Oscillation, or long-term trends (Jan et al., 2015; Kim et al., 2022; Wei et al., 2023). These factors could introduce significant variations and should be considered in future research to provide a more comprehensive understanding of the dynamics in the marine environment studied.
Conclusions
The Kuroshio Current is well known for its nutrient-poor surface layer and nutrient-rich deeper layers. Consequently, if only the surface waters of the Kuroshio were to enter the ECS, they would contribute little to biological production in the region. The reason that the ECS is an important fishing ground primarily lies in the upwelling of nutrient-rich subsurface waters from the Kuroshio, which originates from the NPEC, known for its oligotrophic conditions. The concentration of nitrate does not exceed 1 µM until a depth of 160 m, which is too deep and dark for phytoplankton to efficiently utilize the nutrients.
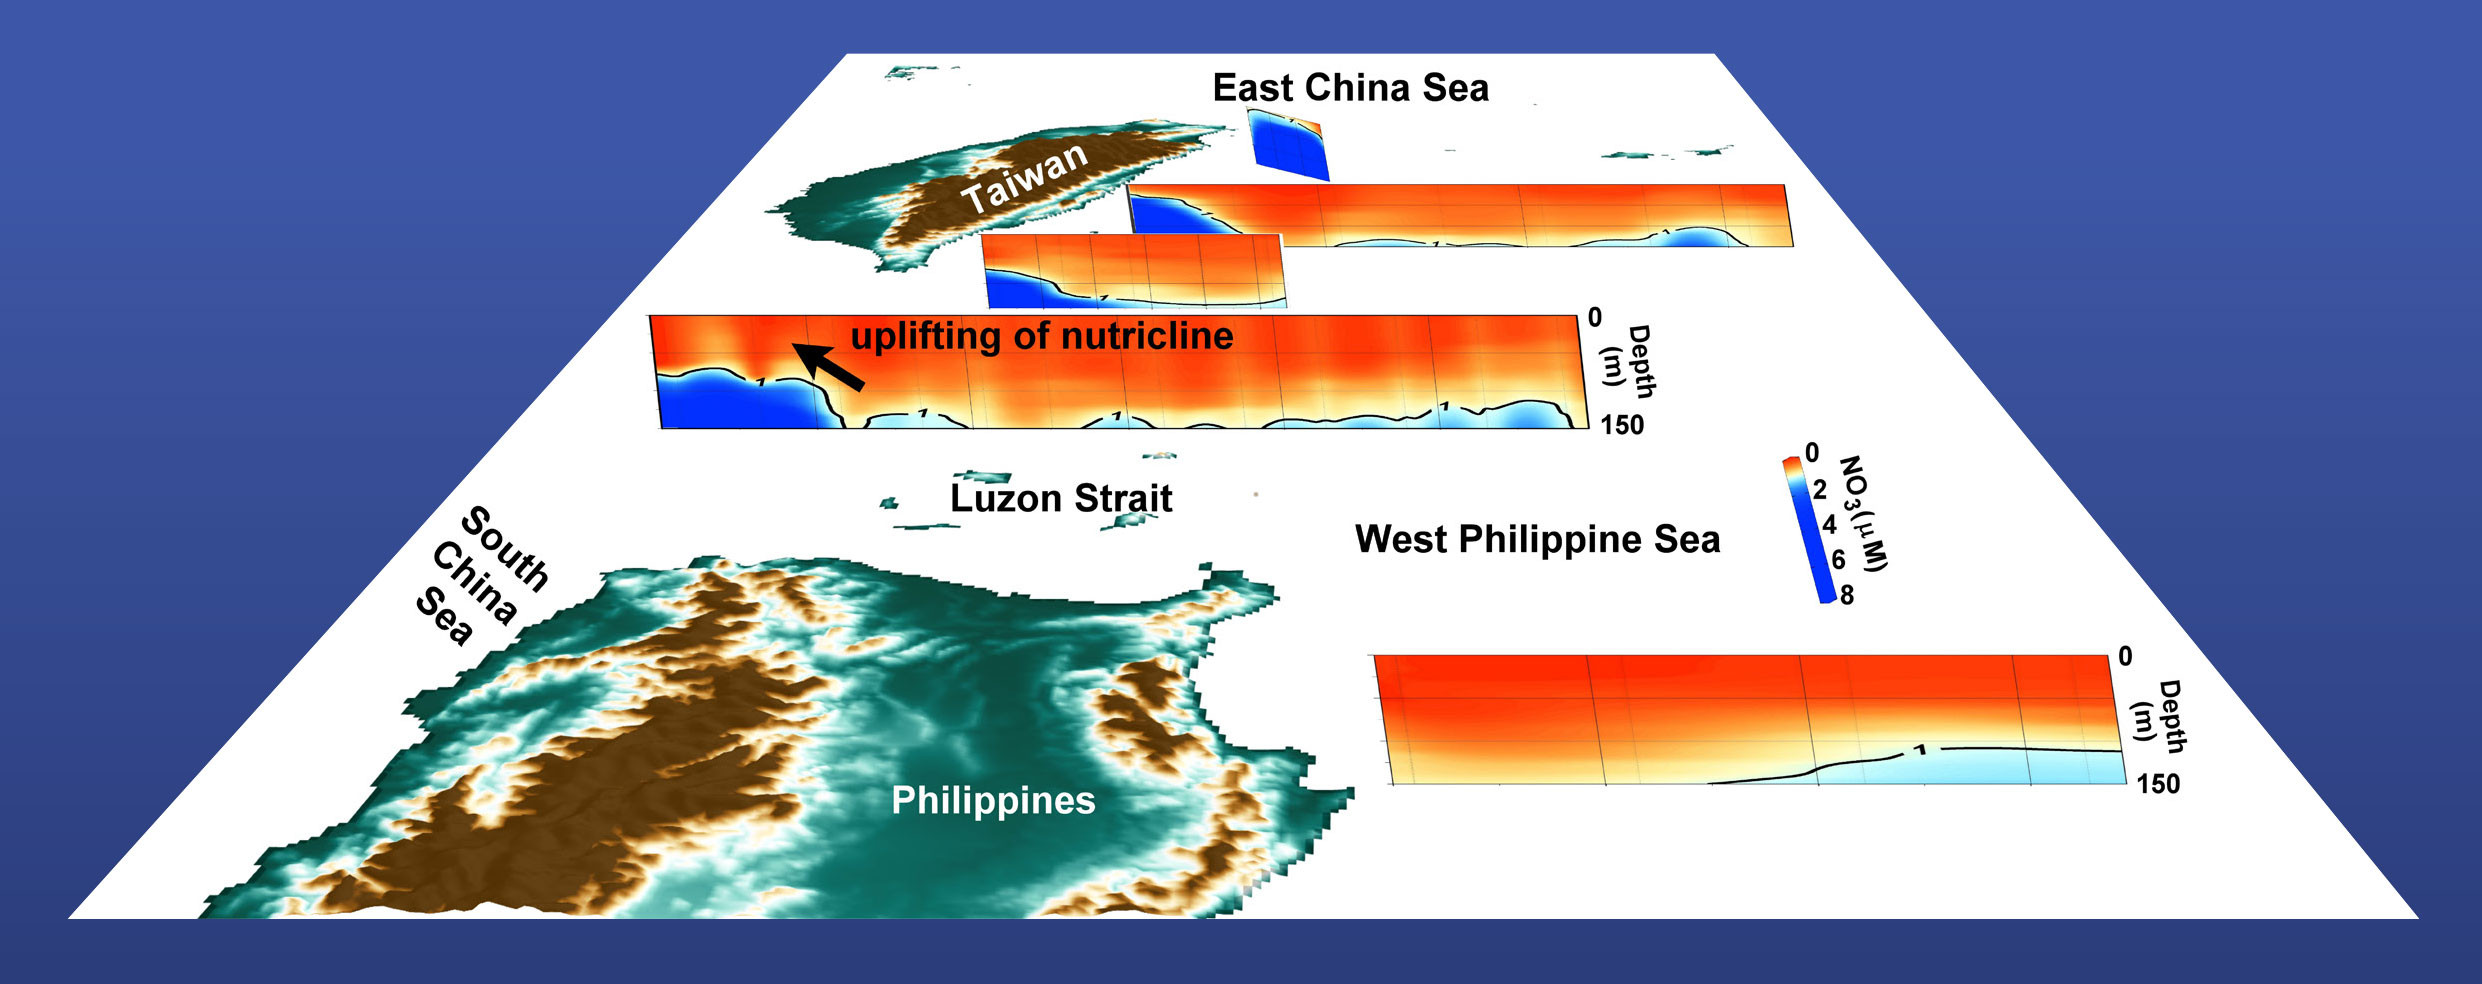
The subsurface waters rich in nutrients from the NPEC begin to rise when the NPEC encounters the Philippines. The subsequent northward-flowing portion is known as the Kuroshio, where the nitrate concentration reaches 1 µM at a depth of 100 m. This indicates an uplift of nutrients by about 50 m. Some of the Kuroshio waters enter the SCS, where intensive upwelling and vertical mixing bring up subsurface waters along with nutrients. Consequently, by the time these waters exit the SCS and rejoin the Kuroshio, the nutrient content is enriched. In other words, the left-hand part of the Kuroshio now contains SCS waters with higher nutrient concentrations. This phenomenon is clearly observed in the cross section southeast of Taiwan.
Further upwelling occurs when the Kuroshio is forced to turn northeastward as it encounters the continental shelf and slope of the ECS. Topographically induced upwelling further lifts nutrients from the SCS-influenced left-hand part of the Kuroshio. This continuous upwelling as the Kuroshio flows along the shelf break of the ECS provides an additional supply of nutrients to the ECS shelf, contributing to its significance as a productive fishing area. The complex interplay of oceanographic processes, upwelling, and the exchange of water masses significantly impacts nutrient availability in the ECS, ultimately influencing the region’s biological productivity and its role as a vital fishing ground.
Data Availability
Data will be made available on request.
Acknowledgments
This research was sponsored by the Taiwan Ministry of Science and Technology (MOST 112-2611-M-110-011) and the Higher Education SPROUT Project (13C14).
Authorship Contribution Statement
Ting-Hsuan Huang: Formal analysis; writing - original draft; visualization.
Chen-Tung Arthur Chen: Conceptualization; writing - review and editing; supervision.
Declaration of Competing Interest
The authors declare that they have no known competing financial interests or personal relationships that could have appeared to influence the work reported in this paper.