Introduction
The Atlantic Meridional Overturning Circulation (AMOC) plays a crucial role in regional and global climate. It transports mass and heat to the Northern Hemisphere (e.g., Frajka-Williams et al., 2019; Trenberth et al., 2019), is characterized by sinking at several locations in the northern North Atlantic (e.g., Talley, 2013), and thus provides a pathway for sequestering anthropogenic carbon for centuries to millennia (e.g., Gebbie and Huybers, 2012; Brown et al., 2021). Here, we define the AMOC as the upper cell of the meridional overturning circulation in the Atlantic Ocean. It moves warm, saline waters northward where these waters lose heat to the atmosphere, sink, and flow southward as colder and fresher North Atlantic Deep Water (NADW). Due to positive feedbacks involving the advection of salt by the northward-flowing branch, the AMOC may be bistable, as suggested by simplified box models of meridional overturning circulation (e.g., Stommel, 1961).
Paleoclimate data are consistent with the AMOC having more than one equilibrium state, and they suggest that the AMOC has abruptly changed in the past, sometimes in just a few decades. For example, there is broad evidence from paleoclimate records that AMOC existed for thousands of years in a reduced state during the transition out of the last ice age (e.g., McManus et al., 2004; Lynch-Stieglitz et al., 2014; Rafter et al., 2022), which may have driven changes in atmospheric circulation, precipitation patterns, and global surface temperature (e.g., Wang et al., 2001; Anderson et al., 2009; Cheng et al., 2009; Clark et al., 2012). Some authors have interpreted these intervals as times of AMOC collapse (McManus et al., 2004), but paleo data cannot quantitatively reconstruct the strength of the AMOC, so there is a reluctance within the paleoceanographic community to use this term. Nevertheless, a popular schematic in paleoclimate research represents the AMOC in either an “on” state or an “off” state (Figure 1; Rahmstorf, 2002). A vigorous, or “on,” state of the AMOC would correspond to the meridional circulation in the modern Atlantic, which is on the order of 15–20 Sv (1 Sv = 106 m3 s–1; Frajka-Williams et al., 2019). A “collapsed,” or “off,” state of the AMOC could occur when surface waters are not dense enough to sink deeply in the North Atlantic. Importantly, the upper cell volume flux during a “collapse” cannot be quantified by paleo data. In this paper, we do not define an AMOC “collapse” as a complete cessation of circulation but rather a large and persistent reduction in upper cell volume flux relative to that of the “on” state.
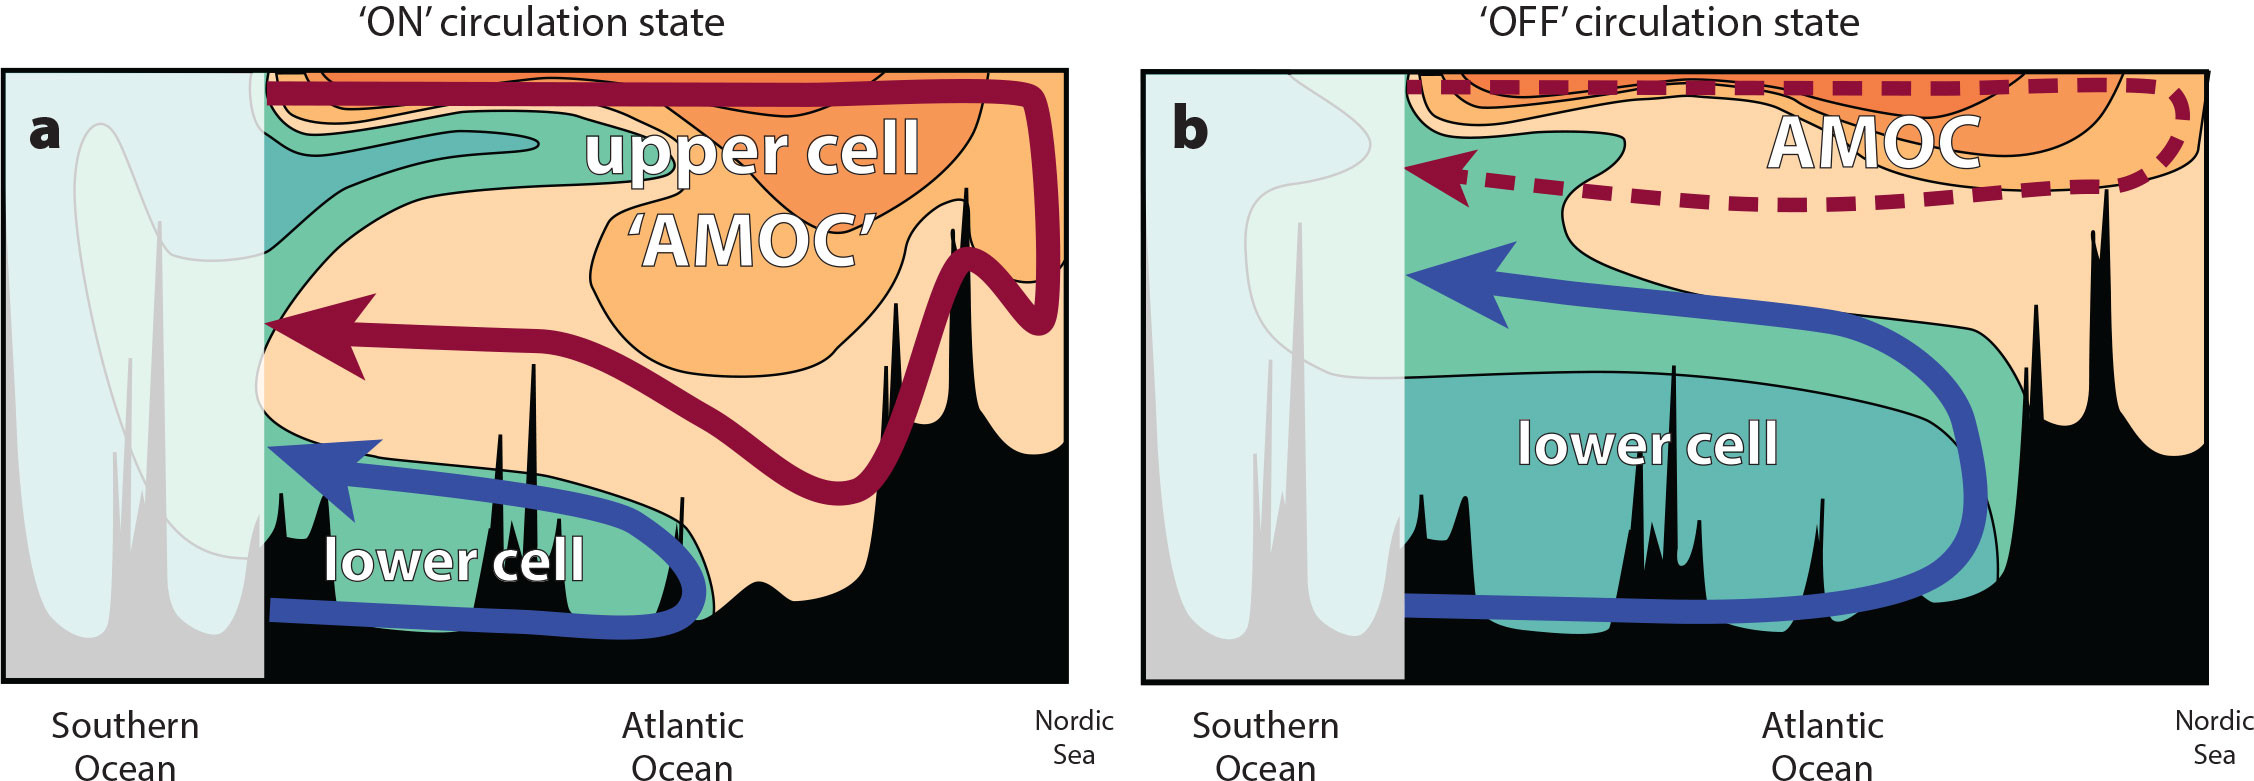
FIGURE 1. Schematic of two different states of the Atlantic Meridional Overturning Circulation (AMOC). (a) A vigorous or “on” state, with a relatively deep and strong upper cell, similar to the circulation in the modern Atlantic. (b) A collapsed or “off” state, with a relatively shallow upper cell and a larger lower (Antarctic Bottom Water) cell. A number of paleoceanographic observations have been interpreted as reflecting a collapsed state of the AMOC, as in (b), during the last deglaciation. The unlabeled contours and colors schematically represent water masses originating from the North Atlantic (orange) and Southern Ocean (green), with darker colors qualitatively representing a greater fraction of the water mass. > High res figure
|
Global climate models from the International Panel on Climate Change (IPCC) Coupled Model Intercomparison Project 6 (CMIP6) predict that AMOC will “very likely” decline over the twenty-first century due to anthropogenic forcing, but it is less likely that the AMOC will collapse (though the term “collapse” is not precisely defined in this context; Fox-Kemper et al., 2021). Some reconstructions of North Atlantic sea surface temperature and other oceanographic properties during the past ~100 years were interpreted to mean that the AMOC has weakened during this period (Thornalley et al., 2018; Caesar et al., 2021), but there is still significant uncertainty, as other North Atlantic records show conflicting signals (Kilbourne et al., 2022; Terhaar et al., 2025). Time series of direct AMOC observations are not long enough to confidently detect trends in the magnitude of the overturning circulation (Frajka-Williams et al., 2019), although a recent study reported a slight decline in the AMOC at 26°N between 2004 and 2022 (Volkov et al., 2024). Thus, it is unclear whether the AMOC has already responded to anthropogenic forcing.
The mechanisms by which the northward-flowing surface waters are transformed into dense water masses and exported southward are complex. Classically, thermal convection has been thought of as a means to form dense water masses in the Labrador, Irminger, and Greenland Seas (Broecker and Denton, 1989; Manabe and Stouffer, 1995), but more recent studies show that deep convection does not result in net sinking (Spall, 2004; Pickart and Spall, 2007). Instead, sinking likely occurs in the boundary currents of marginal seas (e.g., Nordic and Labrador Seas) where those currents interact with each other and with steep topography (Bower et al., 2011; Gary et al., 2011; Katsman et al., 2018; Johnson et al., 2019; Desbruyères et al., 2020). Convection likely exerts a strong influence on the properties of the deep waters through mixing with the boundary currents, but it may not be the primary mechanism for forming the deep waters. A similar process occurs farther south where NADW interacts with the lower, counter-rotating cell of Antarctic Bottom Water (AABW) originating from the Southern Ocean. The interplay between the relative strength of the NADW and AABW cells likely sets the depth of the AMOC and thus impacts AMOC dynamics (Marshall and Speer, 2012).
Paleoceanographic reconstructions, simulations from numerical models, and data inversions can provide insight into ocean circulation changes during periods of past climate change and into the mechanisms responsible, but all approaches have their own limitations. Marine archives, such as corals and sediment cores, have limited spatial and temporal coverage, and proxy reconstructions have analytical, chronological, and interpretive uncertainties. Paleoceanographic data can be used to estimate the spatial distribution of oceanic properties (such as temperature, isotopic compositions, and nutrient concentrations), but reconstructions of AMOC are primarily qualitative. In contrast, numerical models can provide quantitative volume flux estimates, but they suffer from their own limitations due to, for example, uncertainties in surface boundary conditions (atmospheric forcing), initial conditions, and parameterization of sub-grid-scale phenomena. Notably, due to computational limitations, numerical ocean models applied in climate research are generally characterized by coarse horizontal resolution (on the order of 1°), which means that the mesoscale and submesoscale ocean eddy fields are not explicitly resolved, and coastal phenomena known to contribute to shelf-ocean exchange are poorly or not represented. Finally, inverse methods have been applied to combine paleoceanographic data and models to extract quantitative information about past ocean circulation (e.g., LeGrand and Wunsch, 1995; Gebbie and Huybers, 2006; Marchal and Curry, 2008; Burke et al., 2011; Amrhein et al., 2015; Zhao et al., 2018; Marchal and Zhao, 2021). These applications showed that firm inferences about past circulation states from existing paleoceanographic data are difficult given the combined limitations of data and model.
In this paper, we review the paleoceanographic data that have led to the prevailing view of a weak AMOC for millennia (or longer) during the last glacial-interglacial transition and climate model simulations of these events. We also discuss the mechanisms that could have driven past AMOC changes, with particular attention to freshwater forcing. Finally, we discuss the extent to which existing observational and model results are relevant to current and future changes in the AMOC, with particular emphasis on the possible role of background climate state. This review is distinct from other recent reviews on similar topics (e.g., Lynch-Stieglitz, 2017; Liu, 2023) through a focus on (1) the lessons learned about the mechanisms of past AMOC changes as inferred from paleoceanographic reconstructions and modeling studies, and (2) the implications of these changes for future AMOC variability.
Paleoceanographic Proxies of the AMOC
Paleoceanographic data provide an avenue for extending the relatively short instrumental record and for documenting the state of the ocean during periods of past climate change. In particular, they provide a source of empirical information for assessing the capacity for AMOC to undergo a drastic state change, such as depicted schematically in Figure 1. We focus on the most recent glacial-interglacial transition (also called the last “deglaciation” or “Termination I”), which occurred following the Last Glacial Maximum (LGM; ~22–18 ka; ka = thousands of years ago) and ended at the start of the Holocene (10 ka), the current interglacial period (see Lynch-Stieglitz, 2017, for a broader review of AMOC proxy data during the last glacial period). During the deglaciation, several abrupt cooling and warming events occurred in the circum-North Atlantic that have been linked with, respectively, AMOC decrease and increase through its role in transporting heat to the high-latitude North Atlantic. After describing the deglacial sequence of climatic events, we review the evidence that led to the widely held view that deglacial climate oscillations were linked to AMOC changes.
The first event, called Heinrich Stadial 1 (HS1; 18–14.7 ka), was a North Atlantic cold interval notable for high iceberg discharge and thought to be associated with reduced AMOC strength (Heinrich, 1988; Bond et al., 1992, 1993; Broecker et al., 1992; Broecker, 1994; Hemming, 2004). Following HS1, the North Atlantic warmed abruptly at the beginning of the Bølling-Allerød (BA, 14.7–12.6 ka), thought to be associated with rejuvenation of the AMOC (T. Chen et al., 2015). The BA was followed by another cold period, the Younger Dryas (YD, 12.9–11.6 ka), which is also thought to be associated with a weak AMOC (Broecker, 2003). Finally, the YD concluded with another abrupt warming, at the beginning of the Holocene, the relatively stable current warm period.
Paleoceanographic proxies used to make inferences about the strength and/or structure of the AMOC (and/or the associated deep counter-rotating cell) are often classified into two basic categories: water mass proxies and kinematic proxies. Water mass proxies are thought to record the distinct isotopic or chemical signature of different deep water masses, in particular, northern-sourced NADW and southern-sourced AABW. Examples of water mass proxies are the stable carbon isotope ratio (δ13C) of fossil benthic foraminifera (W.B. Curry et al., 1988; Duplessy et al., 1988; W.B. Curry and Oppo, 2005; Eide et al., 2017), the cadmium/calcium concentration ratio of fossil benthic foraminifera, from which the seawater Cd concentration (CdW) is estimated (Boyle, 1988; Marchitto and Broecker, 2006; Oppo et al., 2018), and the authigenic neodymium isotopic composition (εNd) of sediments and deep-sea corals (Frank, 2002; Goldstein and Hemming, 2003; Du et al., 2020). Kinematic proxies are assumed to be more sensitive to flow rate than water mass proxies. Examples include the radiocarbon age of fossil benthic foraminifera and deep-sea corals (Keigwin, 2004; Robinson et al., 2005), the protactinium-231 to thorium-230 activity ratio of bulk sediment, 231Pa/230Th (Yu et al., 1996; McManus et al., 2004), and the mean size of sortable silt,  (McCave et al., 1995, 2017; McCave and Hall, 2006). Note that, albeit conceptually useful, the distinction between water mass and kinematic proxies is not without ambiguity: all water properties derived from measurements in the sediment or deep-sea coral are affected by the flow rate, which would make them “kinematic,” and kinematic proxies reflect to some degree the composition of water masses.
All proxies are imperfect in the sense that proxy values may be sensitive to multiple factors, other than the effects of water mass composition and circulation rate, and each of them has limitations that are necessary to consider when interpreting paleoceanographic records. Some of the water mass tracers (δ13C of dissolved inorganic carbon and CdW) are functions of biological activity. The differences in composition between northern- and southern-sourced deep water reflect regeneration of dissolved inorganic carbon and nutrients in the deep ocean as organic matter from the surface is remineralized at depth. Thus, changes in biological activity can alter the spatial distribution of these tracers independently of water mass or circulation rate change. The δ13C of dissolved inorganic carbon is also affected by air-sea gas exchange (Lynch-Stieglitz and Fairbanks, 1994; Lynch-Stieglitz et al., 1995).
Radiocarbon measurements on benthic foraminifera or deep-sea coral samples are corrected for isotopic fractionation (including biological fractionation), so biological activity should not affect the distribution of these measurements. However, radiocarbon is still a complicated tracer, because surface waters that sink to depth in high-latitude regions are characterized by different initial radiocarbon values (Key et al., 2004). It takes about a decade for the carbon isotopic ratios in the ocean mixed layer to equilibrate with the atmospheric values (Broecker and Peng, 1974; Lynch-Stieglitz et al., 1995; Sarmiento and Gruber, 2006; Jones et al., 2014). This equilibration time is longer than the residence time of surface waters in deep-water formation regions, particularly in the Southern Ocean (Bard, 1988). Processes such as upwelling and the presence of sea ice, which reduces air-sea gas fluxes (Prytherch et al., 2017), can lead to large differences between the radiocarbon activity, or age, of the surface waters and that of the atmosphere (“surface reservoir age”). Therefore, radiocarbon records from benthic foraminifera and deep-sea corals reflect both the water mass transit time from the surface (due to en route radioactive decay) and the surface reservoir age. Some recent work (Muglia and Schmittner, 2021) suggests that surface reservoir age is the primary driver of deep radiocarbon distributions in the Atlantic Ocean, thus making Atlantic radiocarbon values more a water mass tracer than a kinematic tracer.
For neodymium isotopes, deep-water values are thought to be dominated by conservative mixing, but sedimentary sources can also alter isotopic compositions along deep-water flow paths, particularly in poorly ventilated basins, such as the deep Pacific and Indian Oceans (Abbott et al., 2015; Du et al., 2018, 2020). Certain types of sediment (particularly volcanic ash and ice-rafted debris) can also be more reactive and prone to delivering non-conservative additions of Nd to seawater (Wilson et al., 2013; Blaser et al., 2016; Du et al., 2016).
The use of bulk sediment 231Pa/230Th as a circulation tracer relies on the theoretical expectation that, while 231Pa and 230Th are produced at approximately uniform rates in the ocean (from the decay of 235U and 234U, respectively), 231Pa is in general scavenged less intensively by sinking particles than 230Th and hence is more sensitive to circulation than 230Th (Henderson and Anderson, 2003). As a result, the ratios of the two isotopes in sinking particles and sediment would be dependent on lateral transport of water (i.e., on the AMOC), with stronger transport leading to lower 231Pa/230Th in the underlying sediment. However, the 231Pa/230Th ratio of marine particles in the water column has been found to vary with their chemical compositions (e.g., Chase et al., 2002; Hayes et al., 2015) and with sediment lateral redistribution (S.Y.-S. Chen et al., 2021), complicating its use as an AMOC proxy.
One of the most widely cited reconstructions used as evidence of AMOC change across the deglaciation is the 231Pa/230Th record from the Bermuda Rise in the Northwest Atlantic (Figure 2e; McManus et al., 2004). This record shows an abrupt increase in 231Pa/230Th to values close to the production ratio (which would imply very little lateral flow out of the North Atlantic) during HS1, and another smaller increase during the Younger Dryas. The high 231Pa/230Th values during HS1 were attributed to a dramatically weakened AMOC. Other 231Pa/230Th data from across the North Atlantic broadly support this interpretation (Ng et al., 2018). Compilations of benthic foraminifera δ13C from across the deep Atlantic show low values during HS1 and an abrupt increase at the start of the Bølling-Allerød (Figure 2g; Thiagarajan et al., 2014; Lynch-Stieglitz et al., 2014; Lynch-Stieglitz, 2017), values that have been interpreted as the resumption of a deep AMOC at the Bølling-Allerød from a weaker state during HS1. Radiocarbon data from the Northwest Atlantic also show an abrupt decrease in apparent ventilation age at the start of the Bølling-Allerød from “older” values during HS1 and another pulse of old water at the YD (Figure 2f; Robinson et al., 2005; Hines, 2017; Rafter et al., 2022). Compiled εNd data are also consistent with a weakened AMOC during HS1 and the YD (Figure 2h; Pöppelmeier et al., 2019; Du et al., 2020), although these data are less supportive of a fully collapsed AMOC.
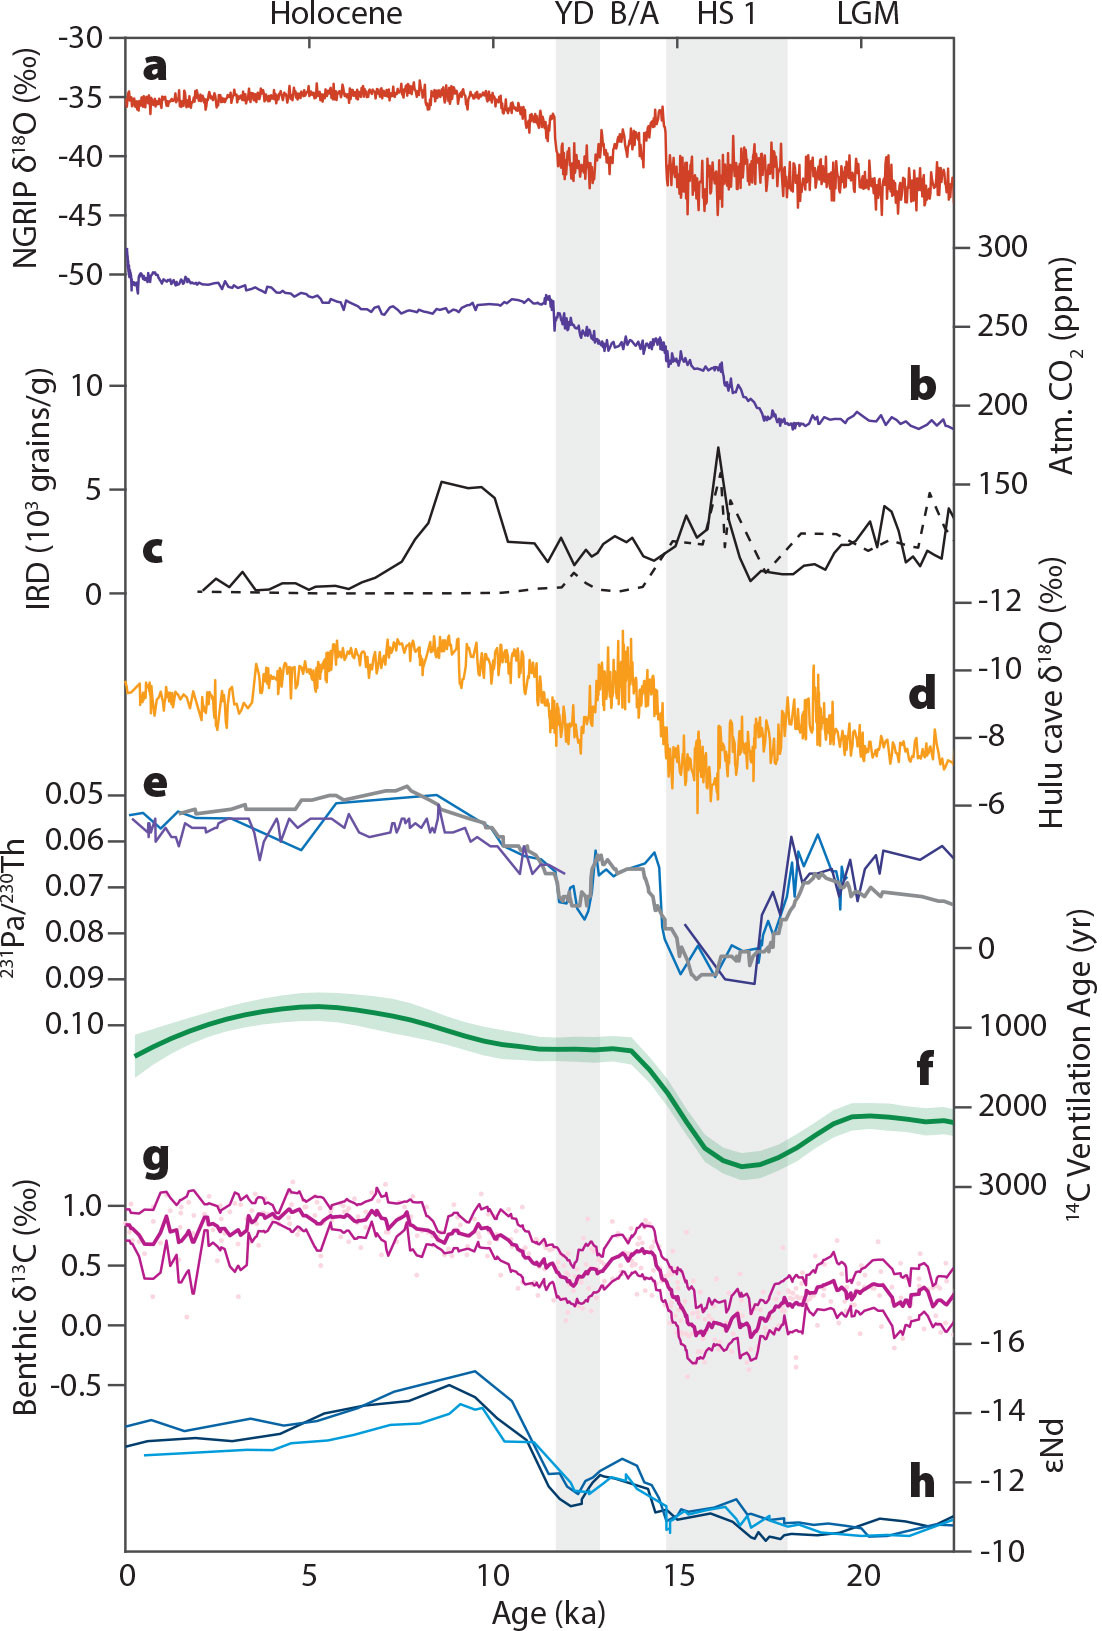
FIGURE 2. Paleoclimate records across the deglaciation. (a) Northern Hemisphere temperature from NGRIP δ18O of ice (North Greenland Ice Core Project Members, 2004; Andersen et al., 2006; Rasmussen et al., 2014). (b) Atmospheric CO2 from the West Antarctic Ice Sheet (Marcott et al., 2014). (c) Ice-rafted debris concentration in the Northwest Atlantic at sites DY081-GVY001 (solid) and EW9309-37JPC (dashed) (Zhou et al., 2021). (d) Hulu cave δ18O (Cheng et al., 2016). (e) 231Pa/230Th from the Bermuda Rise (thin lines: McManus et al., 2004; Lippold et al., 2009, 2019) and across the North Atlantic (thick line: Ng et al., 2018). (f) Compiled deep Atlantic 14C ventilation age (Rafter et al., 2022). (g) Deep North Atlantic δ13C (as in Lynch-Stieglitz et al., 2014; data from Hodell et al., 2008; Tjallingii et al., 2008; Mulitza et al., 2008; Zarriess and Mackensen, 2011; Shackleton et al., 2000; Skinner and Shackleton, 2004; Skinner et al., 2007). (h) εNd from the Blake Bahama Outer Ridge (Pöppelmeier et al., 2019). YD = Younger Dryas. B/A = Bølling-Allerød. HS 1 = Heinrich Stadial 1. LGM = Last Glacial Maximum. IRD = Ice-rafted debris. > High res figure
|
The processes that might decouple variations in each proxy from AMOC differ among proxies. Therefore, if these processes were the dominant control on the deglacial variability in each record, we would not expect them to correlate with one another. The finding that many deglacial ocean circulation proxy records share common features at approximately the same times is apparent evidence for changes in AMOC over the deglaciation. In other words, while each proxy record could be explained by processes other than circulation, the most parsimonious explanation for all the records taken together would be that AMOC was abruptly reduced (or collapsed) during HS1 and the YD.
This interpretation is also consistent with paleoclimate records from terrestrial archives, including the oxygen isotopic composition of Greenland ice cores (Figure 2a; North Greenland Ice Core Project Members, 2004); the oxygen isotopic composition of Chinese speleothems (Figure 2d; Wang et al. 2001; Cheng et al., 2009, 2016), which records coeval shifts in atmospheric circulation patterns; and the atmospheric CO2 concentration recorded in Antarctic ice, which in turn is sensitive to the interplay between the AMOC and the lower AABW circulation cell (Figure 2b; Marcott et al., 2014). A complication to this picture is the possibility that the atmosphere can respond to a weakened AMOC by strengthening its meridional heat transport due to increased equator-to-pole temperature gradients (Bjerknes, 1964). This feedback in the coupled ocean-atmosphere system is referred to as “Bjerknes Compensation” and likely diminishes the signal in atmospheric-linked proxy records of a weakened or collapsed AMOC. Despite this possibility, collective paleoclimate data from both marine and continental archives are consistent with AMOC weakening during both HS1 and the YD, with a period of reinvigorated circulation during the BA. The HS1 and YD emerge, therefore, as key time intervals for investigating AMOC changes and their driving mechanisms. Information from these time intervals could in turn be used to inform our understanding of possible AMOC changes in future.
Freshwater Forcing in Transient Model Simulations of AMOC Decline/Collapse Across the Deglaciation
To study deglacial climate variability, scientists have performed and analyzed transient simulations with numerical climate models. The most coordinated of such efforts is the Paleoclimate Modelling Intercomparison Project (PMIP), where participating groups apply climate models to conduct numerical experiments with prescribed boundary conditions. The “Last Deglaciation” is one such experiment, which simulates the period from 21 ka to 9 ka (Ivanovic et al., 2016). Given its relatively long duration—about 12,000 years—there are severe computational limitations to the spatial resolution of climate models that can be run to simulate the deglacial climate. The horizontal resolution of the ocean component of climate models, such as those included in the most recent PMIP (PMIP4), is too coarse (on the order of 1°) to explicitly simulate ocean eddies, which play important roles in a wide variety of processes that are thought to be crucial for AMOC—such as deep convection, lateral restratification, and the dispersal and dilution of continental freshwater. For example, recent observations around the convective region of the Labrador Sea have confirmed that submesoscale processes (smaller than 100 km) are critical to the restratification of deep convective plumes (Clément et al., 2023), yet large-scale ocean models with sufficient resolution can take years to run (Pennelly and Myers, 2020). Eddies produced from the instability of buoyant coastal currents formed by meltwater discharge may also be effective in transporting meltwater offshore (Marchal and Condron, 2025). To address the limitation due to coarse resolution, sub-grid-scale processes (e.g., deep convection, dense overflows, coastal eddies) are parameterized in the PMIP models, but this approach can lead to inaccuracies in model sensitivity to freshwater fluxes, with some models reported to be overly sensitive to fresh water (Bouttes et al., 2023) and others not sensitive enough (Valdes, 2011; He and Clark, 2022; Snoll et al., 2024).
Some model experiments (Liu et al., 2009; Menviel et al., 2011) have explicitly used AMOC proxy records as tuning targets; in these experiments, the temporal evolution of the freshwater flux into the ocean is manipulated so as to qualitatively match the proxy records (in both studies, the McManus et al. [2004] 231Pa/230Th record from the Bermuda Rise and reconstructed Greenland temperature variations were used). The motivation for using freshwater forcing to simulate the AMOC changes inferred from the proxy records is as follows: over the deglaciation, continental ice sheets melted, leading to the release of vast amounts of fresh water into the ocean, driving a sea level rise of ~130 m (Clark et al., 2009; Carlson and Clark, 2012; Lambeck et al., 2014). The released fresh water could have reduced the density of surface waters in deep-water formation regions of the North Atlantic, inhibiting deep convection there and reducing the AMOC. Deglacial simulations by Liu et al. (2009, “TraCE-21k”) and Menviel et al. (2011) reproduce this scenario. Both simulations also match other paleoclimate reconstructions, in addition to those taken as evidence for AMOC changes and used as tuning targets.
While deglacial simulations with prescribed freshwater forcing can produce results that match paleoclimate records, the magnitude and timing of the freshwater fluxes assumed in these simulations are not consistent with freshwater fluxes calculated from the data-constrained deglacial reconstructions of continental ice sheets (e.g., GLAC-1D: Tarasov and Peltier, 2002; Tarasov et al., 2012; Briggs et al., 2014; and ICE-6G_C: Argus et al., 2014; Peltier et al., 2015; Ivanovic et al., 2016). Both the simulations of Liu et al. (2009; TraCE-21k) and Menviel et al. (2011) prescribe freshwater fluxes of approximately 0.2 Sv during HS1 that are nearly twice as high as those predicted from GLAC-1D and ICE-6G_C (Bouttes et al., 2023; Figure 3a). There are also significant offsets in the timing of the freshwater fluxes: Meltwater Pulse 1A, at the beginning of the BA (Deschamps et al., 2012; Lambeck et al., 2014), occurs earlier (by a few centuries) in the ice sheet reconstructions than in the climate simulations, and the peak of meltwater input in the ice sheet reconstructions occurs when freshwater flux is shut off in the TraCE-21k simulation. A similar result holds true for Meltwater Pulse 1B, which roughly coincides with the end of the YD.
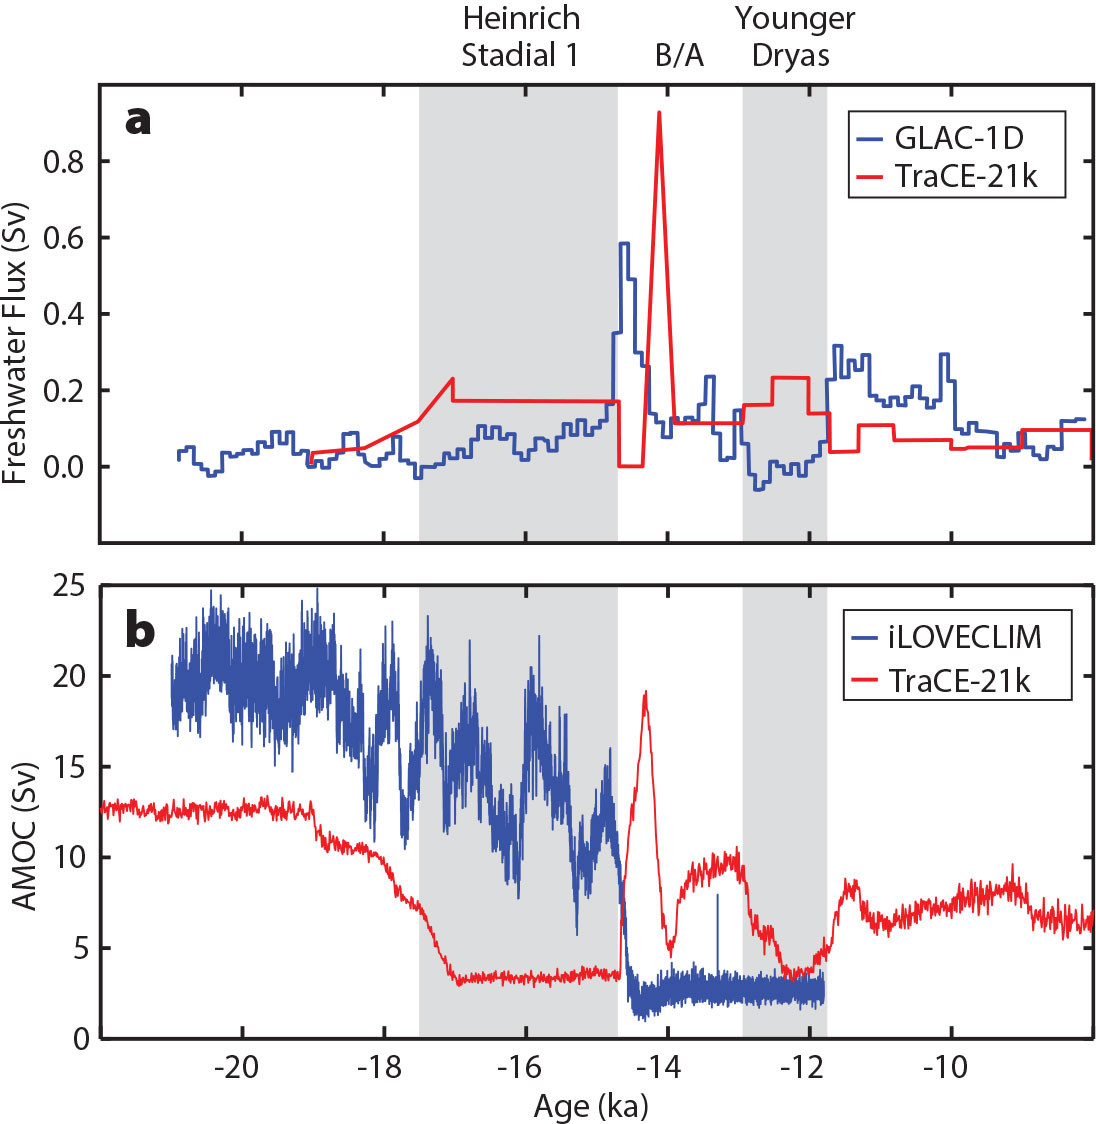
FIGURE 3. Transient model simulations of AMOC across the deglaciation. (a) Freshwater flux from ice sheet model simulation GLAC-1D with freshwater flux time series in the TraCE-21k model (Liu et al., 2009; Bouttes et al., 2023). (b) AMOC strength calculated as the maximum streamfunction between 20°N and 50°N below 500 m from TraCE-20k (Liu et al., 2009) and iLOVECLIM (Bouttes et al., 2023). > High res figure
|
In summary, while freshwater forcing has been used to drive AMOC variability in climate models, the highest freshwater fluxes assumed in the climate model simulations occur when freshwater fluxes in the ice sheet models are believed to be relatively low. This phenomenon is referred to as the “meltwater paradox” (e.g., Snoll et al., 2024). Indeed, in other simulations forced with freshwater fluxes that are more consistent in magnitude and timing with freshwater flux reconstructions, the AMOC does not collapse at all or collapses at the start of the BA (Figure 3b; Bouttes et al., 2023; Snoll et al., 2024). Thus, it appears that fresh water entering the North Atlantic from the melting of the Laurentide Ice Sheet was unlikely to be the driving mechanism for reducing the AMOC during HS1 and YD.
Freshwater Mechanisms for Driving Abrupt Changes in the AMOC
Given that geologic reconstructions suggest that HS1 and the YD were not times of accelerated melting of Northern Hemisphere ice sheets and elevated freshwater fluxes to the North Atlantic (Figure 3a), alternative mechanisms for AMOC weakening at these times must be sought. The mechanisms driving AMOC reduction at HS1 and the YD need not have been the same, and paleoceanographic data are consistent with different magnitudes of AMOC change at each event, with HS1 thought to be the larger and longer reduction of the two (Ng et al., 2018).
Heinrich events were associated with massive iceberg discharges from the Laurentide Ice Sheet (Ruddiman, 1977; Heinrich, 1988; Broecker, 1994; Hemming, 2004), so it is possible that fresh water from melting icebergs played an important role. Unlike the deglacial meltwater that enters the ocean directly in liquid form, icebergs can travel much farther from the coast before they disintegrate (Fendrock et al., 2022). The paths of large icebergs originating from terrestrial ice sheets can be tracked by ice-rafted debris (IRD), which consists of coarse grains of continental origin that are embedded in the icebergs and deposited on the seafloor as the icebergs melt. In general, IRD is found most prominently in marine sediment cores collected from between ~40°N and 50°N in the Atlantic Ocean (Ruddiman, 1977); however, smaller amounts of IRD have been found much farther north, including in the Nordic Seas and south of Iceland (e.g., Elliot et al., 2001; Thornalley et al., 2010), and to the south on the Bermuda Rise (Keigwin and Boyle, 1999). Therefore, the supply of fresh water from melting icebergs could be a mechanism for reducing the AMOC (Broecker, 1994). This hypothesis is supported by low δ18O values measured in fossil planktonic foraminifera (indicative of low salinity) from Heinrich layers within the main IRD belt proposed by Ruddiman (Bond et al., 1992; Hemming 2004). However, as yet, clear evidence of low salinity farther north has not been found.
The Younger Dryas is another period of IRD deposition in the North Atlantic (e.g., Zhou and McManus, 2024) and the Arctic Ocean (e.g., Hillaire-Marcel et al., 2013; Lakeman et al., 2018), although IRD fluxes at this time appear to have been smaller than at HS1 (e.g., Zhou and McManus, 2024). While the YD is not associated with a time of widespread ice sheet melting according to sea level data and ice sheet models (Tarasov and Peltier, 2002; Tarasov et al., 2012; Lambeck et al., 2014; Briggs et al., 2014), it is notably associated with the abrupt draining of Lake Agassiz, a proglacial lake formed by the melting Laurentide Ice Sheet that sat at the boundary of Minnesota, North Dakota, Ontario, and Manitoba (Broecker et al., 1989; Teller et al., 2002). It was initially thought that Lake Agassiz drained east at the YD, directly into the North Atlantic via the St. Lawrence River (Broecker et al., 1989; Clark et al., 2001), but direct evidence for this has been elusive, and more recent studies suggest that the lake instead drained north into the Arctic via the Mackenzie River (Tarasov and Peltier, 2005; Murton et al., 2010; Keigwin et al., 2018; Süfke et al., 2022). This result is supported by model simulations, which show that fresh water discharged into the ocean from the St. Lawrence River does not immediately spread offshore but is instead transported away from the subpolar North Atlantic in boundary currents, into the subtropical gyre. Meltwater from the Mackenzie Valley into the Arctic Ocean is more likely to reach deep-water formation regions directly, regardless of whether the Canadian Arctic Archipelago is ice-covered or open (Condron and Winsor, 2012).
The focus has often been on deep convection regions when it comes to deglacial freshwater-driven perturbations of the AMOC, whether the fresh water is delivered by icebergs or directly in liquid form; however, recent physical oceanographic observations and modeling indicate that capping water mass transformation along the boundary currents or reducing the zonal density gradient across the mid-latitude North Atlantic (Buckley and Marshall, 2016; Yeager et al., 2021; Chafik et al., 2023; Frajka-Williams et al., 2023) may be more important for disrupting the AMOC. During the deglaciation, meltwater introduced to the western subpolar North Atlantic could have been entrained offshore along the northern flank of the western boundary currents that constitute the upper limb of the AMOC, including the Gulf Stream and the North Atlantic Current (the eastward extension of the Gulf Stream). This entrained meltwater could significantly alter the density gradients across these powerful currents and hence reduce their strength and associated heat transport (e.g., Yeager et al., 2021; Madan et al. 2024).
While the timing of the highest meltwater delivery to the North Atlantic across the deglaciation does not match the times when AMOC appeared to be weaker (HS1 and the YD), the other mechanisms discussed above could have contributed to a weakening of the AMOC. Thus far, climate models have not been able to accurately simulate these processes due to the computational cost required to resolve dynamical phenomena at small spatial scales for long time periods. Although freshwater forcing is frequently used as a convenient way to produce changes in the AMOC in models, it is not the only mechanism that can drive variations in AMOC strength. For example, other modeling studies using a coarse resolution Earth system model suggest that abrupt AMOC oscillations can arise from gradual changes in ice sheet height that modify the wind field (Zhang et al., 2014) or atmospheric CO2 concentration (Zhang et al., 2017).
How Can Paleo Observations Inform Modern Understanding and Future Predictions?
Future projections of AMOC strength from coupled climate models support a moderate decline but not a full collapse of AMOC over the next 100 years (Fox-Kemper et al., 2021). However, these estimates are only reliable if we understand the underlying physics that drives an AMOC decline. As we discuss in the previous section, there are still gaps in our understanding of what caused past abrupt changes in the AMOC. The most recent deglaciation may be a good past analog, because there is paleoceanographic evidence for abrupt AMOC changes occurring on timescales of decades to centuries, and a recent quantitative estimate of freshwater input from iceberg melt during HS1 (Zhou and McManus, 2024) is comparable to modern ice fluxes from the Greenland Ice Sheet (GIS; Bamber et al., 2018). On the other hand, there were important differences from our current climate state, including large areas of land and sea ice cover. It has long been suggested that the AMOC is sensitive to background climate state, and intermediate climate conditions, with moderate CO2 concentrations, ice volumes, and temperatures, are more conducive to millennial climate variability than peak glacial or interglacial conditions (McManus et al., 1999; Sima et al., 2004; Barker and Knorr, 2021). For example, abrupt climate oscillations known as Dansgaard-Oeschger (DO) Events were observed in Greenland ice cores and North Atlantic sediment cores during the middle of the last glacial period (~75 ka to 25 ka), and these have been linked to variations in the AMOC (North Greenland Ice Core Project Members, 2004; Andersen et al., 2006; Rasmussen et al., 2014; Böhm et al., 2014; Henry et al., 2016). Several modeling studies have replicated this observation and found that the AMOC is less stable under intermediate climate conditions (that is, neither fully glacial nor fully interglacial; Ganopolski and Rahmstorf, 2001; Sima et al., 2004; Galbraith and de Lavergne, 2019).
If there is evidence that the inherent stability of the AMOC is dependent on background climate state, does that mean that the mechanism(s) that drive AMOC change also vary with the mean climate state? Unlike the deglaciation, no large continental ice sheets cover North America or Eurasia today, and no ice-dammed lakes are present to flood the subpolar North Atlantic. However, both the GIS and Arctic sea ice are rapidly melting (The IMBIE Team, 2019; Sumata et al., 2023; Greene et al., 2024), and the Beaufort Gyre has been accumulating fresh water that could be released to the North Atlantic more rapidly than melting ice sheets would do (Haine et al., 2015). How these different freshwater sources (GIS, Arctic sea ice, and Beaufort Gyre) could alter the AMOC under the modern climate conditions of the North Atlantic remains unknown.
Investigating AMOC variability during warm periods, such as the current Holocene epoch, past interglacial periods, and even farther into the geologic past, may provide more context for what we might expect in the future. During the current Holocene epoch, fresh water and ice were released from Hudson Bay at 8.2 ka (Barber et al., 1999), causing global impacts (Alley et al., 1997). Although it is difficult to detect a decade-to-century scale event in the deep sea, there is some evidence for AMOC reduction at 8.2 ka (Keigwin et al., 2005; Kleiven et al., 2008). These reconstructions show different locations of freshwater delivery to the ocean during the last deglaciation that may help us understand the relationship between the location of freshwater input into the North Atlantic and its impacts on the AMOC.
Today, the Greenland meltwater combines with outflow from the Arctic Ocean through Davis Strait (B. Curry et al., 2014), Hudson Strait (Straneo and Saucier, 2008), and Fram Strait (Karpouzoglou et al., 2023) to carry large amounts (1–3 Sv) of fresh, polar water masses into the coastal circulation system in the subpolar North Atlantic (Foukal et al., 2020; Le Bras et al., 2021). Much of this fresh water is retained on the continental shelves of East Greenland and Labrador, but it can be transported into the basin interior along West Greenland (Luo et al., 2016; Dukhovskoy et al., 2019; Pacini and Pickart, 2023) and the Grand Banks (Jutras et al., 2023; Fox et al., 2022; Furey et al., 2023; Duyck et al., 2025). It is likely that the Grand Banks was the source of the large freshening event seen in the Iceland Basin in 2015 (Holliday et al., 2020) and in the Irminger Sea in 2019 (Biló et al., 2022). However, neither how these events impacted the AMOC, nor how similar they were to previous freshening events—the so-called great salinity anomalies of the 1970s and the 1980s (Dickson et al., 1988; Belkin et al., 1998)—is well understood.
Paleo freshwater discharge events may help elucidate the impact of freshwater routing: current understanding suggests that HS1 originated in Hudson Strait, the YD originated in the Mackenzie River, and the 8.2 ka event originated in Hudson Bay and probably reached as far as Cape Hatteras. Much of the recent work on AMOC dynamics and stability (Boers, 2021; Ditlevsen and Ditlevsen, 2023) has focused on model-based surface fingerprints of AMOC variability (Rahmstorf et al., 2015; Caesar et al., 2018, 2021). But the suitability of this fingerprint for inferring AMOC variability has been widely debated, and it is likely timescale dependent (Little et al., 2020; Kilbourne et al., 2022; Li et al., 2022; X. Chen and Tung, 2023). Paleoceanographic records could play an important role in determining the spatial signature of AMOC variability by examining times with large apparent changes in AMOC strength (e.g., HS1). This effort could then inform the modern observations and evaluations of model results.
High temporal resolution and multiproxy paleoceanographic records could help determine leads and lags between different climate variables during times when there were large fluctuations in the AMOC, and thus constrain whether AMOC decline is the cause or the effect of climate variability. It is challenging to definitively calculate leads and lags using marine sediment records, because chronology is often uncertain (especially between different locations), but chronological uncertainties can be circumvented by making proxy measurements of the AMOC and surface climate change on the same sediment core. Using this approach, Barker et al. (2015) showed that North Atlantic cold intervals typically precede ice rafting events during glacial times over the past ~450 kyr. In addition, as the paleoceanographic community continues to generate, compile, and synthesize data, a more complete and nuanced view of past changes in the AMOC will likely emerge. For example, while there is evidence for a dramatically weakened AMOC during HS1, some sediment cores record traces of North Atlantic-sourced water in the deep sea (Repschläger et al., 2021).
Going much further back in time, a mean climate state closer to the modern climate may have occurred in the mid-Pliocene (~3 million years ago), when proxy data estimate that temperatures were ~3°C warmer, sea level was higher, and atmospheric CO2 concentration was ~400 ppm (Haywood et al., 2016; McClymont et al., 2020). Draut et al. (2003) suggested that mid-Pliocene climate conditions were relatively stable, but the difficulty in recovering marine archives that extend back >3 million years and have high enough resolution to record centennial to millennial climate variations makes it challenging to assess the stability of the AMOC during the Pliocene. Model simulations of the Pliocene suggest that the AMOC was similar or slightly stronger than the pre-industrial, but there is spread between model simulations in the amplitude and sign of the change (Weiffenbach et al., 2023). As a result, it is difficult to conclusively constrain AMOC stability under warm future climate conditions, and it is important to consider that current climate conditions are changing at a rate that is likely faster than the rate of changes during the mid-Pliocene.
Conclusions
The fate of the AMOC under future anthropogenic warming is of great interest due to the wide-ranging impacts thought to be associated with past AMOC changes, including large and abrupt temperature changes and shifts in large-scale precipitation patterns. Paleoclimate data from the most recent glacial-interglacial transition are consistent with (but do not generally require, given their limitations) a large and abrupt decrease in AMOC strength during HS1 and the YD. Therefore, these time intervals could be used to determine the mechanisms responsible for large changes in the AMOC. Climate model simulations of the deglaciation can be tuned to reproduce the timing of the AMOC changes inferred from paleoclimate records, but only by applying freshwater fluxes that are unrealistic in timing and magnitude according to sea level records and ice sheet reconstructions (Snoll et al., 2024, and references therein). Meltwater from icebergs, rather than liquid fresh water introduced into the ocean from ice sheet collapse, may have driven deglacial AMOC changes, given the correspondence between purported intervals of weak AMOC and intervals of IRD accumulation in North Atlantic sediments. In addition, small-scale oceanic processes that are not well represented in coarse resolution climate models may have influenced the AMOC response to freshwater fluxes from disintegrating ice caps. While the Laurentide Ice Sheet does not exist today, some quantitative estimates of ice discharge during past Heinrich Events are similar in magnitude to current ice loss from the GIS (Zhou and McManus, 2024). However, it is not known how long this freshwater flux would need to be applied in order to significantly perturb the AMOC, or whether such a perturbation depends on the background climate state.
Modern observations may be too short to resolve with high confidence decadal trends in AMOC strength. Paleoclimate reconstructions for the Common Era (the past 2,000 yr) give a longer timescale context, but they do not always provide a clear picture of AMOC history, because the relationship between each proxy and the AMOC is complex, and because AMOC changes might have been relatively small during this period. Longer paleoceanographic records may shed light onto other aspects of the AMOC, however. By examining deglacial intervals characterized by large climatic changes (such as HS1 and the YD), paleoceanographic records of surface ocean properties could be used to more clearly estimate the fingerprints of AMOC change, which could then be applied to modern observations. Further investigation of the 8.2 ka climate event in the early Holocene and the mid-Pliocene may provide mechanistic insight into future changes in the AMOC, given the similar background climate state. Thus, paleoceanography can play a valuable role, not only in elucidating the mechanisms that may drive changes in the AMOC but also for addressing other open questions in the study of modern AMOC.
Acknowledgments
This work was supported by the Anonymous Trustee Early Career Fellowship (SKVH), the Early Career Scientist Endowed Fund at the Woods Hole Oceanographic Institution (NPF), grant 2123128 from the National Science Foundation (NPF), the James E. and Barbara V. Moltz Early Career Science Fellowship (KMC), and the WHOI Investment in Science Program (DWO). We would also like to acknowledge helpful comments from three anonymous reviewers that significantly improved our paper.