Introduction
The Atlantic Meridional Overturning Circulation (AMOC) is one of the most important circulation components in Earth’s climate system. It transports buoyant waters northward in the upper 1,000 m of the Atlantic Ocean to the high-latitude North Atlantic and the subarctic seas, where these waters are transformed by strong heat loss and by several processes that affect their salinity, such as meltwater input and brine rejection. The resulting dense waters are then transported southward throughout the Atlantic at depths between 1 km and 3 km and subsequently dispersed throughout the Southern Ocean and the Indo-Pacific Ocean (see Buckley and Marshall, 2016, for a review).
By transporting heat and salt northward throughout the Atlantic Ocean, the AMOC plays a key role in sequestration of anthropogenic heat and carbon (Fontela et al., 2016), thus mitigating global warming. Outside of the tropics, the contribution of the ocean to total meridional heat transport is relatively small (<20%) compared to that of the atmosphere (Trenberth et al., 2019); however, it has significant climate implications due to the AMOC’s long-term memory, which manifests itself as variability on decadal and multidecadal timescales (R. Zhang et al., 2019) and a delayed response to anthropogenic forcing (Weijer et al., 2020). In fact, changes in the operation of the AMOC have been implicated in the well-documented climate swings during the last ice age—known as Dansgaard/Oeschger cycles and Heinrich events—and the rapid transitions between the Bølling–Allerød and Younger Dryas events at the end of the last glacial period (Broecker et al., 1985; Lynch-Stieglitz, 2017). Uncertainties about the fate of the AMOC in a warming climate (Weijer et al., 2020), and even the possibility of a collapse (Weijer et al., 2019), make a thorough understanding of the AMOC and its drivers imperative for our ability to anticipate future changes in our climate system.
In recent decades, the role of the Arctic Mediterranean1 as the northernmost terminus of the AMOC and the two-way interactions between the AMOC and the northern seas have come into focus. Several long-term monitoring programs have improved our estimates of the AMOC and the associated exchanges of water, heat, and salt. The Rapid Climate Change/Meridional Overturning Circulation and Heatflux Array (RAPID/MOCHA) has been monitoring the strength of the AMOC at 26.5°N since 2004 (Cunningham et al., 2007), while the Overturning in the Subpolar North Atlantic Program (OSNAP) array has been measuring the AMOC in the subpolar North Atlantic (SPNA) since 2014 (Lozier et al., 2019; Li et al., 2021). Other monitoring programs measure transports across several sections of the Greenland-Scotland Ridge (GSR; Østerhus et al., 2019), through Fram Strait (Karpouzoglou et al., 2022) and the Barents Sea Opening (Skagseth et al., 2008), and in the Nansen and Amundsen Basins of the Arctic Ocean (Pnyushkov and Polyakov, 2022, in this issue). At the same time, the number of autonomous drifting Argo floats, which observe the temperature and salinity of the upper 2 km, has been increasing since 1999 (Jayne et al., 2017). Other important progress has been made in the development of better ocean models (Fox-Kemper et al., 2019) that can be quite realistic (Haine et al., 2021).
In this paper, we review some recent advances in our understanding of these linkages, particularly in the last decade. We conclude by outlining prominent challenges and opportunities.
Linking the AMOC and the Arctic Mediterranean
The surface branch of the AMOC is most focused in the Gulf Stream, the fast western boundary current that moves northward along the east coast of North America (Figure 1). Separating at Cape Hatteras, it continues northeastward, rounds the corner at the Grand Banks, and continues to the northeast as the North Atlantic Current (NAC). In the eastern North Atlantic Ocean (ENA), the NAC bifurcates: a significant fraction recirculates southward and then westward to feed the Gulf Stream in the subtropical gyre, while roughly 15 Sv (1 Sv = 106 m3 s–1) escapes northward and skirts the eastern boundary of the subpolar gyre. Some of this water joins the subpolar gyre and flows west as the Irminger Current. About 8 Sv cross the GSR, the undersea ridge system that connects Greenland, Iceland, the Faroe Islands, and Scotland (Østerhus et al., 2019; Figure 2).
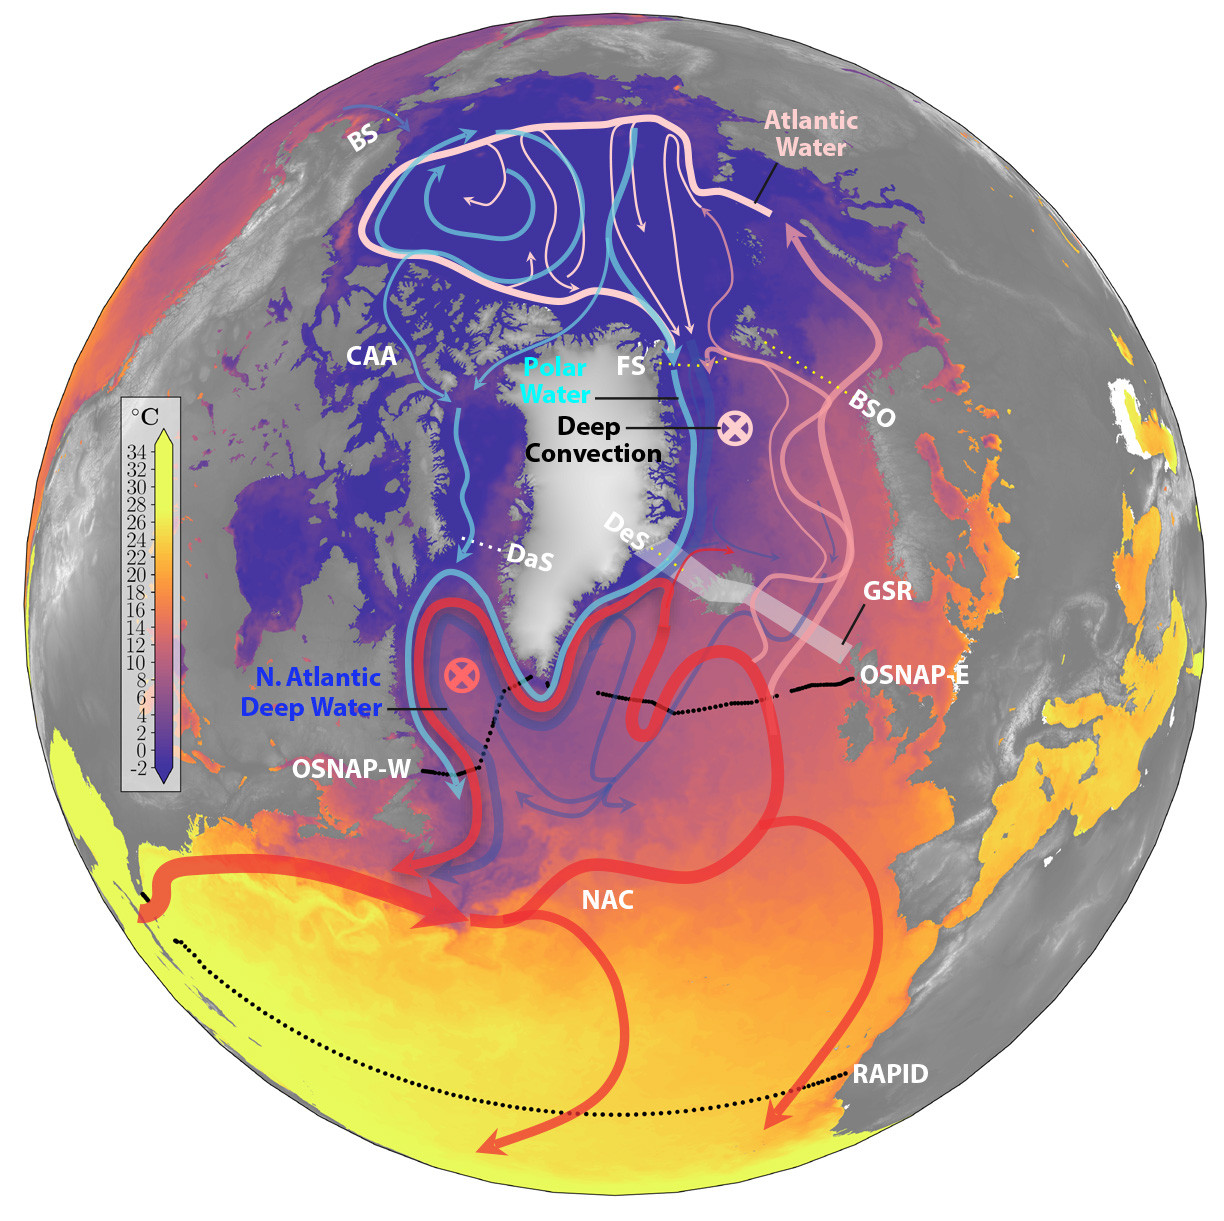
FIGURE 1. Schematic of the horizontal circulation in the North Atlantic and Arctic Mediterranean. The Polar Water (cyan) lies at the surface, the North Atlantic Deep Water (blue) lies at depth, and the Atlantic Water from the North Atlantic Current lies at the surface in the Atlantic and Nordic Seas and at intermediate depth in the Arctic Ocean (red and pink). The Rapid Climate Change (RAPID) and Overturning in the Subpolar North Atlantic Program (OSNAP) arrays are shown with black dots. The base map shows sea surface temperature for June 2021 (from Group for High Resolution Sea Surface Temperature [GHRSST]; JPL Mur MEaSUREs Project, 2015). See also Figure 2, which emphasizes the vertical overturning circulation. BS = Bering Strait. CAA = Canadian Arctic Archipelago. FS = Fram Strait. BSO = Barents Sea Opening. DaS = Davis Strait. DeS = Denmark Strait. GSR = Greenland-Scotland Ridge. NAC = North Atlantic Current. > High res figure
|
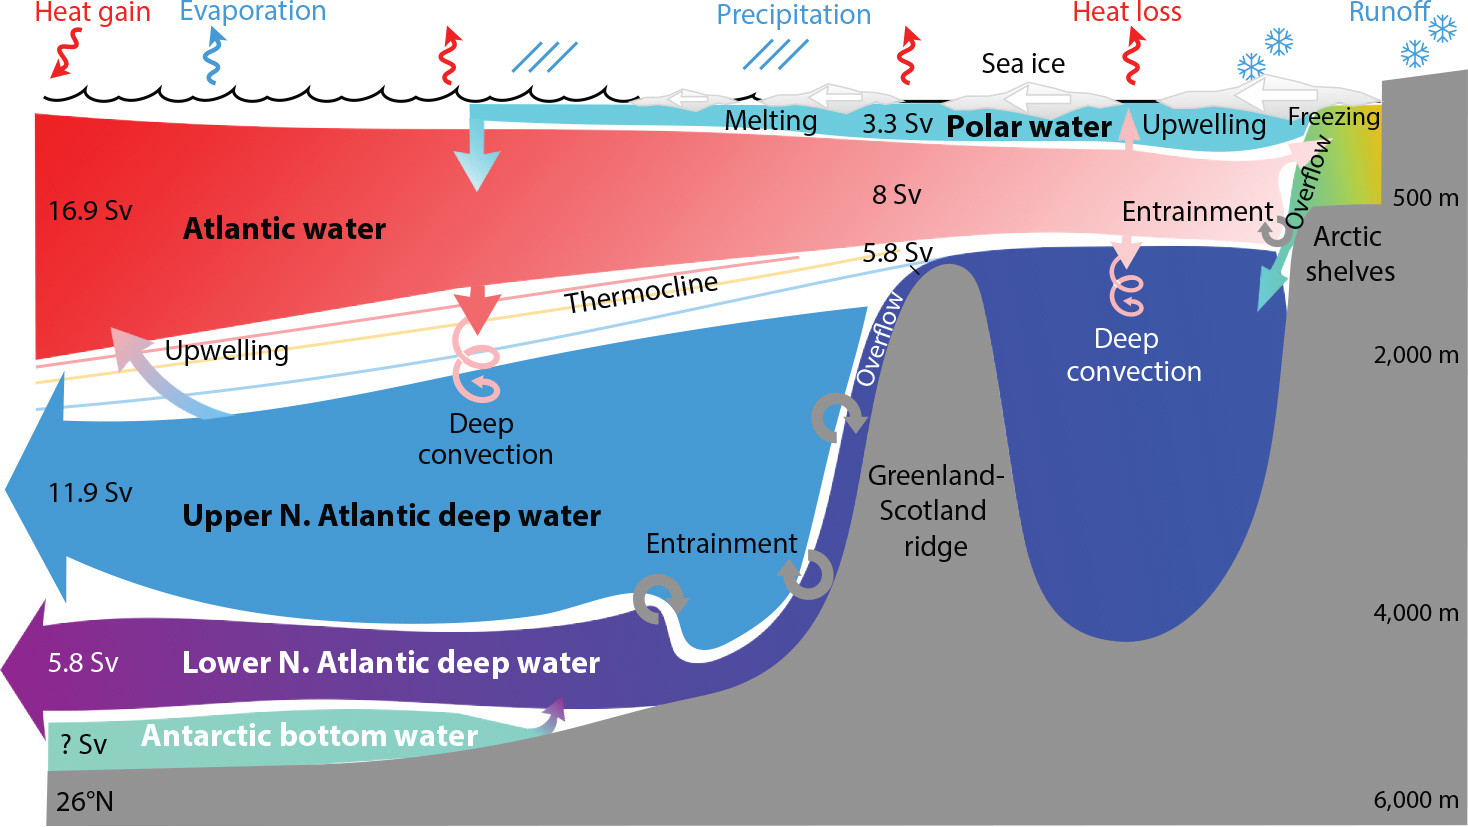
FIGURE 2. Schematic of the overturning circulation in the North Atlantic and Arctic Mediterranean. Transports at 26°N are from the RAPID array (Frajka-Williams et al., 2021), except for the Antarctic bottom water value, which is uncertain but small. Transports at the Greenland-Scotland Ridge are taken from Østerhus et al. (2019). The Polar Water value includes the Canadian Arctic Archipelago throughflow, and the net flow across the Greenland-Scotland Ridge includes flow from the Pacific through Bering Strait, runoff, and precipitation minus evaporation. > High res figure
|
Although how much of the water that flows into the Nordic Seas is derived from the subtropics is not known in detail, nor are the mechanisms that control it, a picture has emerged of the ENA as a “switchyard” (region of changing currents) for the waters flowing into the Nordic Seas (Figure 3). Hátún et al. (2005) argue that the strength and the extent of the subpolar gyre influence the waters flowing over the GSR. Cool and fresh subpolar waters dominate the ENA when the subpolar gyre is strong and expansive, usually during periods of persistent positive North Atlantic Oscillation (NAO, a prominent pattern of atmospheric variability in the westerly winds and storm track over the North Atlantic Ocean). When the subpolar gyre is weak and contracted (during negative phases of the NAO), warm and salty subtropical waters flood the ENA, increasing temperature and salinity in the Atlantic Water (AW) flowing into the Nordic Seas. Koul et al. (2020) confirm this picture by using a Lagrangian particle tracking method to study the sources of the waters in the ENA, concluding that between 50% and 70% are derived from the subtropics, depending on the state of the subpolar gyre. Other patterns of variability have been identified as important controls on the transport across the GSR, in particular, the East Atlantic Pattern (Heuzé and Årthun, 2019).

FIGURE 3. Interannual variations in the eastern North Atlantic Ocean (ENA) modulated by the North Atlantic Current flow into the Nordic Seas. Colors show annual-average surface salinity (from EN4; Good et al., 2013) for 2008 and 2016, which correspond to saline and fresh years in the ENA. Contours show the average absolute dynamic topography (from AVISO) for the preceding two years (2006–2007 and 2014–2015), which correspond to contracted and expanded subpolar gyre states. The contours are from –0.8 to 0.8 m with a spacing of 0.1 m and are smoothed with a Gaussian filter with scale 400 km. The red contours (–0.3, –0.2, and –0.1 m) depict the path of the North Atlantic Current. > High res figure
|
Once in the Norwegian Sea, AW is transported northward with the Norwegian Current. Part of this flow recirculates in the Nordic Seas while the rest flows into the Arctic Ocean through the Barents Sea Opening (2.3 Sv) and Fram Strait (2.6 Sv; estimated from Figure 4 in Tsubouchi et al., 2018). What controls the transport of AW into the Barents Sea, and into the Arctic Ocean through Fram Strait is imperfectly known, but the role of regional wind stress patterns has emerged as a leading driver (Lien et al., 2013; Chafik et al., 2015).
In the Nordic Seas and the Arctic Ocean, AW is subjected to intense surface cooling and freshening that transforms it into other forms (Figure 2). In the Greenland Sea, the recirculating salty AW is cooled by the atmosphere, leading to deep overturning that can cool the water column down to several kilometers’ depth. How much this process contributes to the overflow waters is still a matter of debate (R. Zhang and Thomas, 2021). The water mass transformations in the Arctic Ocean are often described in the context of the double-estuarine model of Arctic overturning (Rudels, 2010; Eldevik and Nilsen, 2013; Haine, 2021; see also Rudels and Carmack, 2022, in this issue). According to this model, part of the AW inflow is cooled by heat loss to the atmosphere and freshened by freshwater inflow through Bering Strait, sea ice melt, precipitation, and runoff, generating a relatively buoyant water mass called Polar Water. This water flows towards the SPNA through Fram Strait and Denmark Strait as the East Greenland Current, and also through the Canadian Arctic Archipelago (CAA) and Davis Strait. Another fraction of AW is cooled and mixed with dense and salty waters from the extensive and shallow shelf regions, where sea ice formation leads to brine rejection and salinification (Rudels and Quadfasel, 1991). A third transformation product of AW interacting with the atmosphere is sea ice, which is exported to the SPNA with the Polar Water.
The dense water masses formed in the Arctic Ocean flow southward through Fram Strait, which is the only deep connection between the Arctic Ocean and the Nordic Seas. There they mix with water masses formed in the Greenland Sea and cross the GSR into the SPNA as distinctive overflows known as Denmark Strait Overflow (DSOW) and Iceland Strait Overflow Water (ISOW; Østerhus et al., 2019). Upon entering the SPNA, these overflow waters mix with ambient waters to form lower North Atlantic Deep Water (NADW), which flows southward as the deepest branch of the AMOC. The slightly-less-dense ambient waters, called upper NADW, are formed in the Labrador and Irminger Seas by deep convection and are also exported south in the deep branch of the AMOC (Figure 2).
Although the pathways and transport estimates are reasonably well constrained based on data from the monitoring efforts, details of the processes that lead to water mass transformations, overflows, and entrainment are still poorly understood. They depend on small-scale and often episodic processes that are extremely difficult to observe, especially given their propensity to occur during the harsh conditions of polar winter. They are also challenging to capture in numerical models because the small spatial scales noted defy explicit representation, necessitating the use of parameterizations (Hewitt et al., 2022).
Impacts of the AMOC on the Arctic
The RAPID/MOCHA and OSNAP arrays have shown that the AMOC varies on timescales from seasonal to at least decadal. On interannual timescales, most spectacularly, RAPID recorded a significant weakening of the AMOC at 26.5°N in the winter of 2009/2010. On decadal timescales, the AMOC at this latitude appears to have undergone a weakening of its mean strength by about 2.5 Sv after the first four years of monitoring and appears to have been steady since then (Smeed et al., 2018; Moat et al., 2020). It is unclear, however, whether this weakening is part of a multidecadal variation or signifies a gradual decline. Indeed, climate models almost unanimously project a weakening of the AMOC in the twenty-first century in response to anthropogenic forcing (Cheng et al., 2013; Weijer et al., 2020), and some studies claim that such a weakening is already in progress (Caesar et al., 2018, 2021; but see Kilbourne et al., 2022, for an alternate view). On the other hand, the weakening could be part of multidecadal variability, as climate models clearly demonstrate that the AMOC can display internal variability on multidecadal timescales. This could be due to a slow (“reddening”) response to atmospheric variability, most notably that associated with the NAO (Delworth et al., 2017). Other studies point to the possibility of the resonant excitation of an internal mode of ocean dynamics (Dijkstra et al., 2006). Unfortunately, models simulate a wide range of AMOC variability on these timescales and no consensus has yet emerged (Muir and Fedorov, 2017).
Given that changes in AMOC strength directly impact northward heat transport, both in the subtropical (Johns et al., 2011) and subpolar regions (Lozier et al., 2019), how does AMOC variability and trends at lower latitudes impact heat transport toward the Arctic? Several studies have tried to address this question, using different approaches. Bryden et al. (2020), for instance, analyzed the consequences of the AMOC slowdown after 2009 and concluded that its weakened state has indeed led to a reduction in meridional heat transport of 0.17 PW (about 15%) in northward heat transport across 26.5°N. They demonstrate that this has led to significant cooling of the eastern subpolar gyre, extending all the way to Iceland. However, whether this has led to reduced heat flux into the Nordic Seas is still a matter of debate. Rossby et al. (2020) analyzed a century’s worth of hydrographic observations and although they found no evidence for a long-term trend, they did find that northward volume and heat transport across the GSR indeed started to decline around 2010. On the other hand, Tsubouchi et al. (2021) conclude that heat transport into the Nordic Seas is decoupled from the mid-latitude AMOC. They estimate ocean heat transport across the GSR for the period 1993–2016 using a box inverse method and argue that a sudden increase in poleward heat transport after 2001 is inconsistent with the apparent weakening of the AMOC at 26.5°N since 2004. Longer time series of AMOC strength and heat transport are needed to settle this debate.
Inflow of warm waters of Atlantic origin strongly influence climate conditions, especially in the Barents and Kara Seas (e.g., Smedsrud et al., 2013; Asbjørnsen et al., 2019). Indeed, the well-publicized “Atlantification” of the Arctic (Polyakov et al., 2017), which describes increased presence and shoaling of AW in the Eurasian Basin, appears to be consistent with this process. Atlantification is associated with weakening upper-ocean stratification, increased upper-ocean current speeds and ocean heat loss, and less sea ice in the Eurasian Basin (Polyakov et al., 2020b,c). Atlantification may also cause biogeochemical changes in this area (Polyakov et al., 2020a). Still, it remains unclear how anomalies in the northern Nordic Seas connect to AMOC variability at lower latitudes. Temperature anomalies have been traced back from Svalbard to the SPNA in both satellite data (Chepurin and Carton 2012) and reanalysis products (Figure 4; Årthun et al., 2017), as well as in climate models (Årthun and Eldevik, 2016). The propagation of sea surface temperature (SST) anomalies from the Grand Banks off Newfoundland to Svalbard takes about a decade, while sea ice response lags SST anomalies in the Norwegian Sea by roughly three years. Årthun and Eldevik (2016) conclude that the heat content anomalies coming from the SPNA mainly involve changes in circulation rather than temperature, and also point to a decadal timescale for anomalies to reach the Arctic from the subpolar North Atlantic. Based on an analysis of high-resolution climate models, Docquier et al. (2019) confirm the importance of oceanic heat transport (OHT) by AW for sea ice conditions in the Arctic, but caution that the OHT-sea ice relationship is weaker for OHT at lower latitudes.
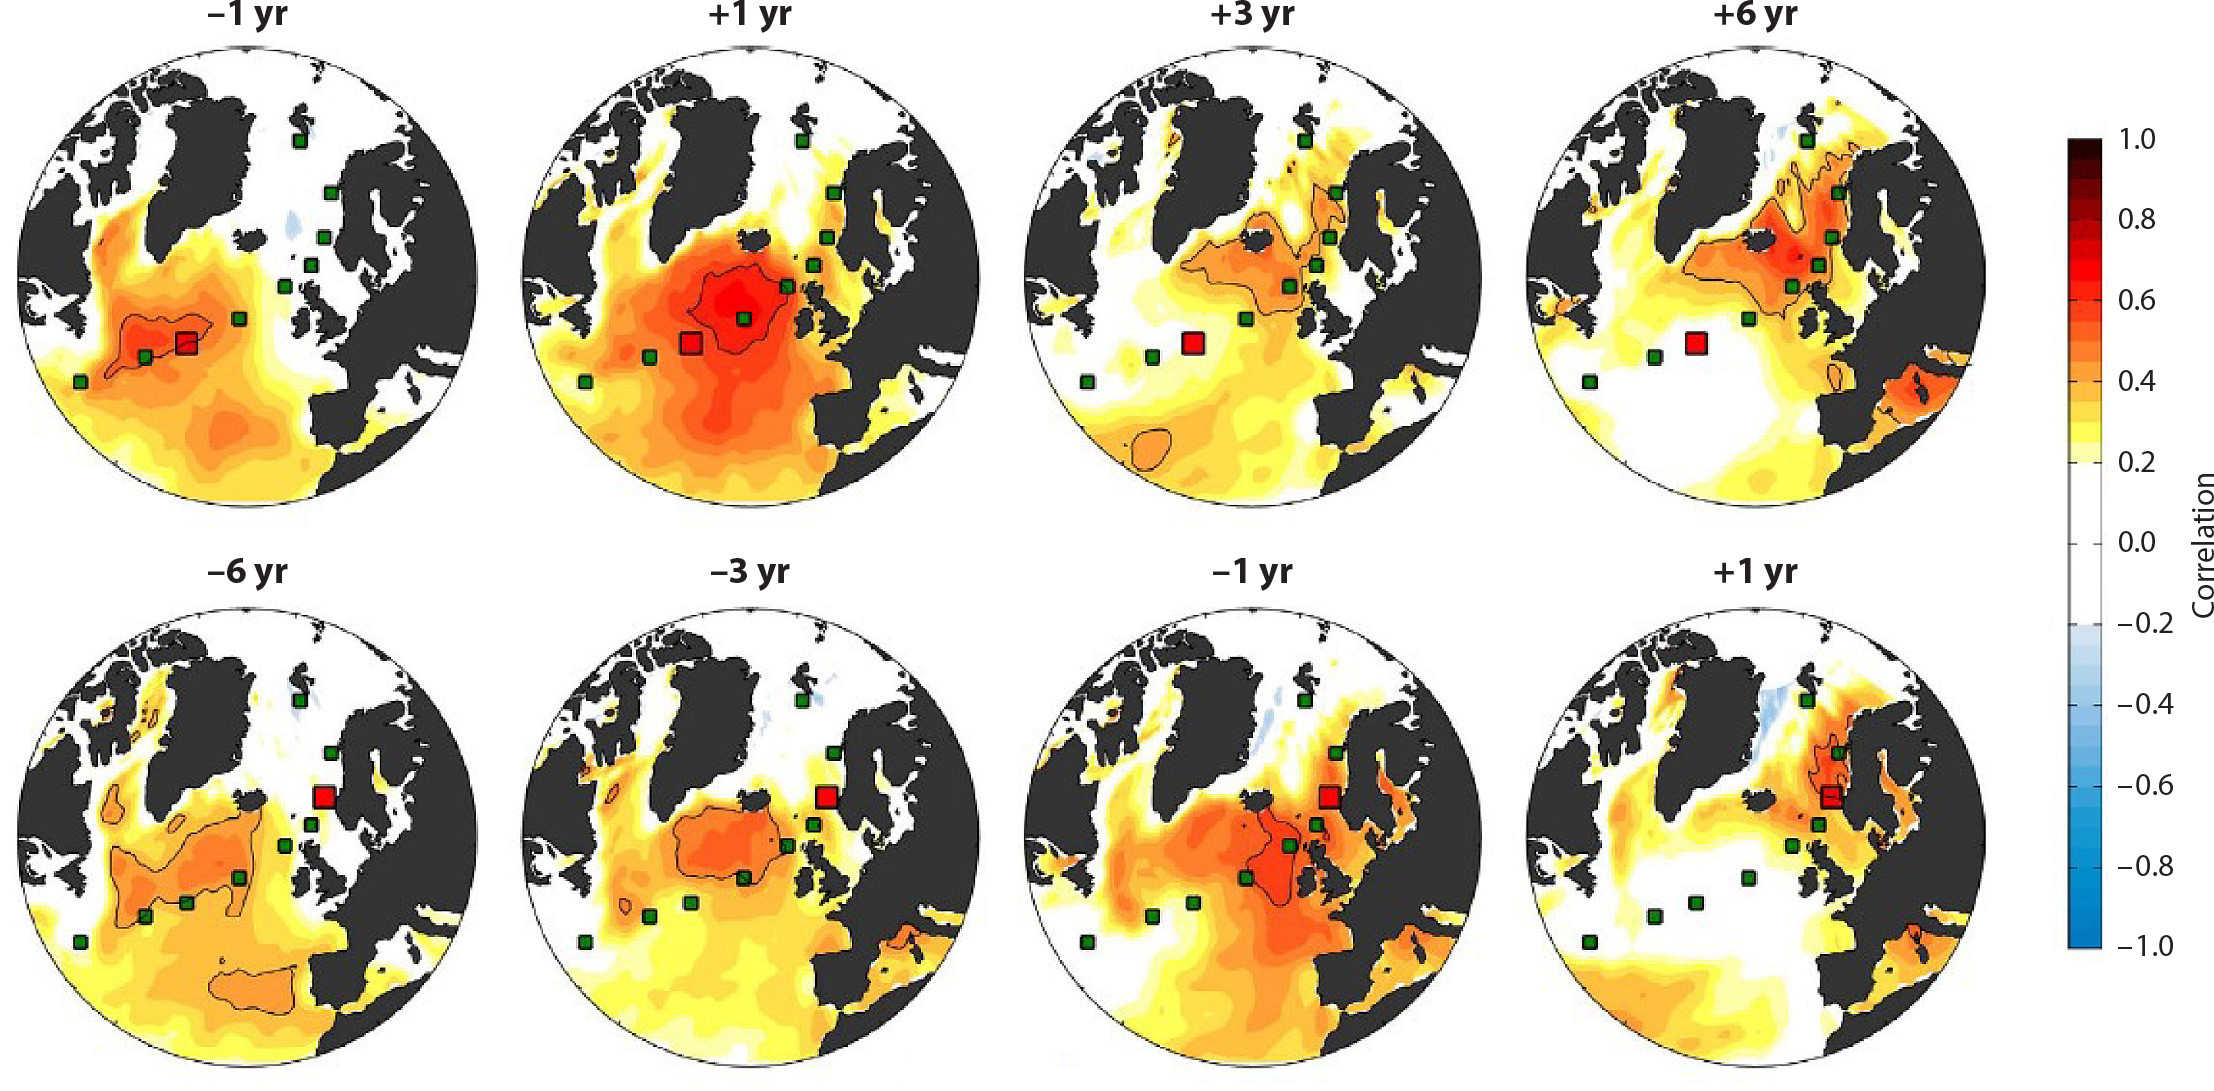
FIGURE 4. Coherent propagation of sea surface temperature (SST) anomalies from the subpolar North Atlantic (SPNA) to the Barents Sea. Shading shows lagged correlations between SST throughout the SPNA and Nordic Seas, and SST at two select stations, indicated by red squares (SST from the Hadley Centre SST product; Rayner et al., 2003). The upper row shows data for a station in the subpolar gyre, and the lower row for a station in the Norwegian Sea. Positive (negative) values of the lag means that the SST at the selected station leads (lags) the field. Green squares denote other stations defined in the original paper to track the propagation of SST anomalies. From Årthun et al. (2017), licensed under CC BY. > High res figure
|
It also seems that the direct link between AMOC strength and heat supply to the Arctic breaks down under increased greenhouse forcing. In particular, climate models simulating future scenarios almost unanimously project a decrease in the strength of the AMOC (Figure 5), but often an increase in OHT into the Arctic (e.g., Hwang et al., 2011). Models agree that this is a consequence of a reduction in ocean heat loss in the Nordic Seas that allows warmer waters to reach the Arctic, in spite of a reduced heat supply from lower latitudes (Nummelin et al., 2017; Oldenburg et al., 2018); in other words, a trade-off between reduced supply of warmer waters is won—at least at Arctic latitudes—by ocean warming (Liu et al., 2020). Some studies also point to a strengthening of the gyre circulation in the Nordic Seas (Lique and Thomas, 2018).
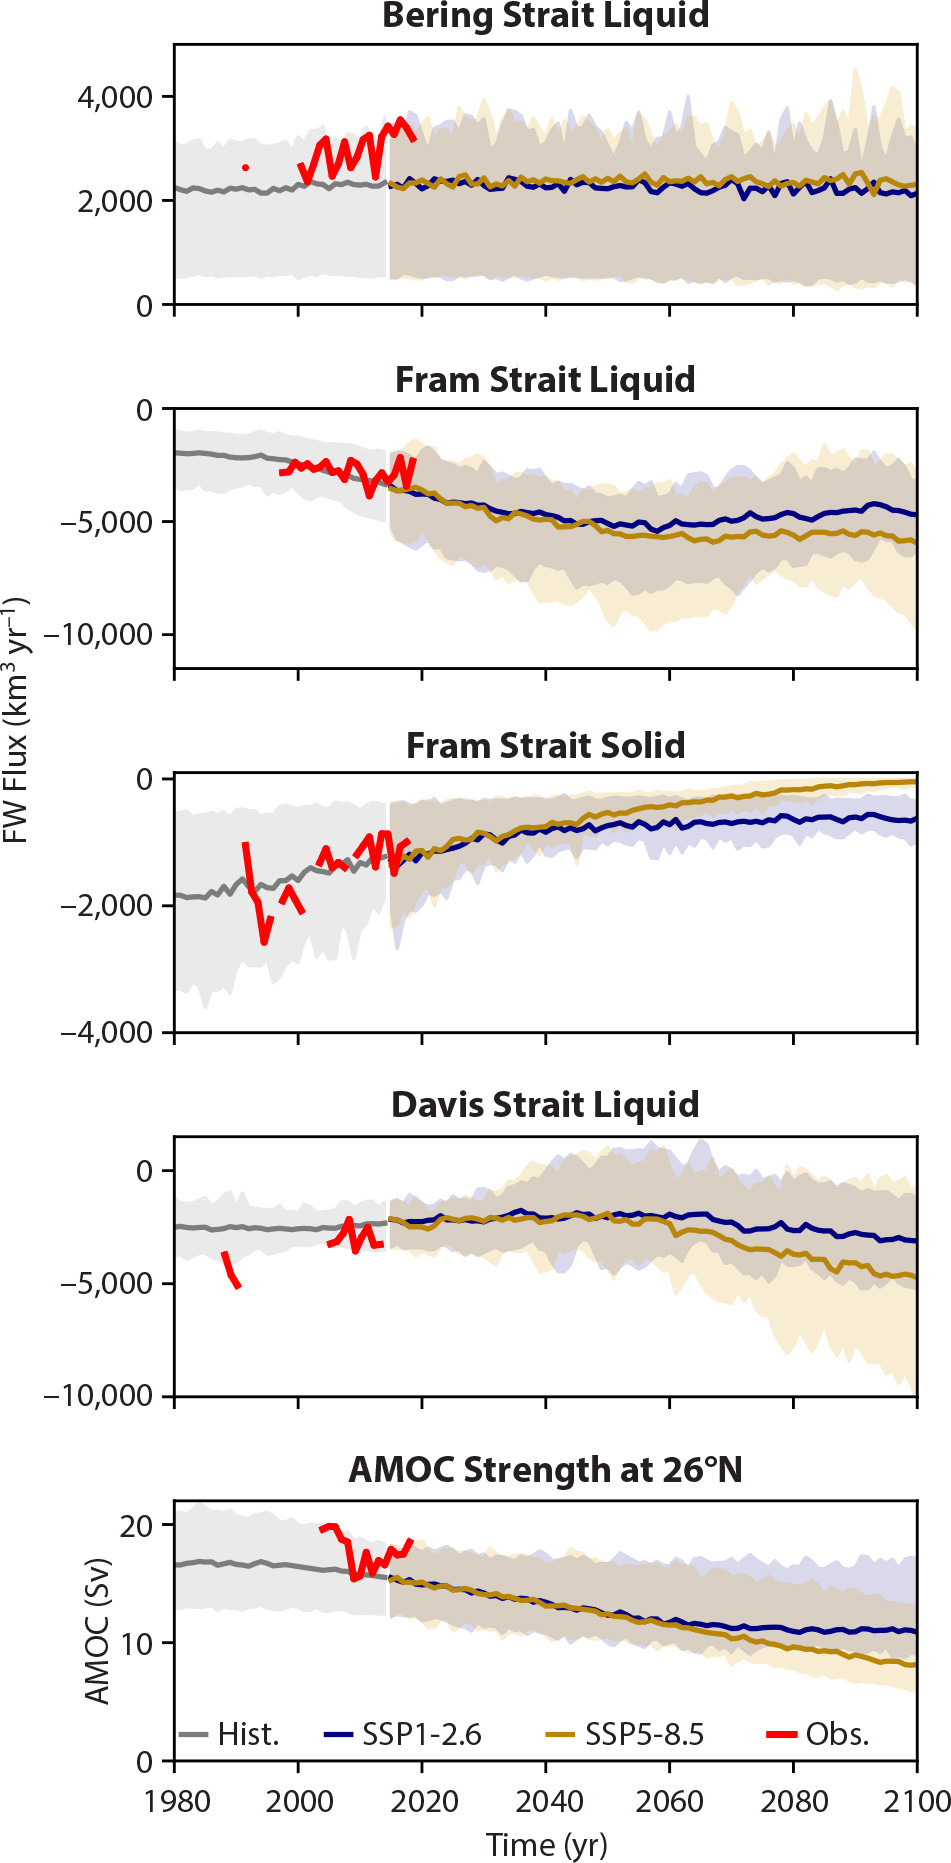
FIGURE 5. Arctic freshwater (FW) fluxes and 26°N Atlantic Meridional Overturning Circulation (AMOC) strength from CMIP6 models and observations. The CMIP6 liquid and solid freshwater fluxes across key Arctic gateways (top four panels; see Figure 1 for locations) are taken from Zanowski et al. (2021). Minor fluxes from other gateways are not shown. The corresponding CMIP6 AMOC strengths (bottom panel) are taken from Weijer et al. (2020). In each case, historical CMIP6 data, SSP1-2.6, and SSP5-8.5 projections are shown (ensemble spread and ensemble mean with the lines). In each panel, available observations are plotted in red (Curry et al., 2014; de Steur, 2018; Woodgate, 2018; Frajka-Williams et al., 2021; Karpouzoglou et al., 2022; Sumata et al., 2022). Note the different y-axes. > High res figure
|
However, modeling studies suggest other mechanisms may be important. Most of these studies explore the connections between the AMOC and Arctic sea ice using correlation analysis and conclude that mid-latitude AMOC leads Arctic sea ice by just a few years (Mahajan et al., 2011; Day et al., 2012). In addition, several modeling studies report stronger correlations between Arctic sea ice and the Atlantic Multidecadal Oscillation (AMO) than with AMOC (e.g., Day et al., 2012). The AMO is a mode of SST variability in the North Atlantic that is thought to be strongly linked to the AMOC as periods of stronger AMOC are associated with positive SST anomalies in the North Atlantic Ocean and Nordic Seas (Knight et al., 2005; R. Zhang et al., 2019; Fraser and Cunningham, 2021). This suggests that an alternative mode of AMOC influence on the Arctic may be through atmospheric teleconnections, in particular, in response to the AMO.
Impacts of the Arctic on the AMOC
As discussed in the previous sections, water mass transformations in the Nordic Seas and the Arctic Ocean are key processes that feed the dense lower limb of the AMOC. Consequently, interruptions in these processes can have far-reaching consequences. One intriguing possibility is a potential heat crisis in the Arctic that would shut down the shallow estuarine cell. Based on simple budget calculations of the Arctic double-estuarine model, Haine (2021) argues that under certain conditions the double-estuarine model can no longer satisfy the heat budget of the Arctic Ocean. Both increased heat input from AW and increased stratification from enhanced precipitation could push the Arctic toward such a heat crisis. This scenario may be consistent with Atlantification. Similarly, the idea that the AMOC in a warming climate reaches further into the Arctic Ocean was already noted by Bitz et al. (2006), and a northward shift of the regions of deep convection was anticipated by Lique and Thomas (2018). How this transition would affect the volume and properties of the deep overflow waters that feed into the deep branch of the AMOC at lower latitudes is not known at present.
Observational studies (Moore et al., 2015; Våge et al. 2018) have hinted that a retreating marginal ice zone in the Greenland and Iceland Seas may have consequences for deep water formation in the Nordic Seas. However, the water mass patterns that feed into the DSOW from the Nordic Seas and the processes behind them are complex. Indeed, a recent modeling study by Wu et al. (2021) paints a complicated picture in which the effects of internal variability in sea ice coverage are teased out from the effects of changes in sea ice, atmospheric-ocean fluxes, and ocean stratification due to anthropogenic forcing. The study shows that, in a warming climate, deep convection is reduced in the Greenland Sea gyre because of a decreased temperature difference between the ocean surface and the atmosphere above it, and because of increased ocean stratification. On the other hand, convection is enhanced within the East Greenland Current because of the retreating sea ice edge, with a possible impact on Denmark Strait waters directly downstream. Therefore, a shift in where deep water is created in the Nordic Seas under changing climate conditions may impact the AMOC in subtle but critical ways that require additional investigation in future studies.
Several sources and reservoirs of Arctic freshwater that are releasing more freshwater in a warming climate can affect the AMOC by freshening surface waters in the SPNA, Nordic Seas, and Arctic Ocean and thereby weakening deep convection and upper NADW formation (Figure 2; Carmack et al., 2016; see Figure 5 for key freshwater gateway fluxes from climate models and observations). First is the source of freshwater from the atmosphere, via precipitation and runoff, which is projected to increase in the twenty-first century as the hydrological cycle accelerates (Haine et al., 2015). Second is the freshwater flux to the Arctic Ocean through Bering Strait, which has been increasing in recent years (Woodgate, 2018; Figure 5).
Third is the Beaufort Gyre, which switches between a cyclonic and anticyclonic circulation state on a decadal timescale, thereby releasing and accumulating freshwater (Proshutinsky et al., 2015). The Beaufort Gyre has been in a persistent anticyclonic state since 1997, resulting in an accumulation of 6,400 km3 of liquid freshwater from 2003 to 2018 alone (the period of high-quality oceanographic observations; Proshutinsky et al., 2019). There has been an associated increase in Beaufort Gyre stratification, contrasting with the decrease in Eurasian Basin stratification due to Atlantification (Hordoir et al., 2022). J. Zhang et al. (2021) studied the potential impacts of releasing this freshwater by looking at past analogs of freshwater accumulation and release episodes by the Beaufort Gyre. By comparing previous periods of rapid freshwater release (1983–1995) and accumulation (1997–2008), they found that the Beaufort Gyre freshwater release, equivalent to about 0.02 Sv, comparable to current input from the Greenland Ice Sheet (GrIS; Böning et al., 2016), has the potential to lower salinities in the Labrador Sea by as much as 0.4. Indeed, climate models project increasing freshwater liquid fluxes through Fram and Davis Straits (Figure 5).
Fourth is the GrIS, which contains almost 3 million cubic kilometers of freshwater (Frajka-Williams et al., 2016; see also Wouters and Sasgen, 2022, in this issue, and Briner, 2022, in this issue). A recent assessment indicates that by 2016 the Greenland Ice Sheet and surrounding land ice had lost roughly 6,300 km3 of ice, and that the annual rate of freshwater discharge is equivalent to 0.04 Sv (Bamber et al., 2018), providing an important source of freshwater to the ocean. Large uncertainty exists about how the GrIS freshwater leaves the fjords and coastal ocean. Nevertheless, when Böning et al. (2016) studied the potential impacts of GrIS freshwater release in an eddy-resolving ocean model, they concluded that it had not yet significantly impacted the AMOC, but that a slowdown is inevitable as GrIS melting continues to accelerate.
One intriguing process through which the Arctic may influence the AMOC is through a reduction in sea ice cover (seen in Figure 5 as a decrease in Fram Strait solid freshwater flux). In particular, Sévellec et al. (2017) argue that a reduction in sea ice exposes more ocean to radiative warming (an effect known as the ice-albedo feedback) that increases the buoyancy of the Arctic surface waters. Once these warmer waters reach the SPNA, they may lead to a suppression of deep convection and a weakening of the AMOC. Similarly, changes in the seasonal cycle of sea ice might also have an effect on the buoyancy of the Arctic surface waters that are exported to the SPNA or Nordic Seas (Liu et al., 2019; Liu and Fedorov, 2021).
Challenges and Opportunities
In the past decade, significant progress has been made in understanding Arctic-AMOC interactions. This understanding has been driven by observing and modeling advances such as the OSNAP array (Lozier et al., 2019), the Argo network (Jayne et al., 2017), new generations of coupled climate models (Fox-Kemper et al., 2019), very high-resolution ocean circulation models (Wang et al., 2018; Haine et al., 2021), and improved conceptual models that only include essential components of the Arctic and AMOC (Haine, 2021). The maturation of these capabilities and technologies are carrying us toward another phase of discovery.
For example, ocean models that are referred to as “eddy-resolving” (often using a spatial resolution of about 10 km) do not resolve the Arctic Ocean Rossby radius of deformation (1–15 km; Nurser and Bacon, 2014). Continuing improvements in computational capabilities (supercomputers), approaches (architectures), and algorithms (machine learning) are inevitably moving us toward ocean and climate models that will be able to resolve these critical scales in the next decade (Haine et al., 2021). This will allow us to resolve more of the small-scale processes critical for the large-scale Arctic Ocean and sea ice system and its connection to lower latitudes. It is hoped that the gradual move toward explicitly resolving more and more critical processes will reduce dependency on parameterizations as well as the biases that still plague representation of the Arctic in climate models. Important processes include exchanges between the extensive Arctic shelves and the deep interior of the Arctic Ocean (as originally suggested by Aagaard et al., 1981), flow through narrow gateways like the CAA, and overflows (Fox-Kemper et al., 2019; Hewitt et al., 2022). Other processes will continue to require parameterizations into the foreseeable future, for instance, mixing (Fine et al., 2021) and brine rejection (Nguyen et al., 2009). Still, the agreement between freshwater fluxes modeled by the current generation of climate models and observations in Figure 5 is encouraging.
Another promising direction is the combination of models and observations. Data-assimilation approaches are being developed that allow ocean models to be initialized from states that more faithfully represent the real system, reducing biases. These approaches yield state estimates that use model dynamics to fill in data gaps to provide a consistent representation of the historical and current ocean and sea ice state (Schweiger et al., 2011; Nguyen et al., 2021).
Longer time series collected by existing monitoring arrays (Figure 5) will help us improve our understanding in the course of time, while observational methodologies are becoming more mature (Lee et al., 2019). Examples are Ice-Tethered Profilers, which are “upside-down” moorings that hang below the sea ice (Toole et al., 2011), and Argo floats that can avoid sea ice (see Lee et al., 2022, in this issue for a discussion of emerging technologies for ocean observing in the Arctic). All these developments are geared toward gaining a better understanding of the Arctic system and its interactions with the AMOC. Understanding these relationships and accurately modeling them are critical for predicting the future of the Arctic, the AMOC, and the rest of the climate system.
Acknowledgments
WW, MV, and PK were supported by the HiLAT-RASM project, funded by the Regional and Global Model Analysis component of the Earth and Environmental System Modeling program of the US Department of Energy’s Office of Science. PK was also supported by the Center for Nonlinear Studies at Los Alamos National Laboratory. TH and AS were supported by NASA award 80NSSC20K0823. WC is partially funded by the Cooperative Institute for Climate, Ocean, and Ecosystem Studies (CICOES) under NOAA Cooperative Agreement NA20OAR4320271; this publication is CICOES Contribution No. 2022-1221 and PMEL contribution 5411. Jiaxu Zhang and Léon Chafik provided helpful comments. Hannah Zanowski, Thodoris Karpouzoglou, Hiroshi Sumata, Laura de Steur, and Rebecca Woodgate kindly provided data and code to make Figure 5.
We thank the World Climate Research Programme for coordinating CMIP6, the climate modeling groups for producing and making available their model output, the Earth System Grid Federation (ESGF) for archiving the data and providing access, and the multiple funding agencies that support CMIP6 and ESGF. CMIP6 model output can be retrieved from https://esgf-node.llnl.gov/search/cmip6/.
The SSALTO/DUACS AVISO altimeter products were produced and distributed by the Copernicus Marine and Environment Monitoring Service (https://marine.copernicus.eu/). The RAPID AMOC project is funded by the Natural Environment Research Council, and the data are freely available from https://rapid.ac.uk/rapidmoc/. EN.4.2.2 data were obtained from https://www.metoffice.gov.uk/hadobs/en4/ and are © British Crown Copyright, Met Office, 2021.

