Introduction
Accumulations of anthropogenic CO2 in Earth’s atmosphere and ocean pose a major threat to global climate and society (Friedlingstein et al., 2020, 2022). The crucial role of the ocean in attenuating the increase in atmospheric CO2, and thus global warming, is related to the excess atmospheric CO2 that is absorbed by the ocean as dissolved CO2, which alters the seawater carbonate system (Zeebe and Wolf-Gladrow, 2001). Increased CO2 uptake causes a decline in pH, shoaling of the CaCO3 saturation state horizon (Ω), and reduced carbonate ion concentration in a process known as ocean acidification (OA; Feely et al., 2004, and 2023, in this issue). Among global ocean change processes, OA represents one of the greatest threats to ocean ecosystems, marine-related socioeconomic activities (IPCC, 2022), and biogeochemical processes, with significant repercussions for the ocean carbon sink, because it alters transfer of carbon from the surface to the ocean depths (Feely et al., 2002; Lee and Feely, 2021).
The major mechanisms of carbon transport in the ocean’s interior include the inorganic solubility pump and the biological pump, within which the carbonate pump is an important transport process that leads to enhanced carbon sequestration on timescales of several centuries to millennia. Pelagic calcifiers, including coccolithophores, foraminifera, and shelled thecosomata (referred to as pteropods), are significant climate regulators (Milliman, 1993; Sarmiento and Gruber, 2006). Through their contributions to CaCO3 export, calcifiers affect the rate, magnitude, and strength of the ocean as a carbon sink and its potential for affecting climate change (Feely et al., 2004; Gehlen et al., 2007). OA impacts the carbonate pump through several major pathways (Figure 1). The OA-induced decrease in Ω increases CaCO3 dissolution, reduces calcification, and reduces the sinking speed of biogenic aggregates. The dissolution of biogenic carbonates at depth leads to decreased availability of CaCO3 ballast material to accelerate sinking velocities of particulate organic carbon (Honjo et al., 2008). To understand the scale of the changes, regional biogeochemical processes should be extrapolated to global scale.
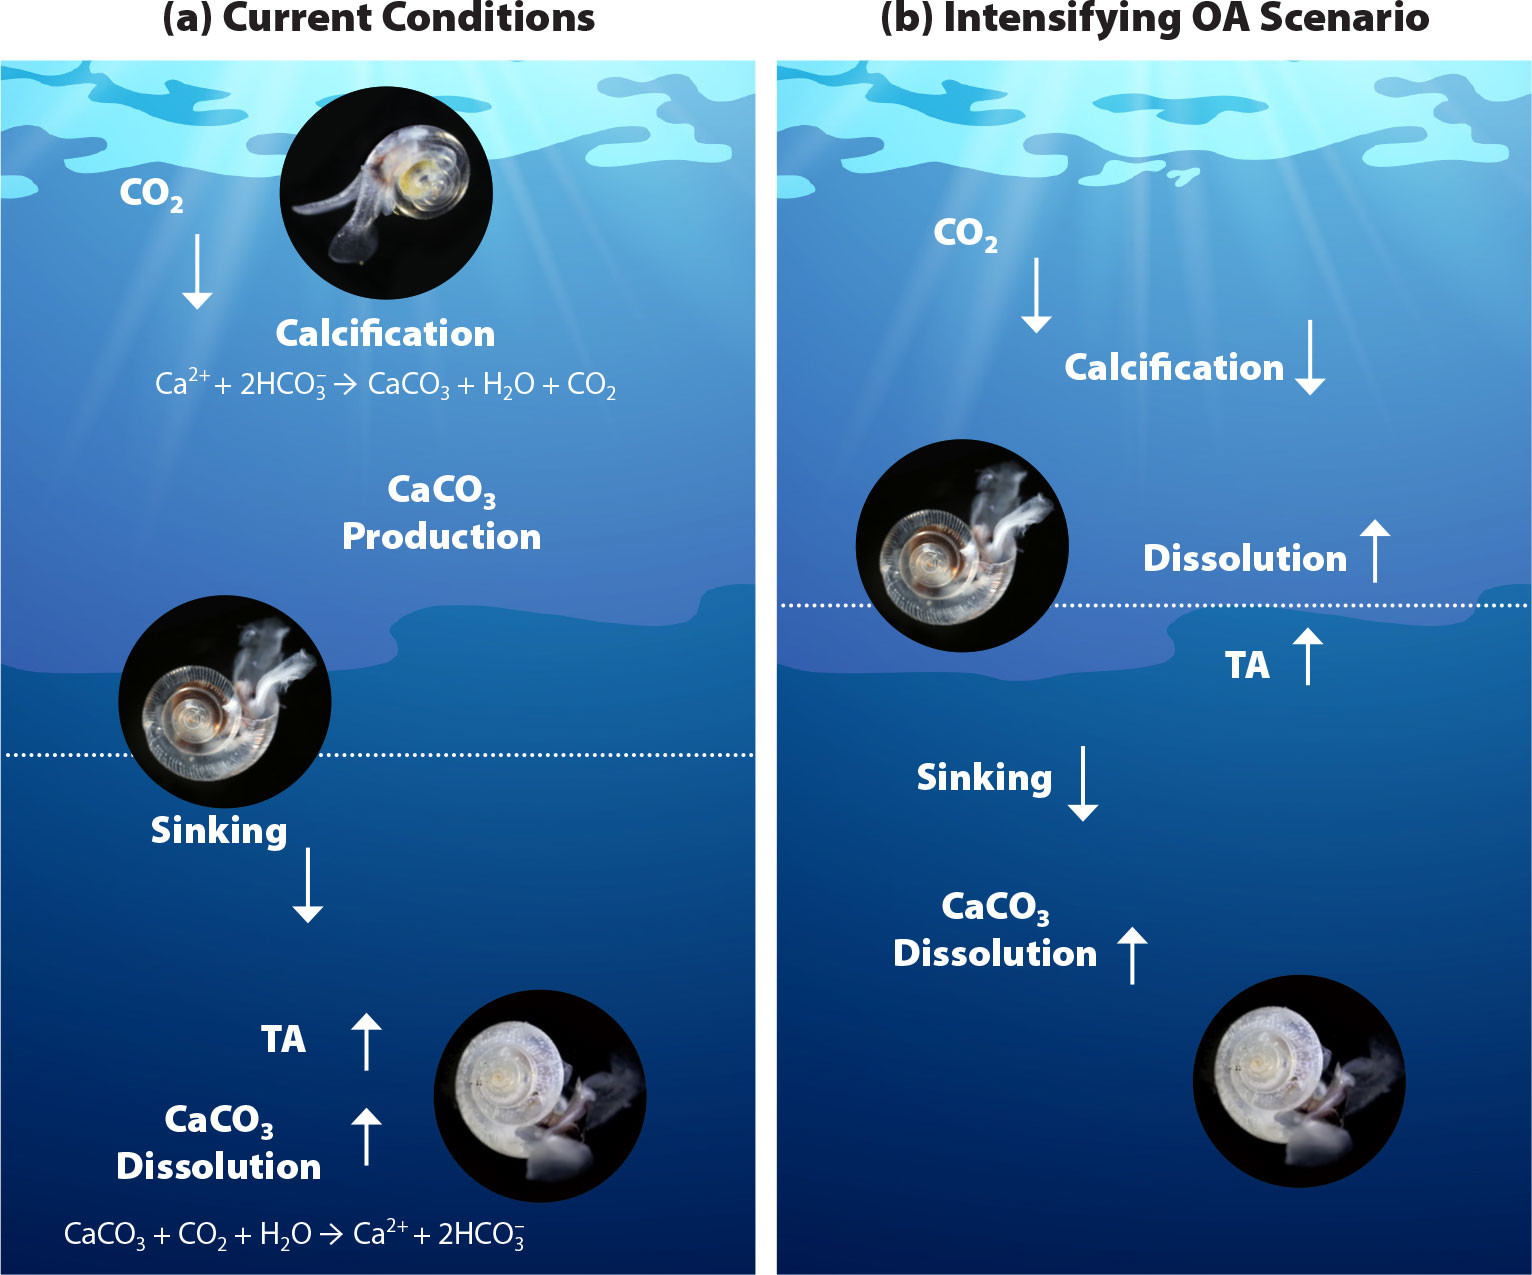
FIGURE 1. Provisional conceptualization of the major processes affecting pteropods under (a) current conditions, and (b) intensifying ocean acidification (OA). Arrows indicate direction, and arrow boldness indicates potential change in magnitude. Only processes relevant to the carbonate pump are shown. The thin horizontal line marks the aragonite saturation horizon, which increases over time due to ocean acidification. TA = Total alkalinity. > High res figure
|
Pteropods are zooplanktonic pelagic calcifiers with ubiquitous biogeographic distribution across the global ocean; their highest biomass occurs in the upper 200 m (Bednaršek et al., 2012a) during their diel vertical migration. They build shells of aragonite, a metastable form of calcium carbonate that is 50% more soluble than calcite (Mucci, 1983), which makes them more sensitive to OA than calcite-shelled organisms (Fabry et al., 2008; Bednaršek et al., 2014b; Manno et al., 2017). Observations and modeling suggest that pteropods contribute significantly more than previously thought to global carbonate export. Bednaršek et al. (2012a) estimated that pteropod contributions range between 20% and 42%, while a modeling study by Buitenhuis et al. (2019) found that pteropods dominate CaCO3 export, ranging between 33% and 89% in the upper 200 m.
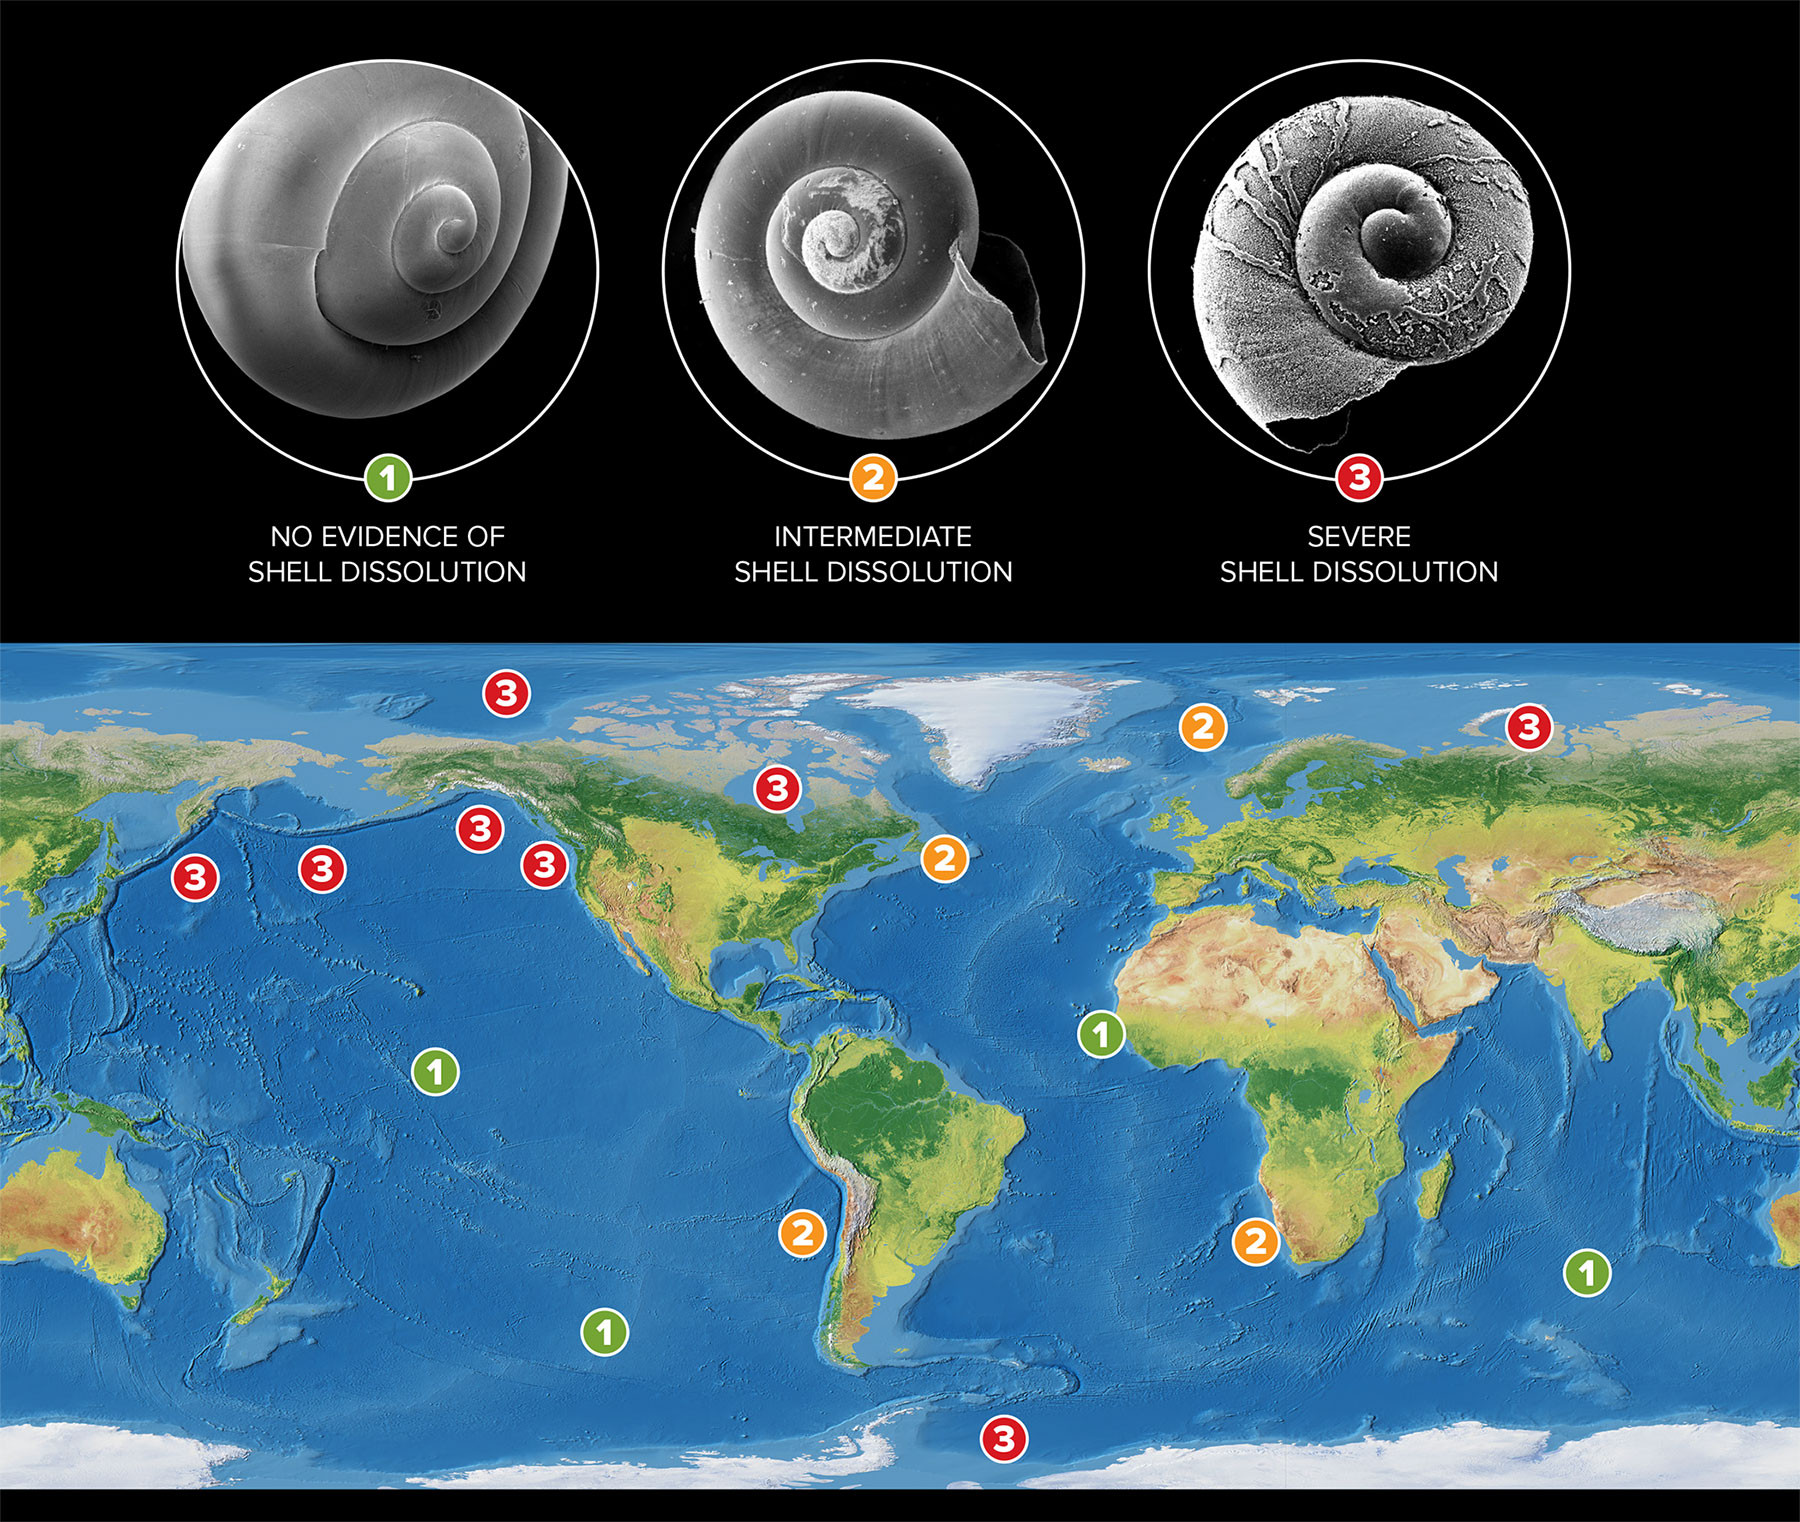
Apart from their biogeochemical role, pteropods are also an important component of the food web because they channel energy through the trophic levels and provide essential food resources for economically important fish. To date, experimental studies have demonstrated significant rate changes in biomineralization responses to reduced aragonite saturation state (Ωar), showing increased shell dissolution and reduced calcification (Lischka et al., 2011; Comeau et al., 2009, 2012; Bednaršek et al., 2014a, 2017a). This is further supported by expert-consensus selected thresholds that delineate the magnitude and duration of OA exposure involved in negative responses (Bednaršek et al., 2019). Research on NOAA Pacific Marine Environmental Laboratory (PMEL) cruises demonstrated that severe shell dissolution was already observable in the sensitive subpolar, polar, and upwelling regions under current conditions (Bednaršek et al., 2012b, 2014b, 2021; Niemi et al., 2021). This makes pteropods one of the most vulnerable groups to OA and a key indicator for OA vulnerability assessment and regional monitoring (Bednaršek et al., 2017b). Such rapid changes in biomineralization processes can have significant biogeochemical implications for carbon export, especially in regions where their biomass is high—the Arctic and Southern Oceans, the subpolar North Pacific, the equatorial Pacific, and the coastal Eastern Boundary Upwelling Systems, particularly the California Current System and the Humboldt Current System (Knecht et al., 2023; Bednaršek et al., 2012a).
Although pteropods are known to be important players in the global carbon budget, there are still a number of uncertainties regarding the drivers, the strength, and the significance of pteropods in the carbonate pump. Our understanding of pteropods’ aragonite response remains limited, as reflected in the lack of their representation in CaCO3 cycle assessments and modeling. Refining our understanding of these processes means developing significantly better parameterizations of critical pteropod responses to OA and their changes across global scales. This paper, which is based on research conducted over the last 12 years as part of PMEL climate and acidification research cruises, summarizes the current status and 35-year trends for the best understood and most observed process of pteropod shell dissolution, which has direct consequences for carbon export and sequestration. By using the quantified sensitivity of biological responses (Bednaršek et al., 2014a,b; Feely et al., 2016), integrated chemical observations, and model outputs, we align the changes in Ωar in the upper 200 m with corresponding changes in shell dissolution and then scale up from regional to global scales. We hypothesize that the greatest changes in shell dissolution, and thus carbon export, will be observed in the areas where the highest pteropod biomass overlaps with the lowest Ωar. Here, we quantify the changes in pteropod shell dissolution, aiming to improve our understanding of biogeochemical processes across both temporal and spatial scales and to provide insights on how they are affected by human-caused climate change. The biological responses to ocean acidification described here address one of PMEL’s overarching missions: to better understand the impacts of climate change and ocean acidification on marine ecosystems.
Methodology
We calculated climatologies of observed Ωar from published observations in the GLODAPv2.2019 observational data set of dissolved inorganic carbon (DIC), total alkalinity (TA), silicate, phosphate, temperature, and salinity. The horizontal resolution is 1°×1°, with 57 depth levels (0–1,500 m) and monthly resolution (12 months). CO2SYS was used in MATLAB to calculate Ωar. Input data for CO2SYS were obtained from the following published climatologies: DIC from Broullón et al. (2020); TA, silicate, and phosphate from Broullón et al. (2019); and WOA-2018 climatologies for temperature (Locarnini et al., 2018) and salinity (Zweng et al., 2018). The average date for observations of DIC and TA in GLODAPv2.2019 used by Broullón et al. (2019, 2020) is the year 2005, with a standard deviation of ± 9 years.
Therefore, our calculated climatologies of observed Ωar represent a mean year of 2005, and the range of years of about 1996–2014 based on the interval of the mean ± standard deviation of the dates when the observed DIC and TA data were collected. The annual average climatology of observed Ωar is estimated as the mean of the monthly average climatologies. Multivariate ENSO Index Version 2 (MEI.v2) was calculated based on the sources described in https://psl.noaa.gov/enso/mei/.
We use monthly output from a hindcast simulation (1984–2019) with a high-resolution Regional Ocean Modeling System (ROMS) model coupled to a biogeochemical/ecosystem model BEC (Marchesiello et al., 2003; Shchepetkin and McWilliams, 2005; Moore et al., 2013; Desmet et al., 2022). The model runs on a telescopic grid covering the Pacific basin and centered on one pole at the US West Coast, which allows mesoscale dynamics at the pole to be fully resolved and basin-wide oceanic and atmospheric teleconnection to be captured (Frischknecht et al., 2018). Ωar is computed offline using the MOCSY 2.0 routine (Orr and Epitalon, 2015) and the constants recommended by Dickson et al. (2007). The model output was validated against Ωar observations from the NOAA Ocean Acidification Program West Coast Cruises and the climatological GLODAPv2 1° × 1° gridded product over the latitudinal gradient of 25°–62°N (Desmet et al., 2022). We further evaluated the skill of hindcast Ωar from 0–200 m compared with observations in GLODAPv2.2022 from 20°S–65°N and found excellent agreement with GLODAPv2.2022 for both the Ωar using the climatology of gridded observations in the global ocean (mean bias = 0.099, RMSE = 0.26, R2 = 0.94, Nash-Sutcliffe Efficiency = 0.93), and the predicted Ωar using the ROMS-BEC model of the northeast Pacific Ocean by Desmet et al. (2022) (mean bias = 0.015, RMSE = 0.33, R2 = 0.91, Nash-Sutcliffe Efficiency = 0.90). In addition, the mean rate of decrease in surface Ωar predicted by the model from 25°S–65°N and 70°–185°W from 1984 to 2019 equals the published mean rate of decrease in global surface Ωar from 1982 to 2020 (i.e., –0.07 per decade; Gregor and Gruber, 2021).
Trends in surface Ωar in the global ocean from 1982 to 2020 were calculated from OceanSODA-ETHZ (Gregor and Gruber, 2021), a gridded data set that was created by extrapolating surface ocean observations of pCO2 from SOCAT (Bakker et al., 2016) and TA from GLODAP (Olsen et al., 2019) using a Geospatial Random Cluster Ensemble Regression (GRaCER) method (Gregor and Gruber, 2021). Gregor and Gruber (2021) reported near-zero negligible biases of calculated carbonate system variables compared with the observed data in GLODAP.
As pteropod biomass is mostly distributed in the upper 200 m (Bednaršek al., 2012a), we have used observational data and model outputs for the upper 200 m to delineate the changes in shell dissolution to Ωar. We relied on previous studies that determined pteropod spatial dominance (Bednaršek et al., 2012a; Knecht et al., 2023). We used the equation on the percent of pteropod individuals with severe shell dissolution = –66.29 × ln (Ωar) + 61.2 from Feely et al. (2016), which relies on two large-scale NOAA-supported West Coast cruise observations (2011 and 2013) of pteropod shell dissolution, previously evaluated for one cruise (in 2011) by Bednaršek et al. (2014b). Shell dissolution was described for the mid-stages (late juvenile and mid adult), referring to the juvenile and adult stages of the pteropod population (Bednaršek et al., 2016).
Results
Status and Trends of Aragonite Saturation State in the Upper 200 m
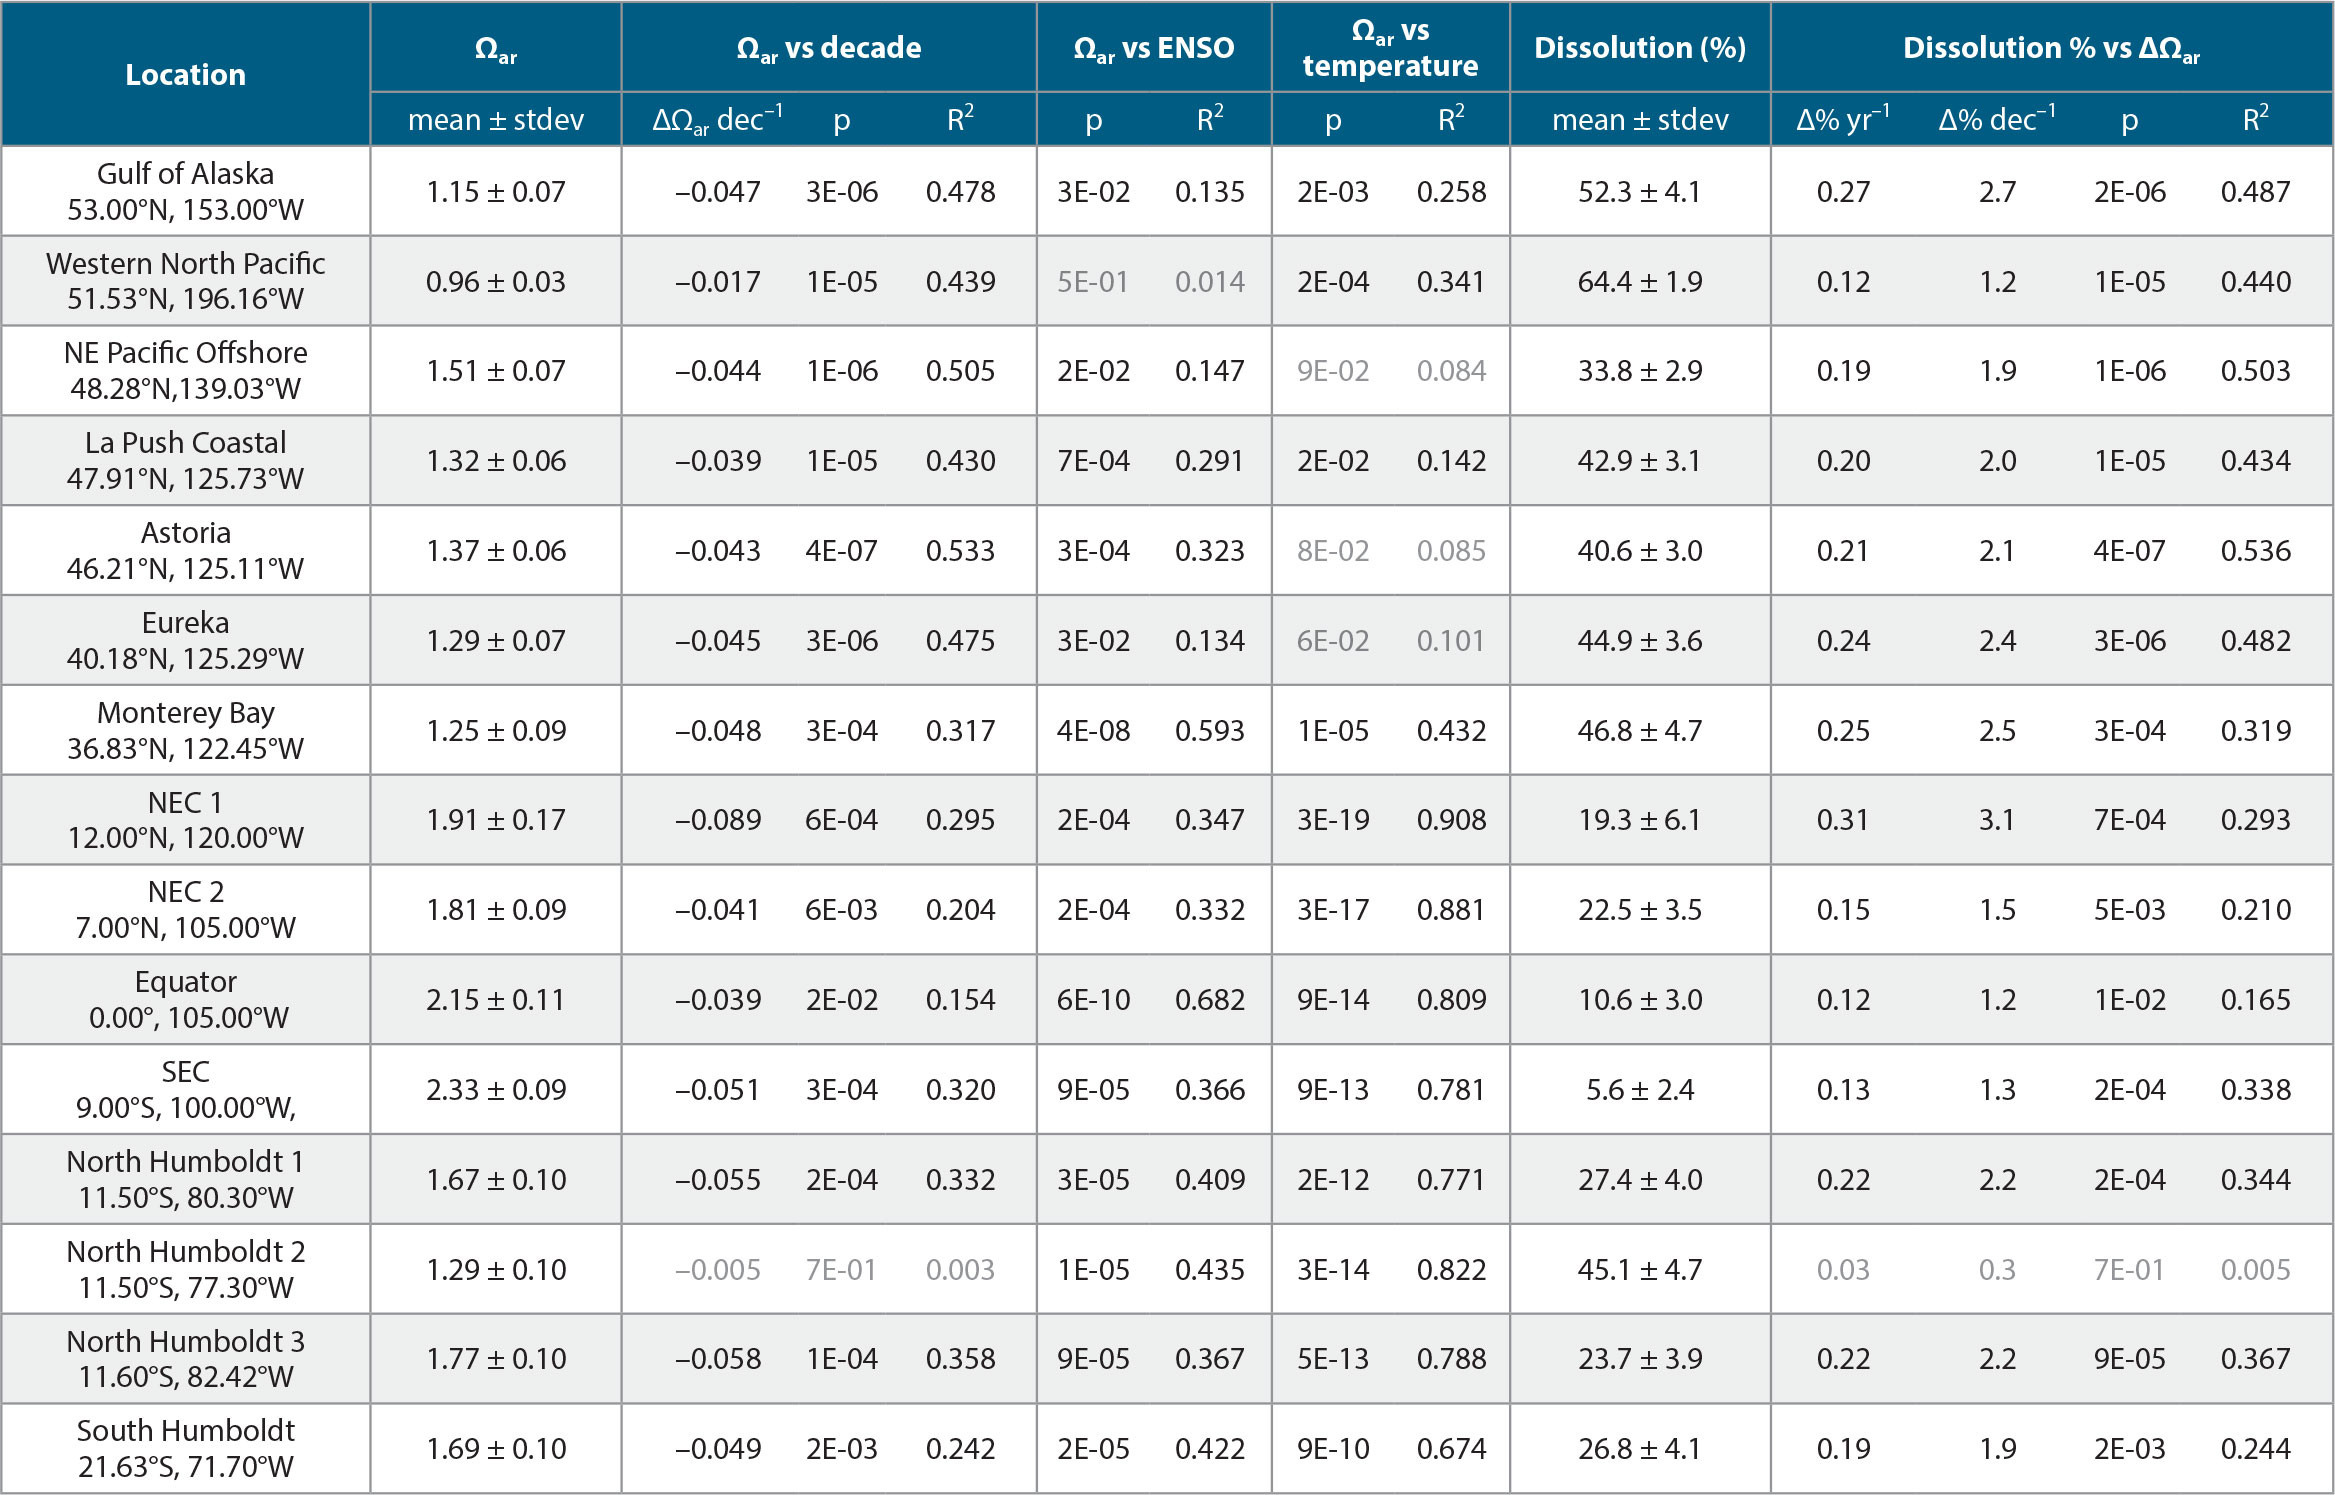
Climatologies based on observational data over the upper 200 m show a very large range of Ωar values across global scales (Figure 2). Some of the lowest Ωar values, which range from 0.95 to 1.5, are observed in the polar regions of the Arctic, including the Kara, Laptev, and Beaufort Seas, and the Arctic Ocean, as well as in the subpolar regions of the North Pacific between 45°N and 60°N, particularly the Okhotsk Sea, the Bering Sea, and the Gulf of Alaska, and in the Southern Ocean (Figures 2a and 3a,c). In the upwelling systems characterized by lower Ωar, particularly the California and Humboldt Current Systems, the annual Ωar values in closest coastal regions drop down to 1.2 and 1.5, respectively (Figure 1). Other locations of lower Ωar are the North and South Equatorial Current (NEC and SEC) regions between 5°N and 20°N and 0° and 15°S, where 0–200 m annual Ωar values are as low as 1.5–2 Ωar, thus exhibiting strong correlation with the temperature and the ENSO index, particularly in the equatorial Pacific, Monterey Bay, and Humboldt Current regions (Table 1).
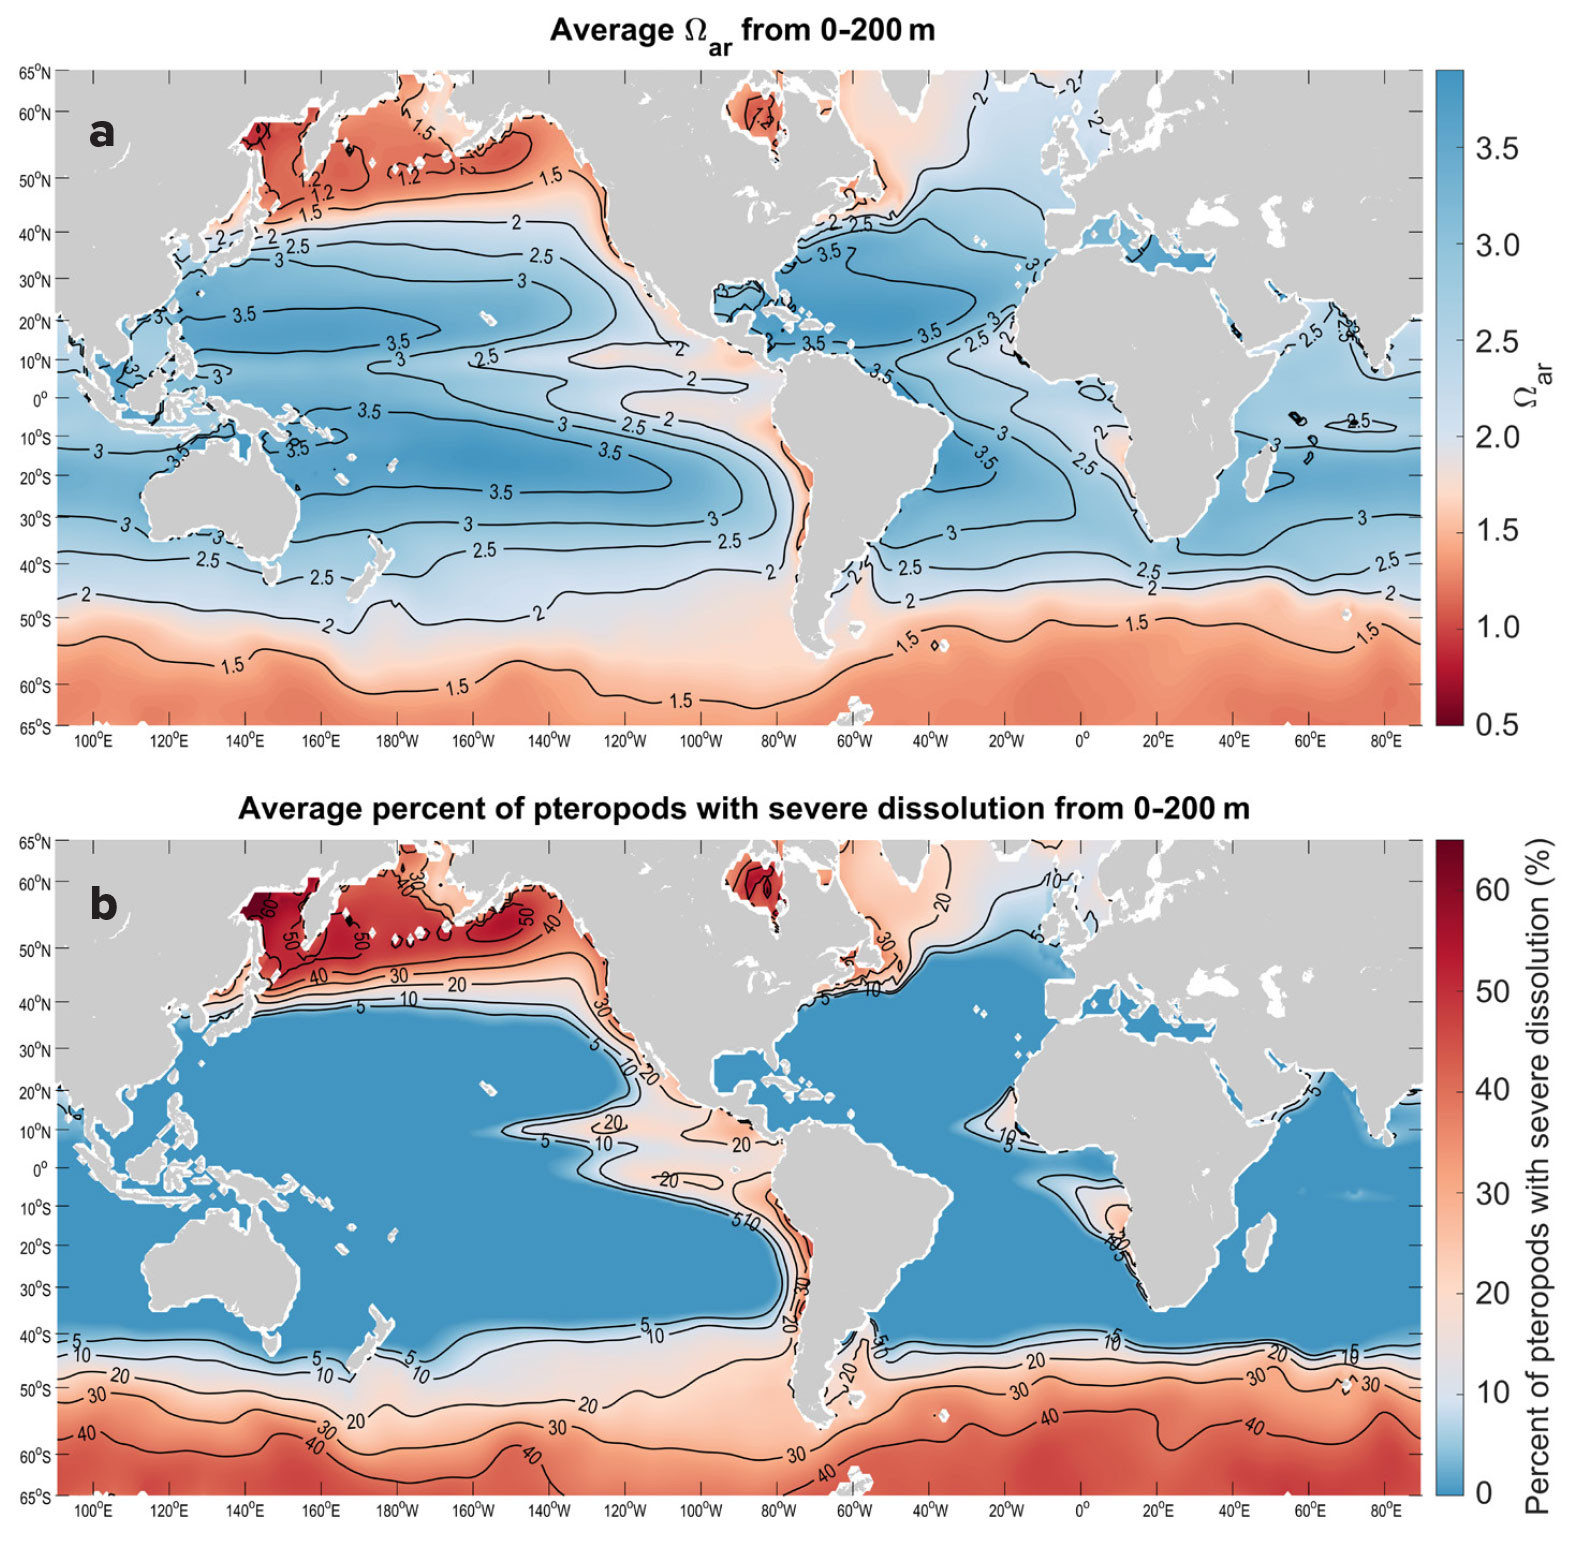
FIGURE 2. The panels show (a) aragonite saturation state (Ωar) averaged over the upper 200 m based on observed data, and (b) projected percent of pteropods likely to show severe dissolution averaged over the 200 m water column. > High res figure
|
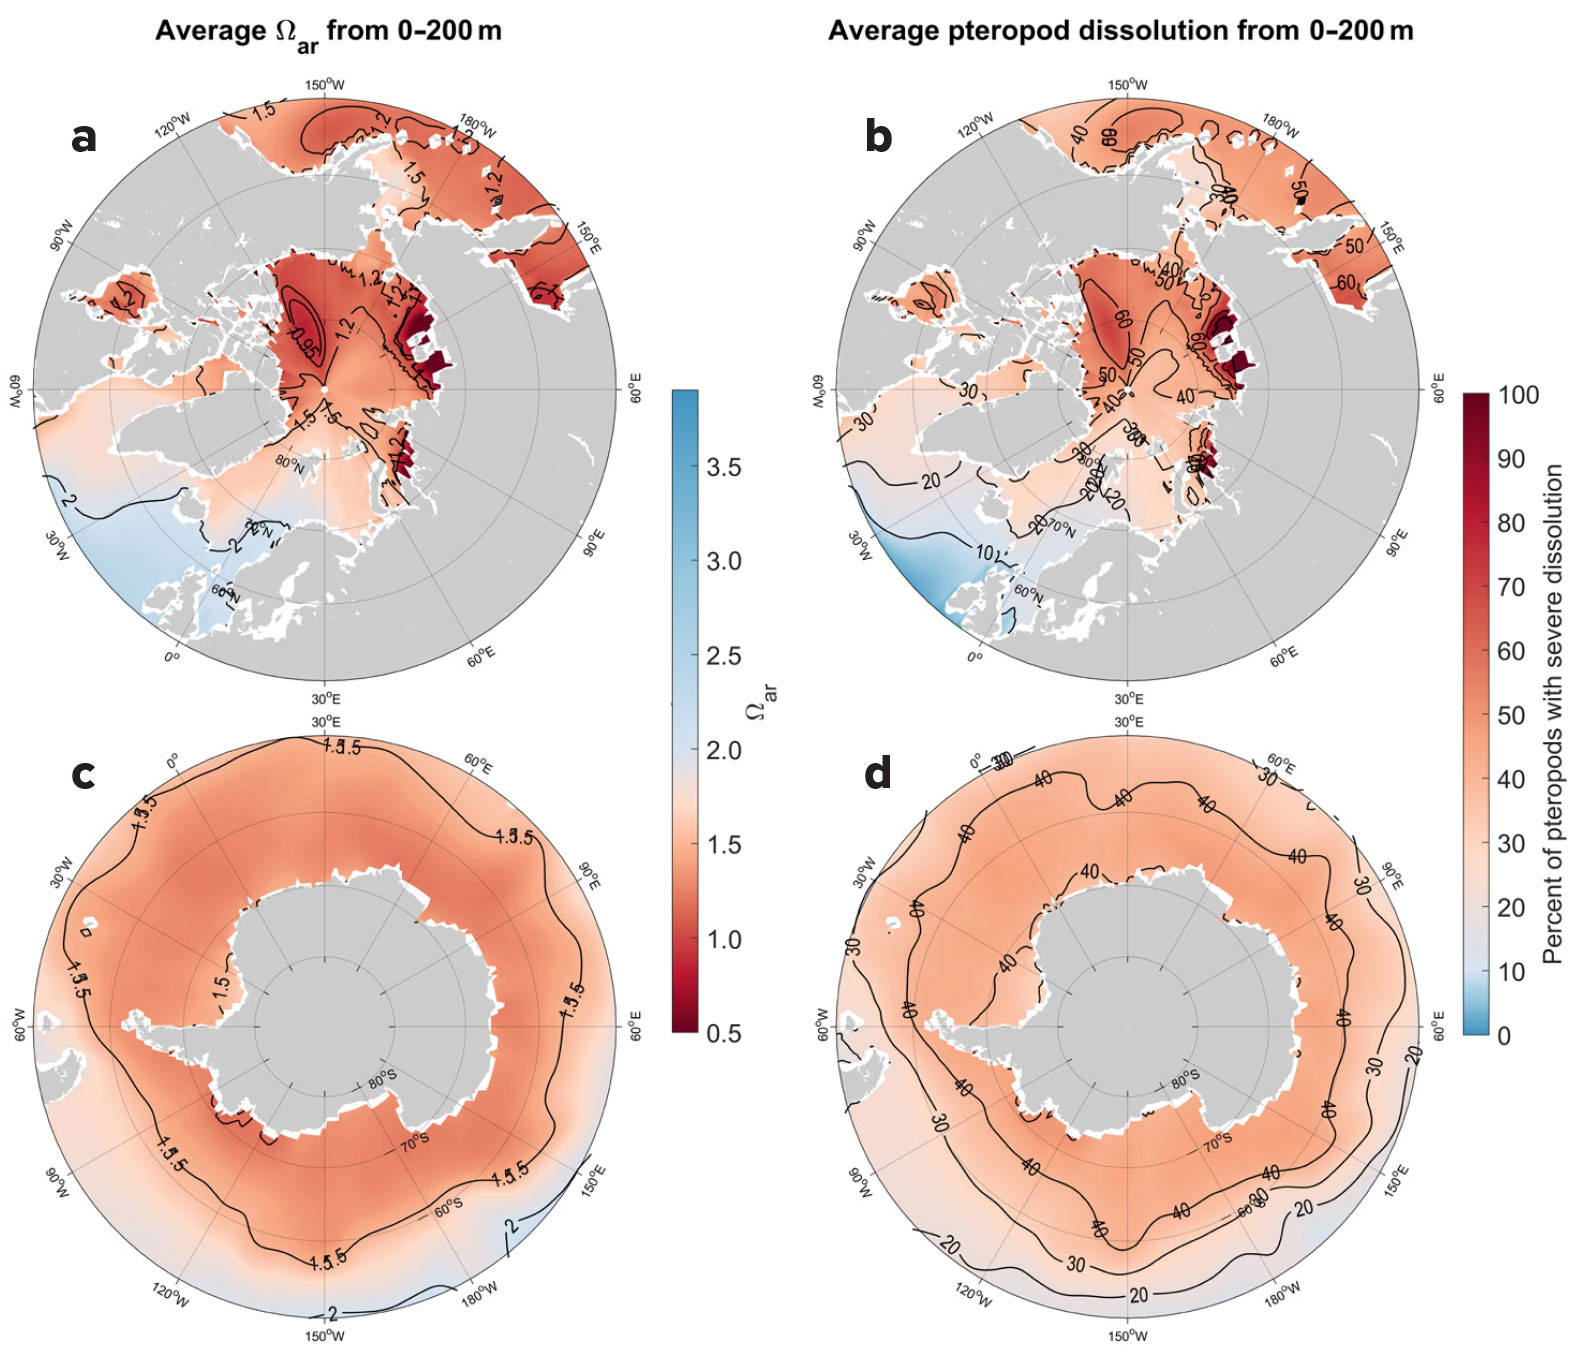
FIGURE 3. (left) Observation-based aragonite saturation state is shown (Ωar) averaged over the upper 200 m in the (a) Arctic Ocean from 50°N to 90°N, and (c) the Southern Ocean from 50°S to 90°S. (right) Percent of pteropods exhibiting severe dissolution averaged over the 200 m water column are charted for (b) the Arctic Ocean and (d) the Southern Ocean. > High res figure
|
TABLE 1. Annual averages for various locations in the North and South Pacific Oceans for the period 1984–2019 from Desmet et al. (2022), with Ωar ± stdev included over the upper 200 m, rate change of Ωar per decade, % of pteropods affected with dissolution ± stdev, and rate change of dissolution per decade. R2 values indicate goodness of fit, and p values indicate significance. Light gray values are p >0.05. > High res table
|
On the global level, the predicted trends for surface Ωar obtained from OceanSODA-ETHZ (Gregor and Gruber, 2021) for the relevant period show strong regional decreases (Figure 4a), which are regionally similar but spatially smaller in extent over the upper 200 m based on the ROMS-BEC model (Desmet et al., 2022; Figure 4b), resulting in additional percent pteropod shell dissolution increase (Figure 4c). The trends in surface Ωar for the California and Humboldt Current Systems are decreasing at rates that are generally more than 0.06 per decade (Figure 4a). Comparatively, in pteropod-relevant habitat over the upper 200 m, the slopes of the decline are significant for several regions (Table 1, Figure 4c). The tropical and subtropical regions from about 30°N to 30°S show the greatest Ωar decline of just over 0.1 Ωar unit per decade. In contrast, in the subpolar and polar regions the Ωar decline decreases to values <0.06 due, in part, to decreasing buffering capacity at the higher northern and southern latitudes. In subsurface waters, the narrow band of the equatorial Pacific from about 5°N to 5°S exhibits a decrease in Ωar of <0.05 over time as a result of upwelling of older water at deeper depths.
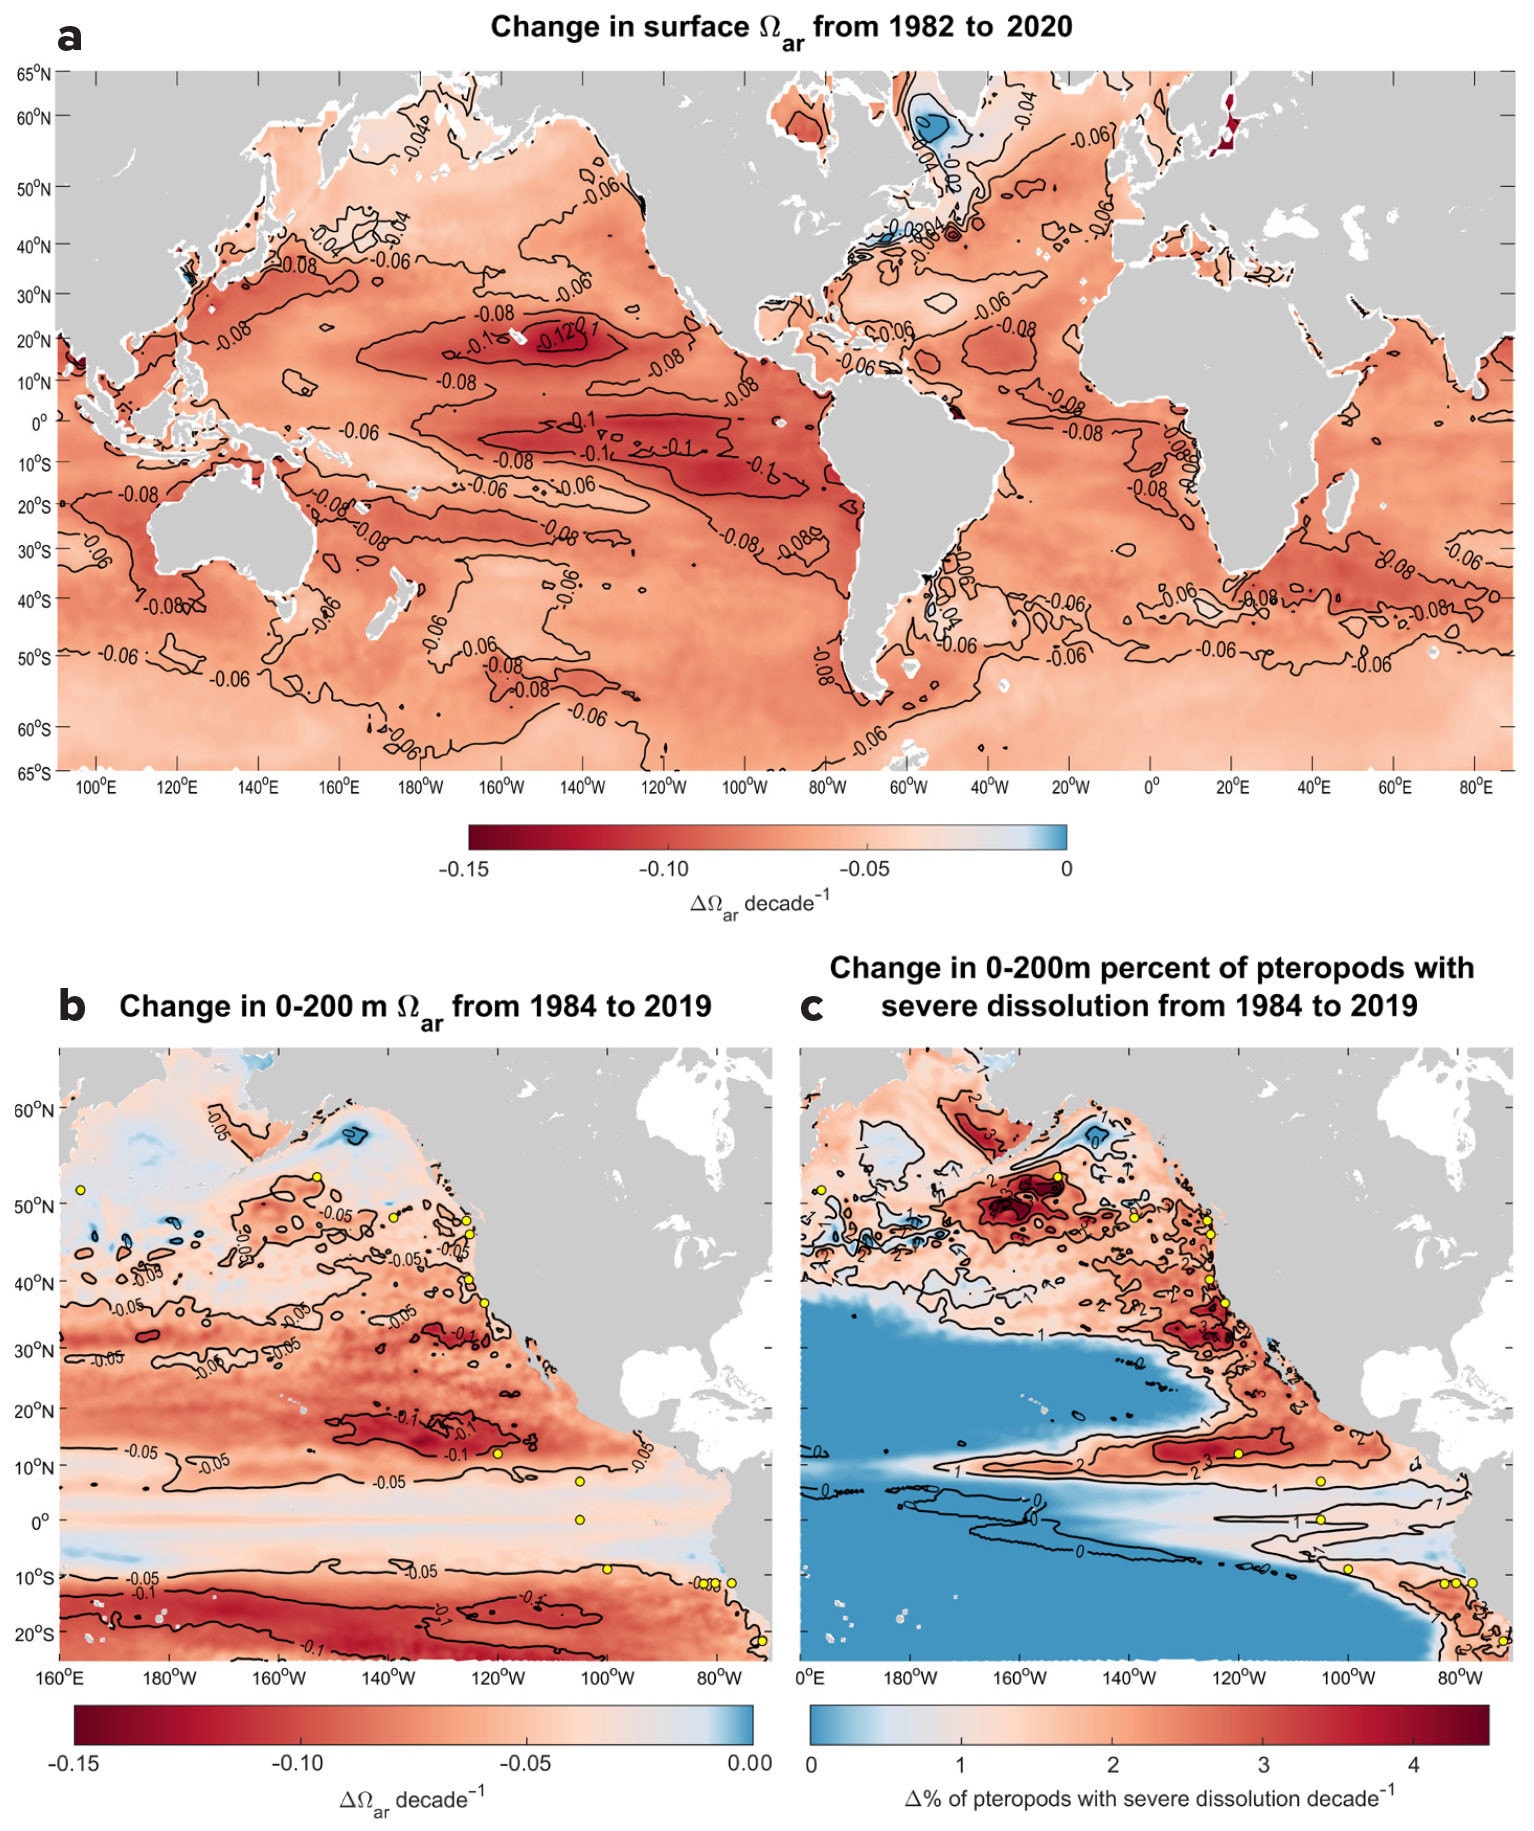
FIGURE 4. Shading shows changes in (a) surface Ωar from 1982 to 2020 based on gridded observations in Ocean-SODA-ETHZ (Gregor and Gruber, 2021), (b) Ωar per decade from 1984 to 2019 in the eastern Pacific averaged over the upper 200 m based on the ROMS-BEC model hindcast of Desmet et al. (2022), and (c) pteropod rate of severe dissolution averaged over the 200 m water column over the eastern Pacific Ocean based on the ROMS-BEC model hindcast of Desmet et al. (2022) ranging from 25°S to 65°N. The yellow dots in panels b and c indicate the stations for which more extensive analyses have been made (see Table 1). > High res figure
|
Pteropod Shell Dissolution: Status and Trends
Projections for the current status and rate of change in the percent of pteropods affected by severe shell dissolution are based on observed climatologies and ROMS-BEC model outputs, respectively. The extent of pteropod shell dissolution strongly overlaps with regions where current Ωar reaches its lowest values and where buffering capacities are low. In the tropical and subtropical Pacific, the dissolution rate also coincides with the fastest rate of Ωar decline in the NEC (Figure 4). As a result of exposure to Ωar in the upper 200 m, the extent of individuals currently undergoing severe shell dissolution is projected to be as much as 40% in the Southern Ocean south of 60°S, 50% in the North Pacific at 50°N, and 60% in the Arctic. Corresponding to Ωar conditions in the upwelling regimes of the California and Humboldt Current Systems, the projections show an offshore-onshore gradient of biological impacts, with up to 40% of individuals affected by dissolution in the highly productive coastal regions of both systems. It is worth noting that previous regional dissolution observations in the polar regions and the California Current System (Bednaršek et al., 2012b, 2014b, 2021; Niemi et al., 2021) closely align with the projections delineated in this study. Projections in the regions of the NEC and SEC, Western North Atlantic, and Benguela Current show that 10%–30% of pteropods will be impacted by dissolution. The projected increase in pteropods impacted by dissolution ranges between 1% and 4%, indicating that an additional 4% to 14% of the total number of pteropods exhibited severe dissolution over the 1984–2019 period. Increases in dissolution are closely correlated with the decline in Ωar recorded over the 36-year period investigated; the regression over time is significant for most of the regions (Table 1) and explains from 24% to 53% of the variability in Ωar.
Discussion
Global projections show strong agreement between Ωar and the extent of pteropods impacted by severe shell dissolution under current conditions. This suggests that some inferences can be made about how increasing OA has impacted dissolution, noting the importance of current Ωar conditions, the rate of change of these conditions, and the corresponding biological responses. The results show that the regions with currently low Ωar are not the same as the regions with the greatest change; the latter actually are on the margins of the low Ωar regions, for example, in the offshore-onshore transition waters of the eastern North Pacific (Figure 4b,c), where large gradients in the buffer capacity occur (Jiang et al 2019, 2023). This indicates an expansion of the regions with low Ωar over time, and thus greater reduction of suitable pteropod habitat.
Polar/subpolar regions and eastern boundary upwelling systems are characterized by high pteropod biomass (Knecht et al., 2023). Rapid change in Ωar is evident near the frontal boundaries of both, so we may expect to see significant increases in dissolution in these areas over space and time. It is important to note that our projections concern the globally dominant pteropod species Limacina helicina. The few studies conducted so far that investigate the decline of CaCO3 calcification at lower Ωar support the findings either across different regions (Lischka et al., 2011; Comeau et al., 2012; Bednaršek et al., 2014a) or in different species (Moya et al., 2016; Maas et al., 2018; Mekkes et al., 2021), indicating that dissolution estimates could be extrapolated among different pteropod species and regions. The rate of shell increase per decade might not seem substantial, but it is important to understand that this represents an additional percentage of the total number of pteropods that will exhibit severe shell dissolution. For example, a 4% increase per decade in polar regions indicates that an additional 12% of the total number of pteropods will exhibit severe shell dissolution by 2050, a surge from 50% to 62% of individuals affected, which could be substantial in population terms, especially in combination with reduced calcification. Shell dissolution projections are made for the early and mid-stages of the population, the demographics of which are critical to population dynamics (Bednaršek et al., 2016). However, current estimates of the relationship between shell dissolution and mortality are fairly uncertain given only one study on this (Bednaršek et al., 2017b). To date, no quantitative evaluation exists for a shell repair process (Peck et al., 2018; Niemi et al., 2021) that would offset extensive shell dissolution.
There is a much greater certainty that the population changes would accelerate in time in regions with overlapping OA and warming and marine heatwaves. Such stressor co-occurrence conditions may prove to be the most detrimental to pteropod populations (Lischka et al., 2011; Manno et al., 2017; Bednaršek et al., 2022; Elizondo and Vogt, 2022; Knecht at al., 2023). Co-linear deoxygenation and OA impacts (Feely et al., 2023, in this issue) could also have a relevant impact, but further study on this is needed.
Both acute subsurface shell dissolution and long-term population decline, which could have regionally important implications for the carbon system, are detectable through modulation in the subsurface ocean carbonate system, TA perturbations, and carbonate export (Feely et al., 2004; Sarmiento and Gruber, 2006; Bednaršek et al., 2012a; 2014a). Synthesizing observational data, biomass distribution, and dissolution, we predict substantial declines in carbon export and sequestration in the polar and subpolar regions of the North Pacific between 50° and 60°N, in the California and Humboldt Current Systems, and in the NEC and SEC regions, and strongly suggest targeted monitoring of carbon and sinking fluxes in these regions. Insights from this study are directly relevant for carbon sequestration and marine CO2 removal strategies.
Acknowledgments
The authors would like to thank Nicolas Gruber and Matthias Münnich for their support with respect to the model simulation that was performed at the HPC cluster of ETH Zürich. We also want to express our most sincere appreciation to Dana Greeley and Julian Herndon for their help with pteropod sampling on the NOAA West Coast cruises. GP acknowledges Luke Gregor (ETH Zürich) for help in conceptualizing the method for creating a three-dimensional monthly climatology for aragonite saturation. Funding for RAF and NB was provided by the NOAA Ocean Acidification and Global Ocean Observing and Monitoring Programs and the Pacific Marine Environmental Laboratory (OAP Contract Number NRDD 20848 and GOMO Fund Reference Number 100018302). NB also acknowledges support from the Slovene Research Agency (ARRS “Biomarkers of subcellular stress in the Northern Adriatic under global environmental change,” project # J12468), as well as NOAA’s Multistressor project (project number NA22NOS4780171). This is PMEL contribution number 5495.

