Full Text
It is logistically difficult to directly tag larvae to track their dispersal over large spatial scales (the rare exception is work done by Jones et al., 2005), so a variety of approaches have been developed to measure connectivity processes indirectly or passively. When the Partnership for Interdisciplinary Studies of Coastal Oceans (PISCO) began in 1999, a sea change was underway in our understanding of larval connectivity: after decades of assuming that larval dispersal was widespread and that larvae rained down to the benthos from a well-mixed pool, new tools and new evidence suggested the potential for much shorter dispersal distances and considerable retention of larvae near spawning sites (see White et al., 2019, in this issue). In the subsequent two decades, PISCO scientists have used a variety of empirical and modeling tools to understand connectivity patterns. Some of these have evolved in complexity with the advent of new techniques and greater computing power (genomics, biophysical models), while others have proven to be less fruitful than originally hoped (natural markers in calcified structures). Here, we describe some of these tools.
|
|
Genetic Methods
Dispersal inferences based on genetic differences between populations integrate over many individuals and many generations, and may not reflect contemporary gene flow if dispersal dynamics have changed (Waples, 1998). However, new genomic tools can reveal the geographic distribution of thousands of gene loci among populations, instead of the handfuls of loci that were used in decades past. Analyzing a large number of loci allows much finer detection of subtle patterns of gene flow, revealing barriers to dispersal and detecting loci that are under active selection in different environments (Marko and Hart, 2018). This is a double-edged sword because strong selection after settlement can limit gene flow, even in the absence of barriers to dispersal. As a result, a genetic difference between populations may not signal lack of dispersal but instead signal a different habitat, selecting for different traits. This possibility must be accounted for when interpreting genetic data.
Richer data sets also allow detection of close kin in marine populations, sometimes even parent/offspring pairs (e.g., parentage analysis), strengthening our ability to quantify dispersal events over ecological time scales (e.g., D’Aloia et al., 2015; Almany et al., 2017). These can also help measure current population sizes through a type of genetic recapture analysis (e.g., Hillary et al., 2018). A different type of kinship, sibling-ship, has also been increasingly detected with unexpected frequency in larval cohorts settling at the same location. This can provide evidence that larvae spawned together may travel together in coherent “packets” (Selkoe et al., 2006).
Information from genetics can be generalized into a description of connectivity in the metapopulation. Often this takes the form of a dispersal kernel, a statistical description of the probability of a larva traveling a given distance and direction from its source. Bode et al. (2018) provide guidance on how to avoid some of the conceptual pitfalls in using this method.
Biophysical Models
An increasingly widespread approach to estimating connectivity computationally is to simulate the release of “larvae” as particles in the flow field produced by a three-dimensional numerical ocean circulation model (e.g., Shchepetkin and McWilliams, 2005). As the data sets required to drive such models have become more widely available and computational power has increased, it has become possible to generate connectivity estimates for nearly any area of interest. The advantage of such models is that they can generate dispersal probabilities over large spatial scales at high resolution, without depending on intensive collection of individual parents and settlers. However, there are three major limitations. First, predictions depend on the specified behavior of the simulated larvae (Paris et al., 2007), but in many cases we know little about the ontogeny of depth regulation and swimming in larvae. Second, many species of interest reside in shallow nearshore waters, where it is difficult for models to faithfully represent circulation (though this is an active area of research; Kumar et al., 2015). Finally, it is difficult to validate dispersal predictions, because we usually lack information on where and how many larvae are spawned at any given time, and thus how many should be predicted to disperse. However, this comparison has been made successfully in a few cases (e.g., Watson et al., 2010).
Natural and Artificial Markers in Calcified Structures
Many species lay down daily rings of calcium carbonate in their otoliths (fish “ear stones”) or statoliths (invertebrate “equilibrium stones”), preserving a time-stamped record of age, growth, and trace element signatures from the surrounding water. Because there is geographical variation in oceanic trace element concentrations, there exists the intriguing possibility of extracting time-stamped spatial information from calcified structures and determining the origin or transport pathway of larvae. The idea is that one could map connectivity pathways by comparing the trace element signatures in the core region of the otolith or the statolith of a post-dispersal recruit to the geographic pattern (an “atlas”) of trace element signatures in pre-dispersal young. Unfortunately, the spatial resolution of such an atlas is usually quite coarse and can vary over time. Consequently, this approach has only been deployed successfully to estimate a full set of connectivity pathways for coastal or open-ocean species in a few cases, using bivalves (e.g., Becker et al., 2007). Other applications have provided more limited information on connectivity, such as the proportion of settling larvae produced locally vs. elsewhere (e.g., Hamilton et al., 2008).
Standardized Recruitment Monitoring
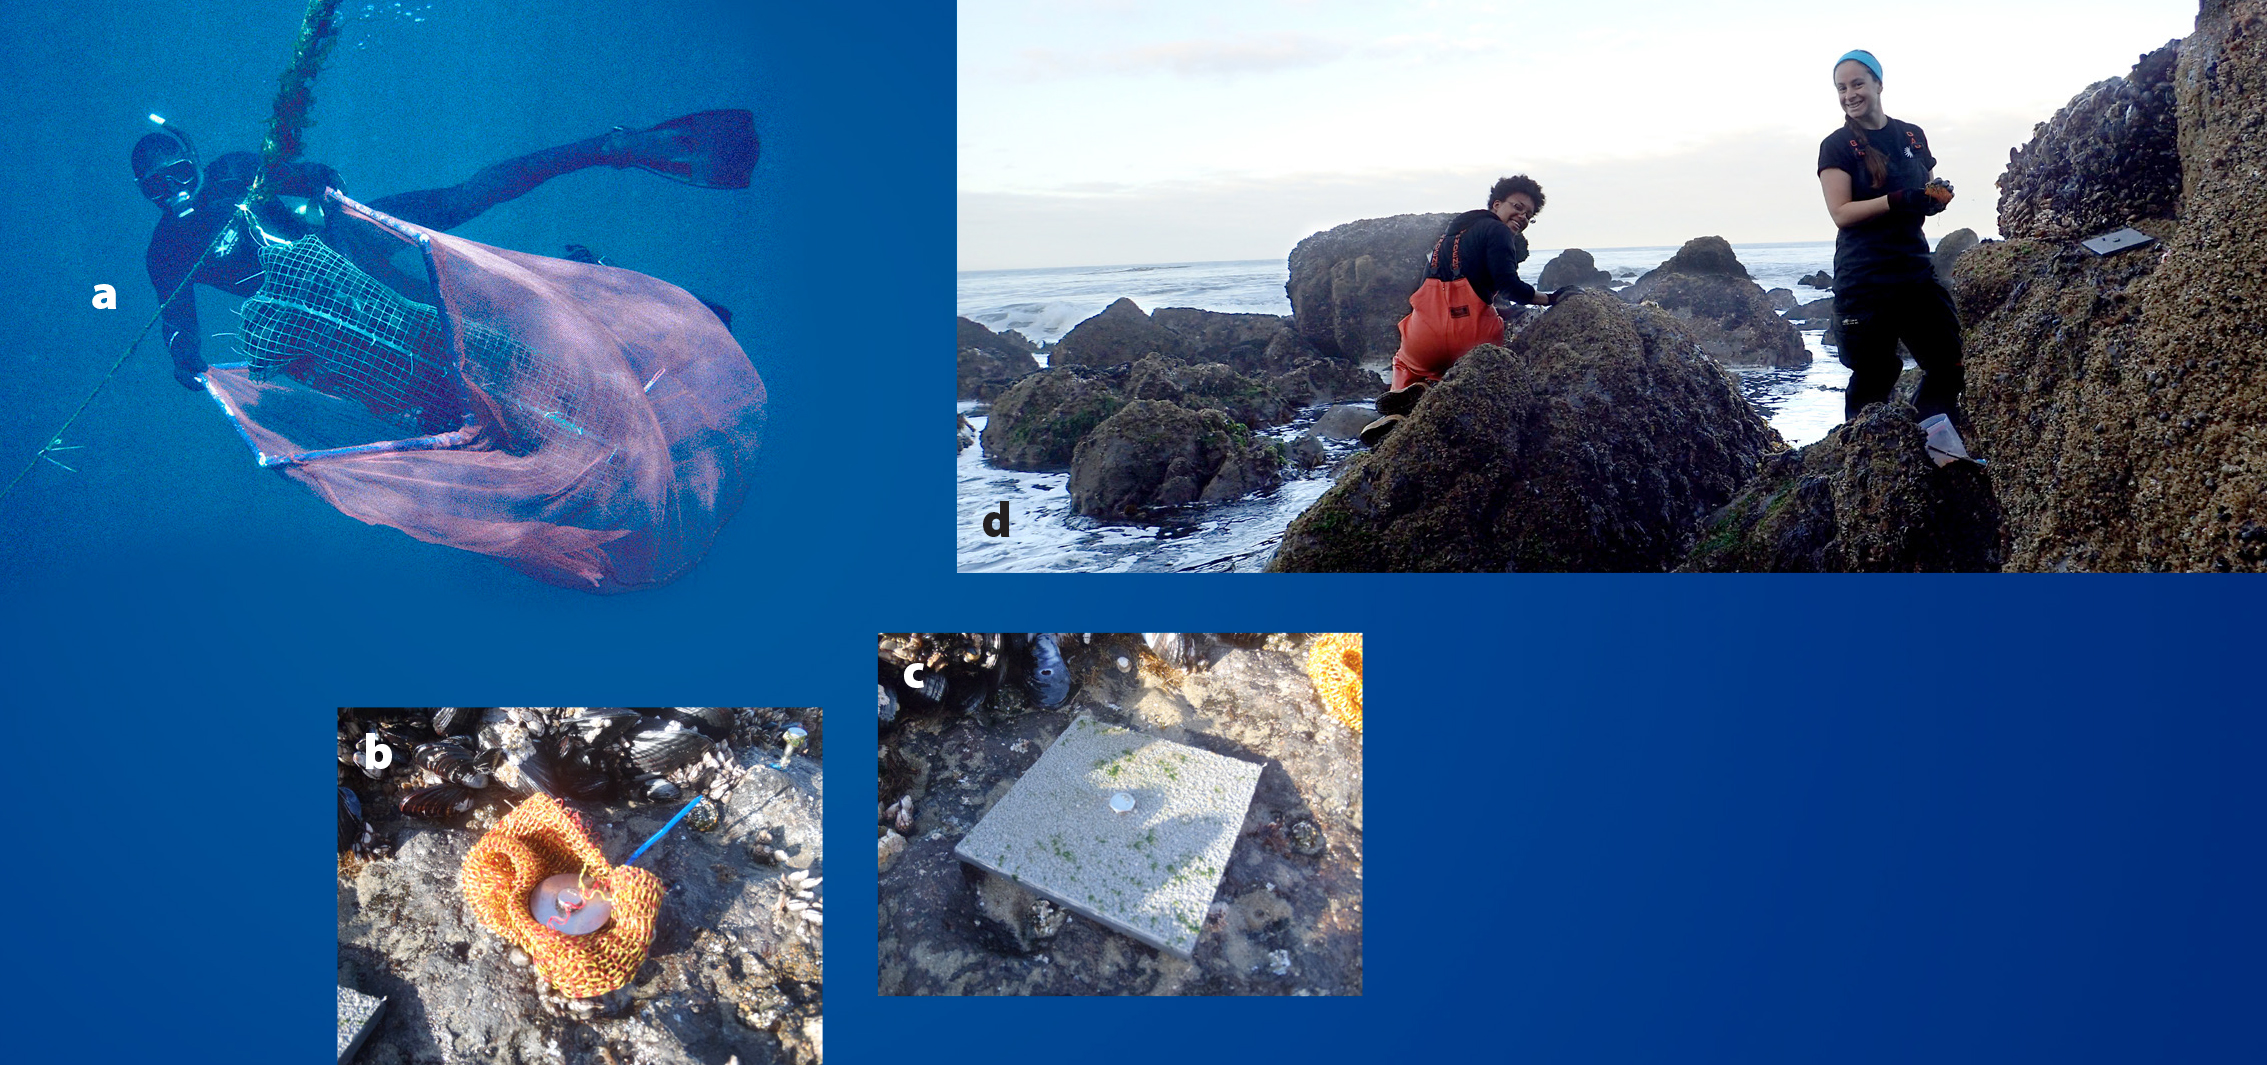
Large-scale, long-term monitoring of larval settlement across multiple sites can reveal the physical factors affecting nearshore larval delivery, and also facilitates comparisons with model predictions (e.g., Watson et al., 2010). Such monitoring requires standardized, easily deployable, inexpensive, and readily processable samples of larval propagule supply. The basic approach is to artificially mimic natural settlement substrate—from flat plates to filamentous mussel byssal threads to artificial kelp canopy—and PISCO has used this approach to develop standardized larval monitoring devices for mussels, sea urchins, sea stars, crabs, and fishes (see photos on opposite page). In all these cases, the goal is to provide homogeneity in collection method to facilitate comparisons over time and space. One caveat to these approaches is the concern that these devices could conceivably produce biased settlement estimates, because of either different attractiveness or different post-settlement mortality relative to natural habitats. Also, patterns of larval abundance and patterns of connectivity are not always perfectly linked, because abundance depends on patterns of larval production as well as larval delivery (Watson et al., 2010). However, it appears to be safe to use these as relative indices of larval delivery for the purposes of detecting long-term, large-scale patterns.


