Full Text
Purpose of Activity
Ocean drifters provide essential data for understanding surface currents. As part of a summer school on marine robotics, we developed a curriculum around a low-cost drifter platform. Using this curriculum, students explore oceanographic concepts and engineering principles by designing the drifter with buoyancy and drag considerations, deploying it, and analyzing data to understand the relationship between Lagrangian trajectories and Eulerian flow fields. They also investigate the influence of tides, wind, and bathymetry on surface currents, comparing their observations with other datasets. At the same time, they build foundational engineering skills, including waterproofing, circuit assembly, sensor integration, and using hand tools, gaining practical experience in applying these to ocean systems.
Audience
The curriculum we describe here is a hands-on project, developed for the two-week MIT Portugal Marine Robotics Summer School in the Azores, offered alongside a series of lectures. Twenty undergraduates and graduate students formed six interdisciplinary teams with expertise spanning engineering, fluid mechanics, robotics, marine biology, oceanography, and computer science, a mix that fostered cross-field learning. The project did not assume prior knowledge of engineering or oceanography, and students drew on their individual strengths to support team progress. The first week focused on building and testing drifters. Students engaged with related literature and analyzed example designs as they developed their own designs, considering how various choices were likely to impact performance. The second week involved drifter deployment, data collection, and comparison with other datasets and models.
Background
Measuring and modeling ocean surface currents is critical for understanding circulation systems that influence ecosystems and human activities (McWilliams, 2016). Currents can be observed via Lagrangian methods, such as tracking passively advected drifters with GPS or inertial sensors, or Eulerian methods, using fixed instruments such as current meters or radar systems. Early surface drifters included simple “messages in a bottle” (Monahan et al., 1974; Lumpkin et al., 2017), followed later by biodegradable objects such as oranges (Muhlin et al., 2008; Bjørnestad et al., 2021). Özgökmen et al. (2018) provide a comprehensive overview of the history of drifters.
The two most common drifter designs employ either a holey-sock drogue, which follows currents at depth, or an underwater cross-shaped sail drogue that tracks near-surface flow. The Surface Velocity Program (SVP) drifter is a well-known example of the holey-sock design (Niiler et al. 1995; Haza et al. 2018), while the Coastal Ocean Dynamics Experiment (CODE) drifter exemplifies the cross-sail version (Beardsley and Lentz, 1987; Boydstun et al., 2015). The CODE design, in particular, has inspired several well-known adaptations, including the biodegradable drifters developed by the Consortium for Advanced Research on Transport of Hydrocarbon in the Environment (CARTHE) to reduce cost and environmental impact (Novelli et al., 2017; Haza et al., 2018; Ganesh et al., 2025). More recent versions of both designs, such as Areté, integrate additional sensors for temperature, salinity, and acoustics.
Providing students with practical experience in tracking ocean currents with Lagrangian drifters requires low-cost, approachable methods. Several educational initiatives use drifter-based curricula, including “Go with the Flow,” “Get to Know a Drifter,” the NOAA “Adopt-a-Drifter Program,” and classroom activities such as “Exploring Our Fluid Earth: A Marine and Freshwater Systems Curriculum,” and there are student drifter programs (Gulf of Maine Association, 2014; Anderson, 2015). Our curriculum focuses on giving students hands-on experience in building, deploying, and collecting data from drifters with a cross-shaped sail drogue design.
Design, Materials, and Assembly
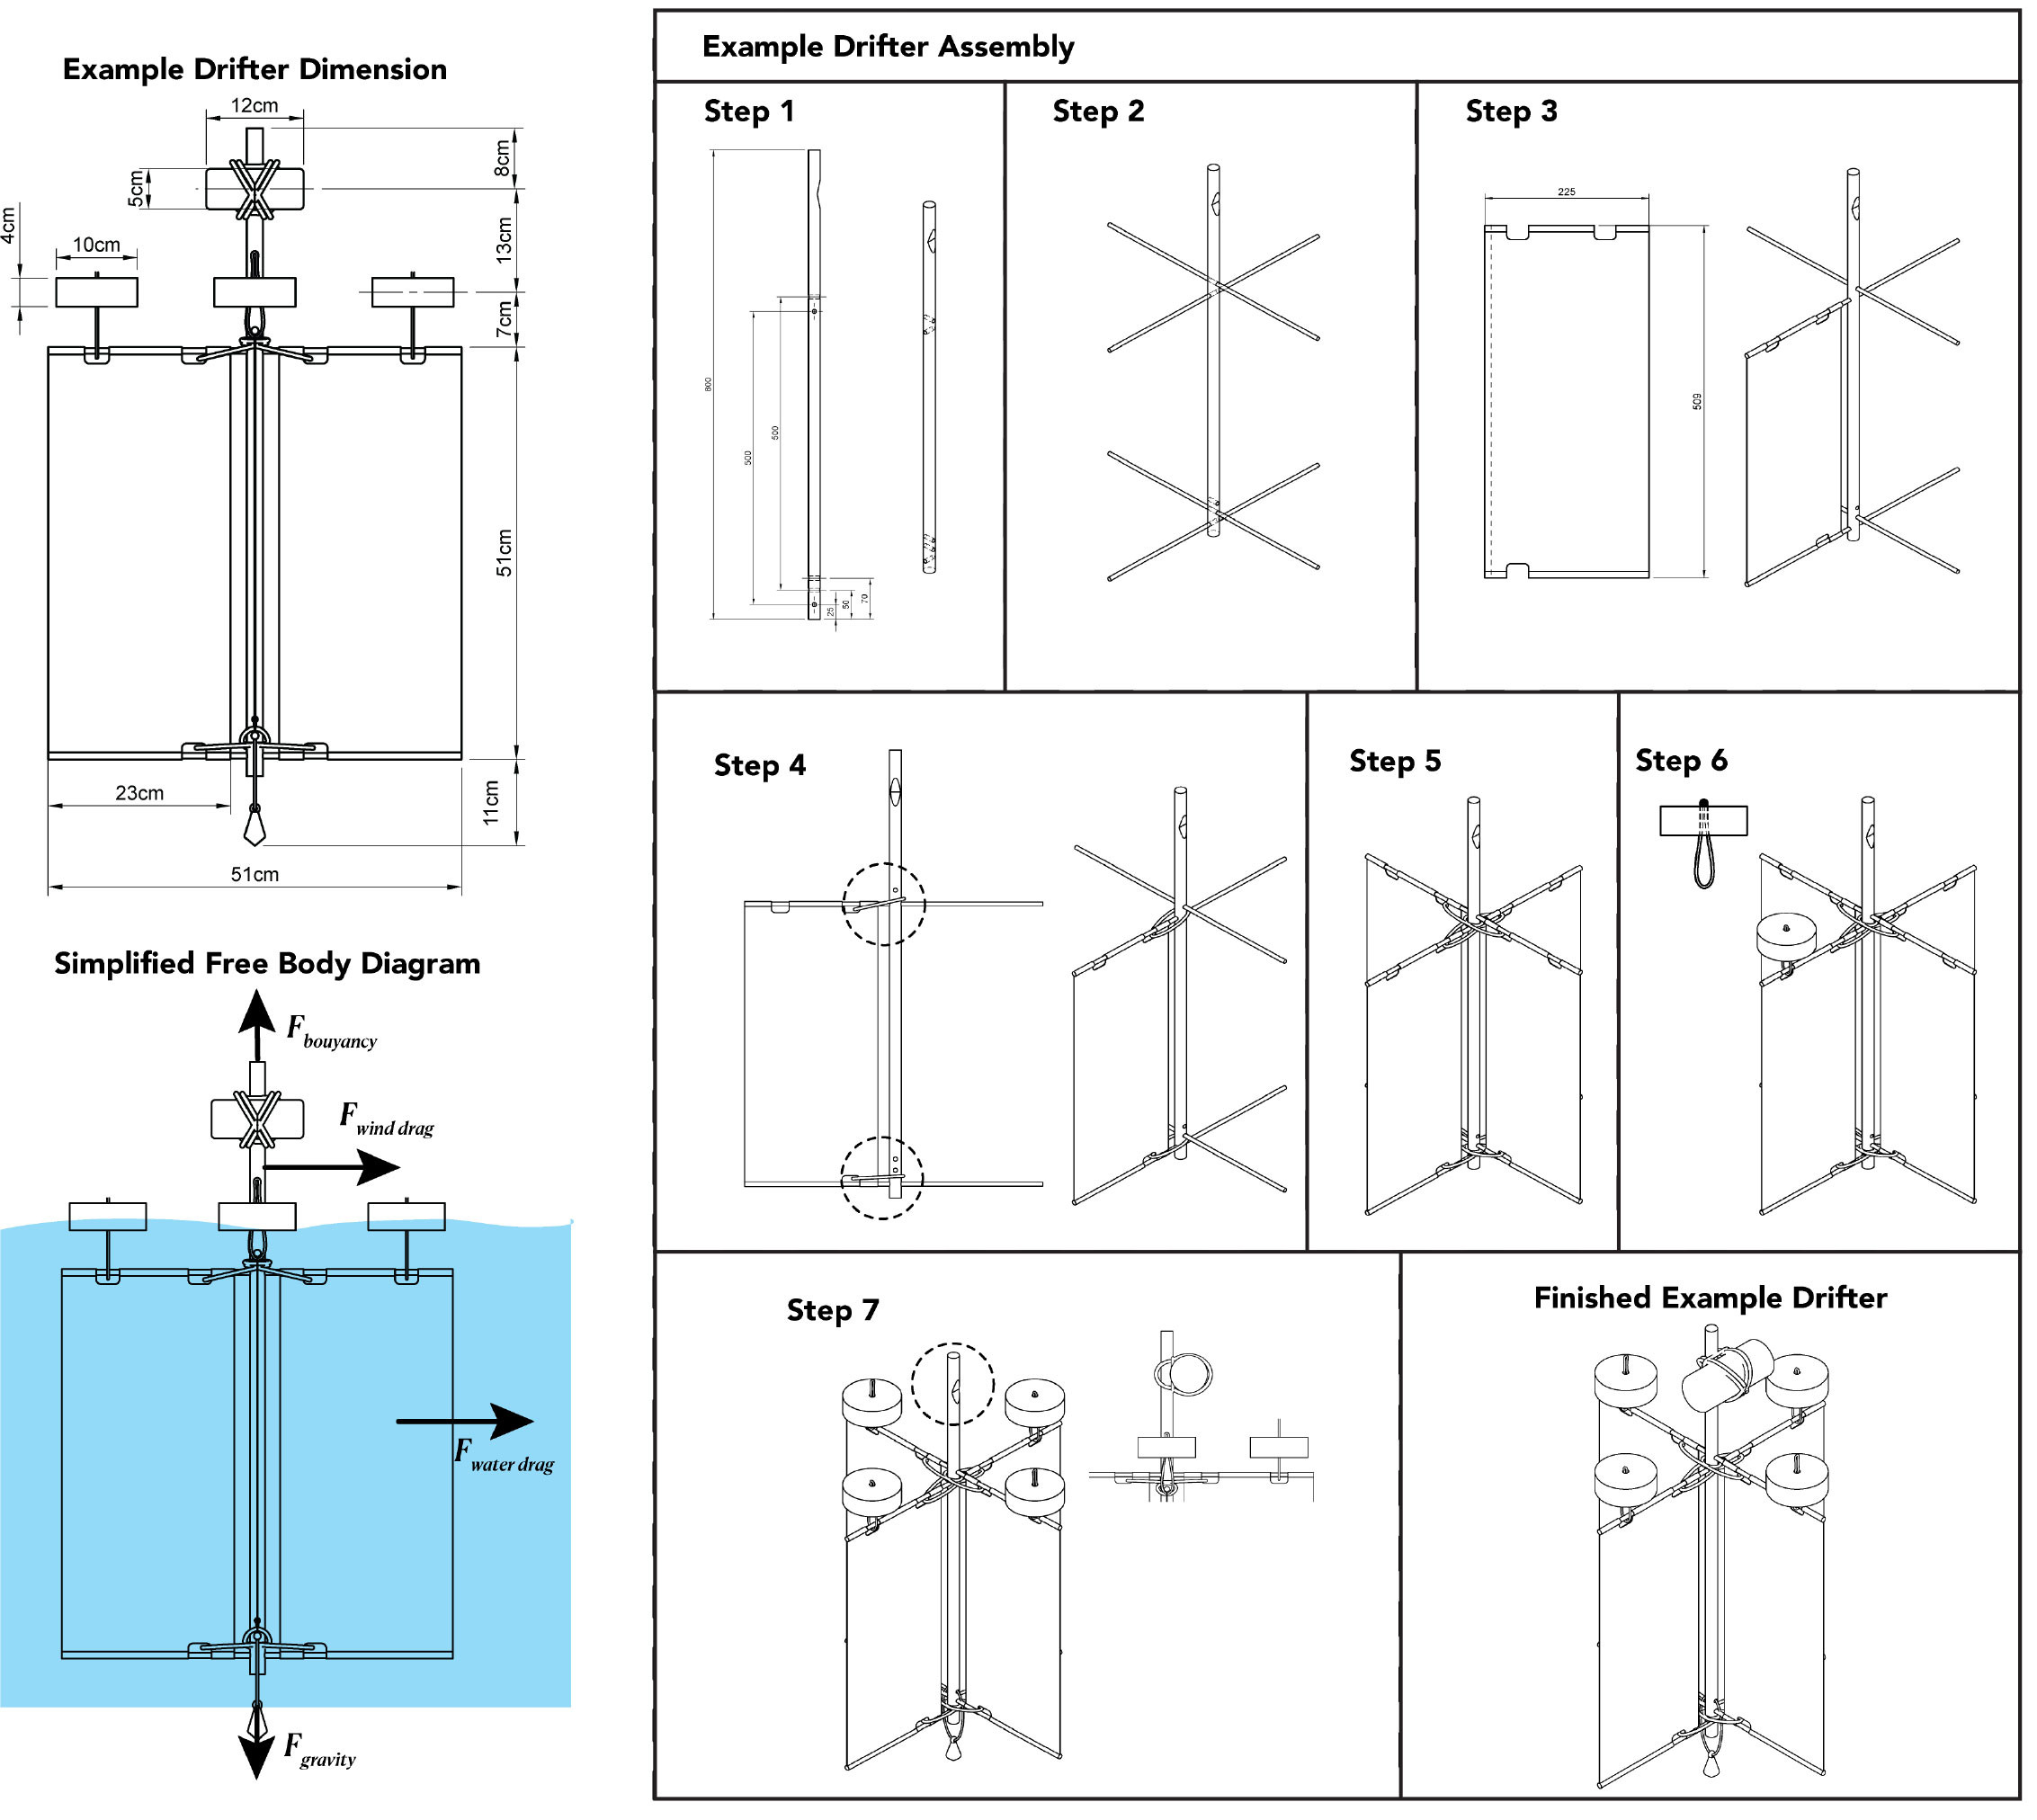
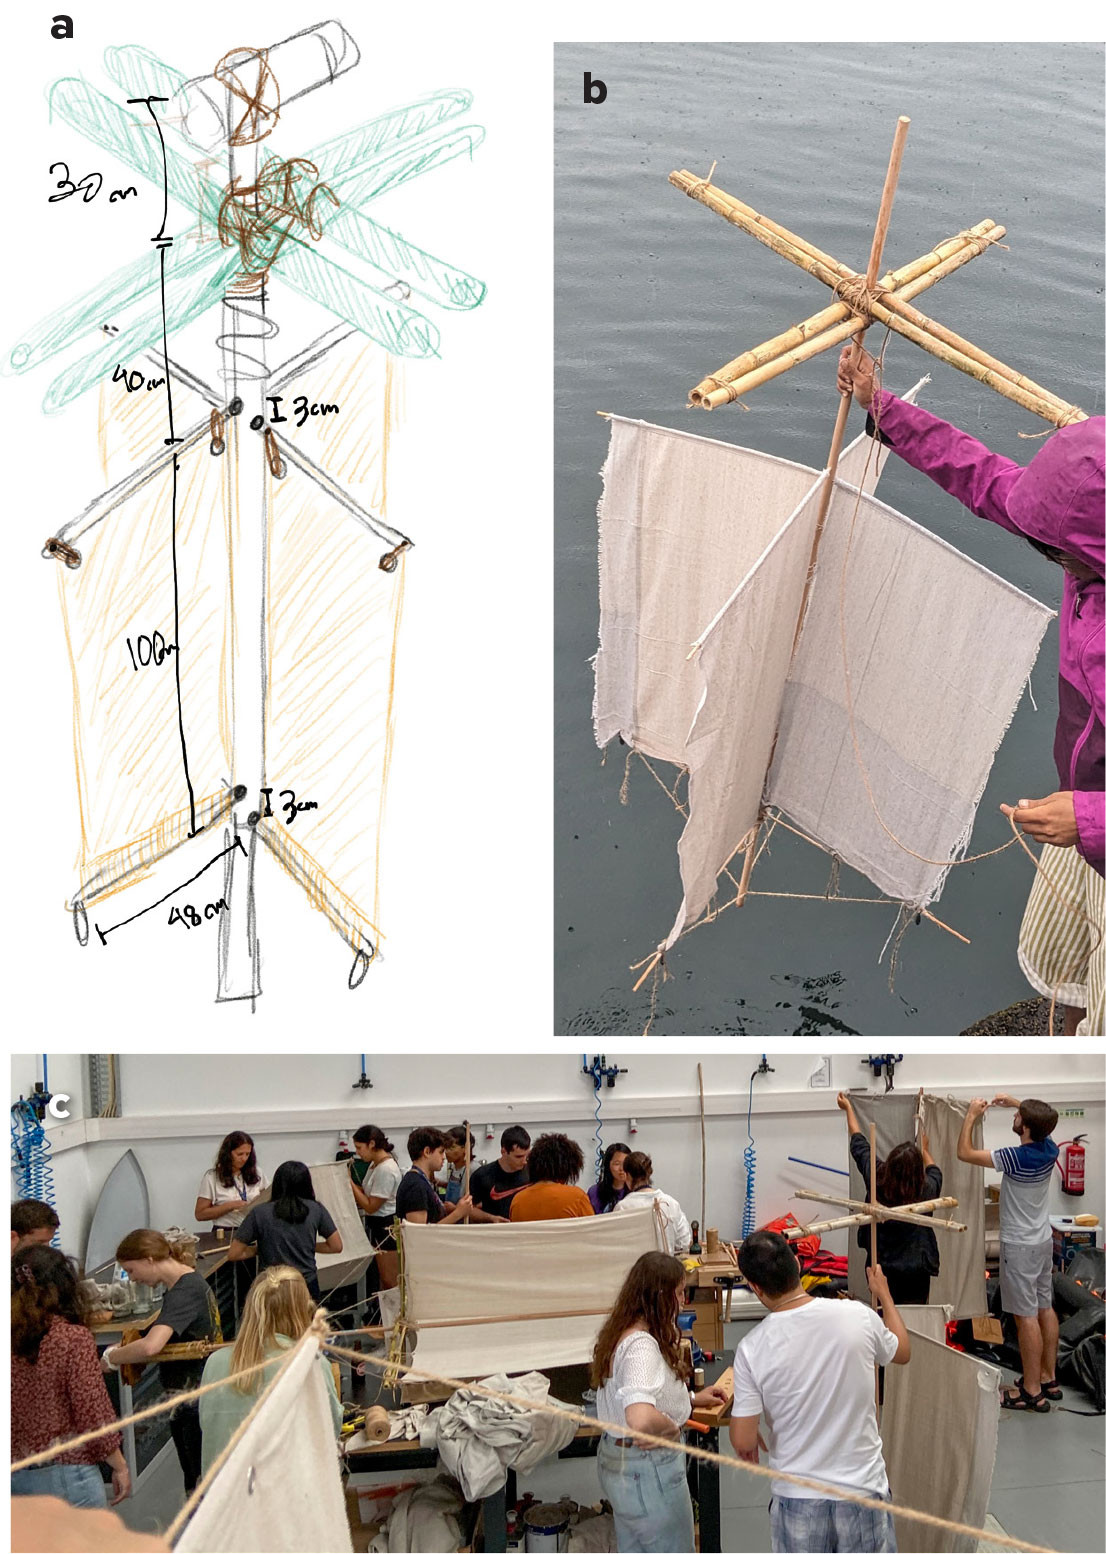
The drifter consists of two components: a mechanical structure and an electronic system. The learning goal is for students to understand how the mechanical design influences the drifter’s water-following capability, durability, and stability, and to learn how the electronic and software systems manage power, sense properties, and enable communication. Instructors provide students with one example design using the available materials (Figures 1 and 2).
|
|
|
|
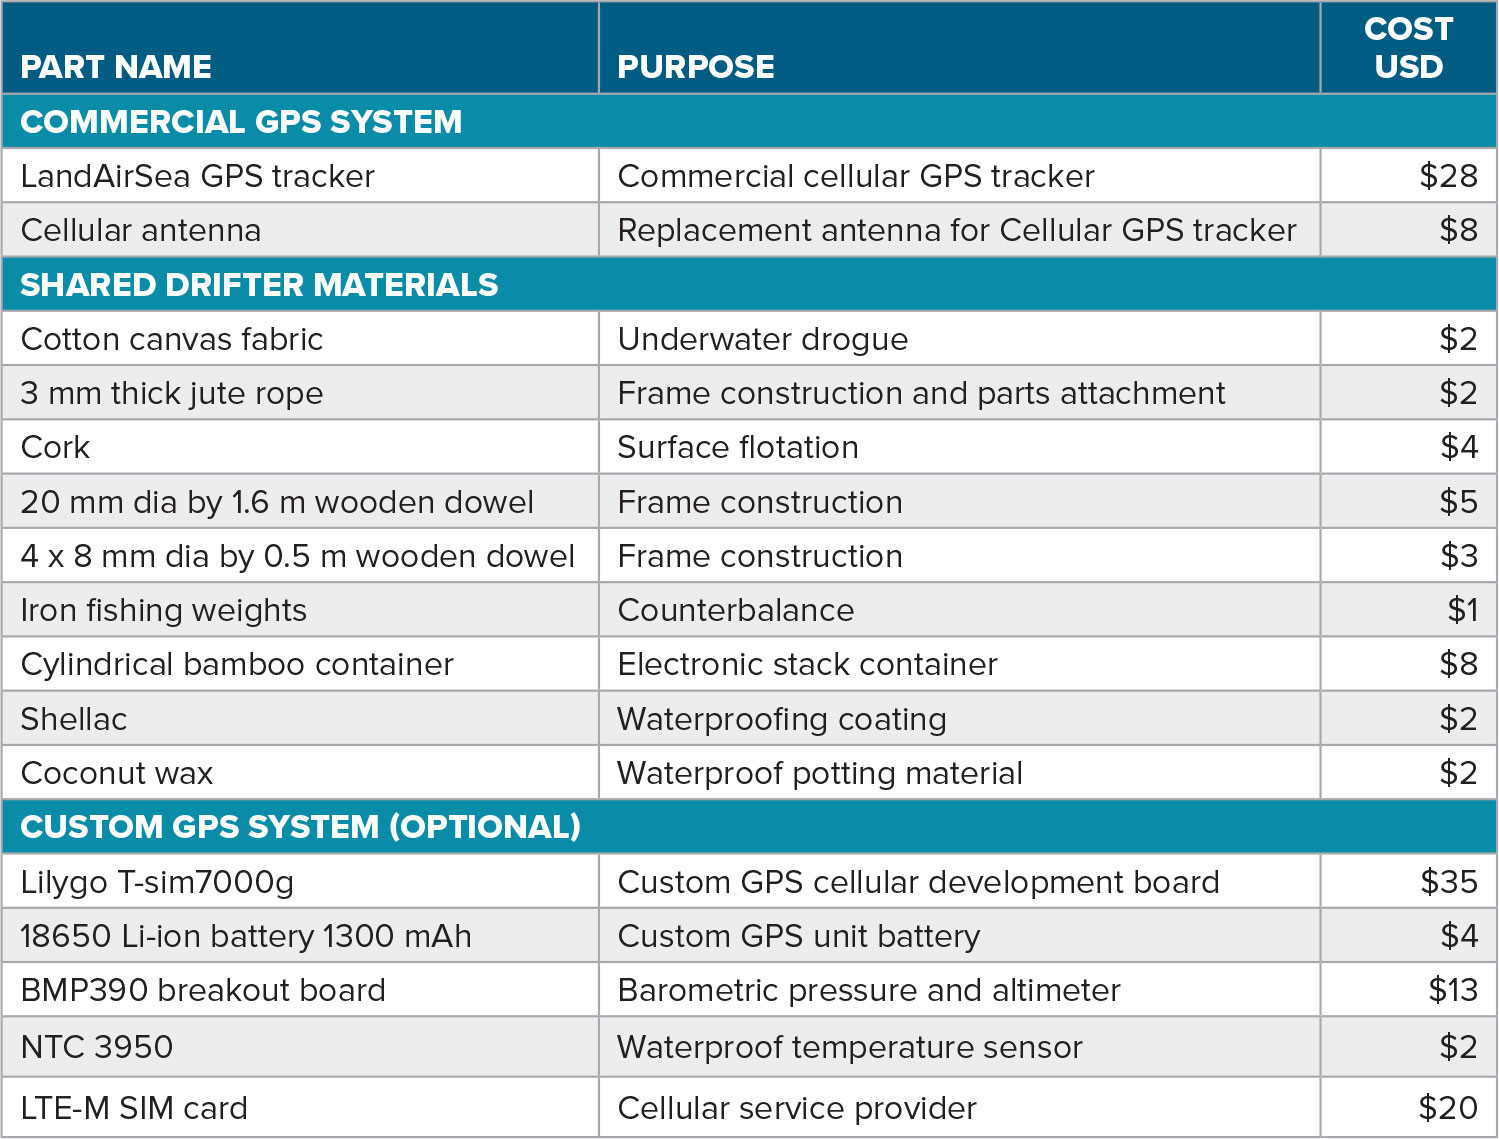
In our program, each team was supplied the materials needed (Table 1), though they were permitted to use locally available alternatives. Because the drifters were not intended to be retrieved, all components except the electronic stack were biodegradable. During the design phase, students were encouraged to think about drogue geometry, length, and weight distribution. They received instructions in the form of a presentation, which, along with written instructions and code, is available in the project’s GitHub repository.
TABLE 1. List of provided materials. > High res table |
Mechanical Design: Ocean Drifter Dynamics
Using the curriculum, students learn that drifter motion is shaped by water movement, wind drag, wave action, and buoyancy. To track surface currents accurately, they explore how minimizing wind drag improves performance. Instead of relying on mass or inertia, students design their drifters to be highly sensitive to water flow.
Specifically, the motion of a surface drifter subject to oceanic and atmospheric forcing can be described by Newton’s second law:

where v is the drifter velocity and m is its mass. For small, low-inertia drifters, Coriolis and pressure gradient forces may be negligible over short timescales (Niiler et al., 1987; Furnans et al., 2008).
Buoyancy and Gravity
To maintain surface tracking, the drifter is designed to be slightly positively buoyant (ρwV > m; Bjørnestad et al., 2021):
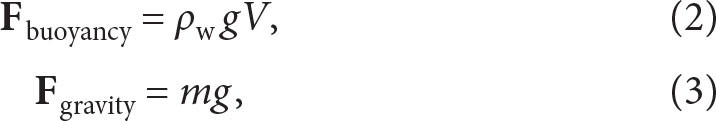
where ρw is the density of seawater, V is the displaced volume, and g is gravitational acceleration.
Hydrodynamic and Wind Drag
The primary forces affecting horizontal motion are drag from both water and air:
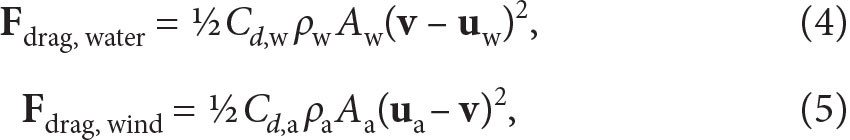
where uw and ua are the water and wind velocities, Cd is the drag coefficient, A is the effective cross-sectional area, and subscripts w and a refer to water and air, respectively.
Minimizing Wind Slippage
Niiler et al. (1987) showed that to keep wind-induced slip under 1 cm s–1 when the wind speed is 10 m s–1, the drag area ratio (R) should be greater than 40.
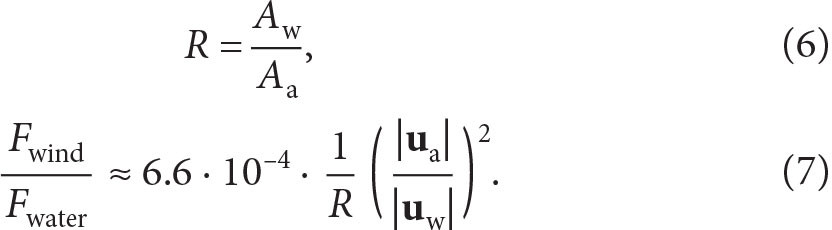
A higher R ensures the water drag force dominates over the drag from wind forces. The area ratio of the drifter provided as an example to the students is approximately 40.
Inertial Response Time
The drifter’s responsiveness to transient currents is governed by a time constant:
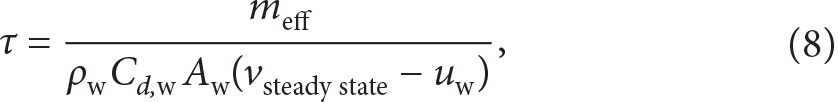
where meff includes added mass from the surrounding fluid, an important concept in hydrodynamics (Stelson and Mavis, 1957). Increasing the water drag area lowers the τ values, yielding better temporal resolution of current variability. However, increases in drogue drag require a stronger, more robust structure, and a potentially more complicated deployment due to size. All of these considerations allow students to explore how different mechanical designs affect the performance and ease of drifter deployment.
Electronic Design: GPS trackers
Each of our student teams received a commercial off-the-shelf GPS communication system. This system transmits GPS data via an LTE-M network, which uses the existing 4G LTE infrastructure to send data from Internet of Things (IoT) devices over a frequency range of 700–1,200 MHz. Course staff provided the students with a monthly subscription for the commercial tracker. To increase the communication range, students were given the option to replace the stock LTE antenna with a higher-gain directional LTE antenna. They estimated the commercial GPS unit’s transmission distance with and without the antenna modification and found that the modified unit, with the directional antenna, offered an estimated range of 10–15 km from a cell tower. The commercial GPS is configured to transmit every 10 minutes, but this interval may vary depending on the availability of both the GPS and the LTE-M signals.
To further advance learning, student teams were also given the option to implement a custom-built cellular communication system. This setup allowed them to integrate additional environmental sensors, such as those for temperature and barometric pressure. The custom tracker included: (1) an ESP32 board with a SIM7000G GPS/cellular modem, (2) a 18650 lithium-ion battery, (3) GPS and cellular antennas, (4) a global SIM card, and (5) optional barometer and temperature sensors. The students practiced estimating the operational time for the custom system based on their choices for data sampling and transmission frequency. Figure 3 displays a block diagram of the code for the electronics.
|
|
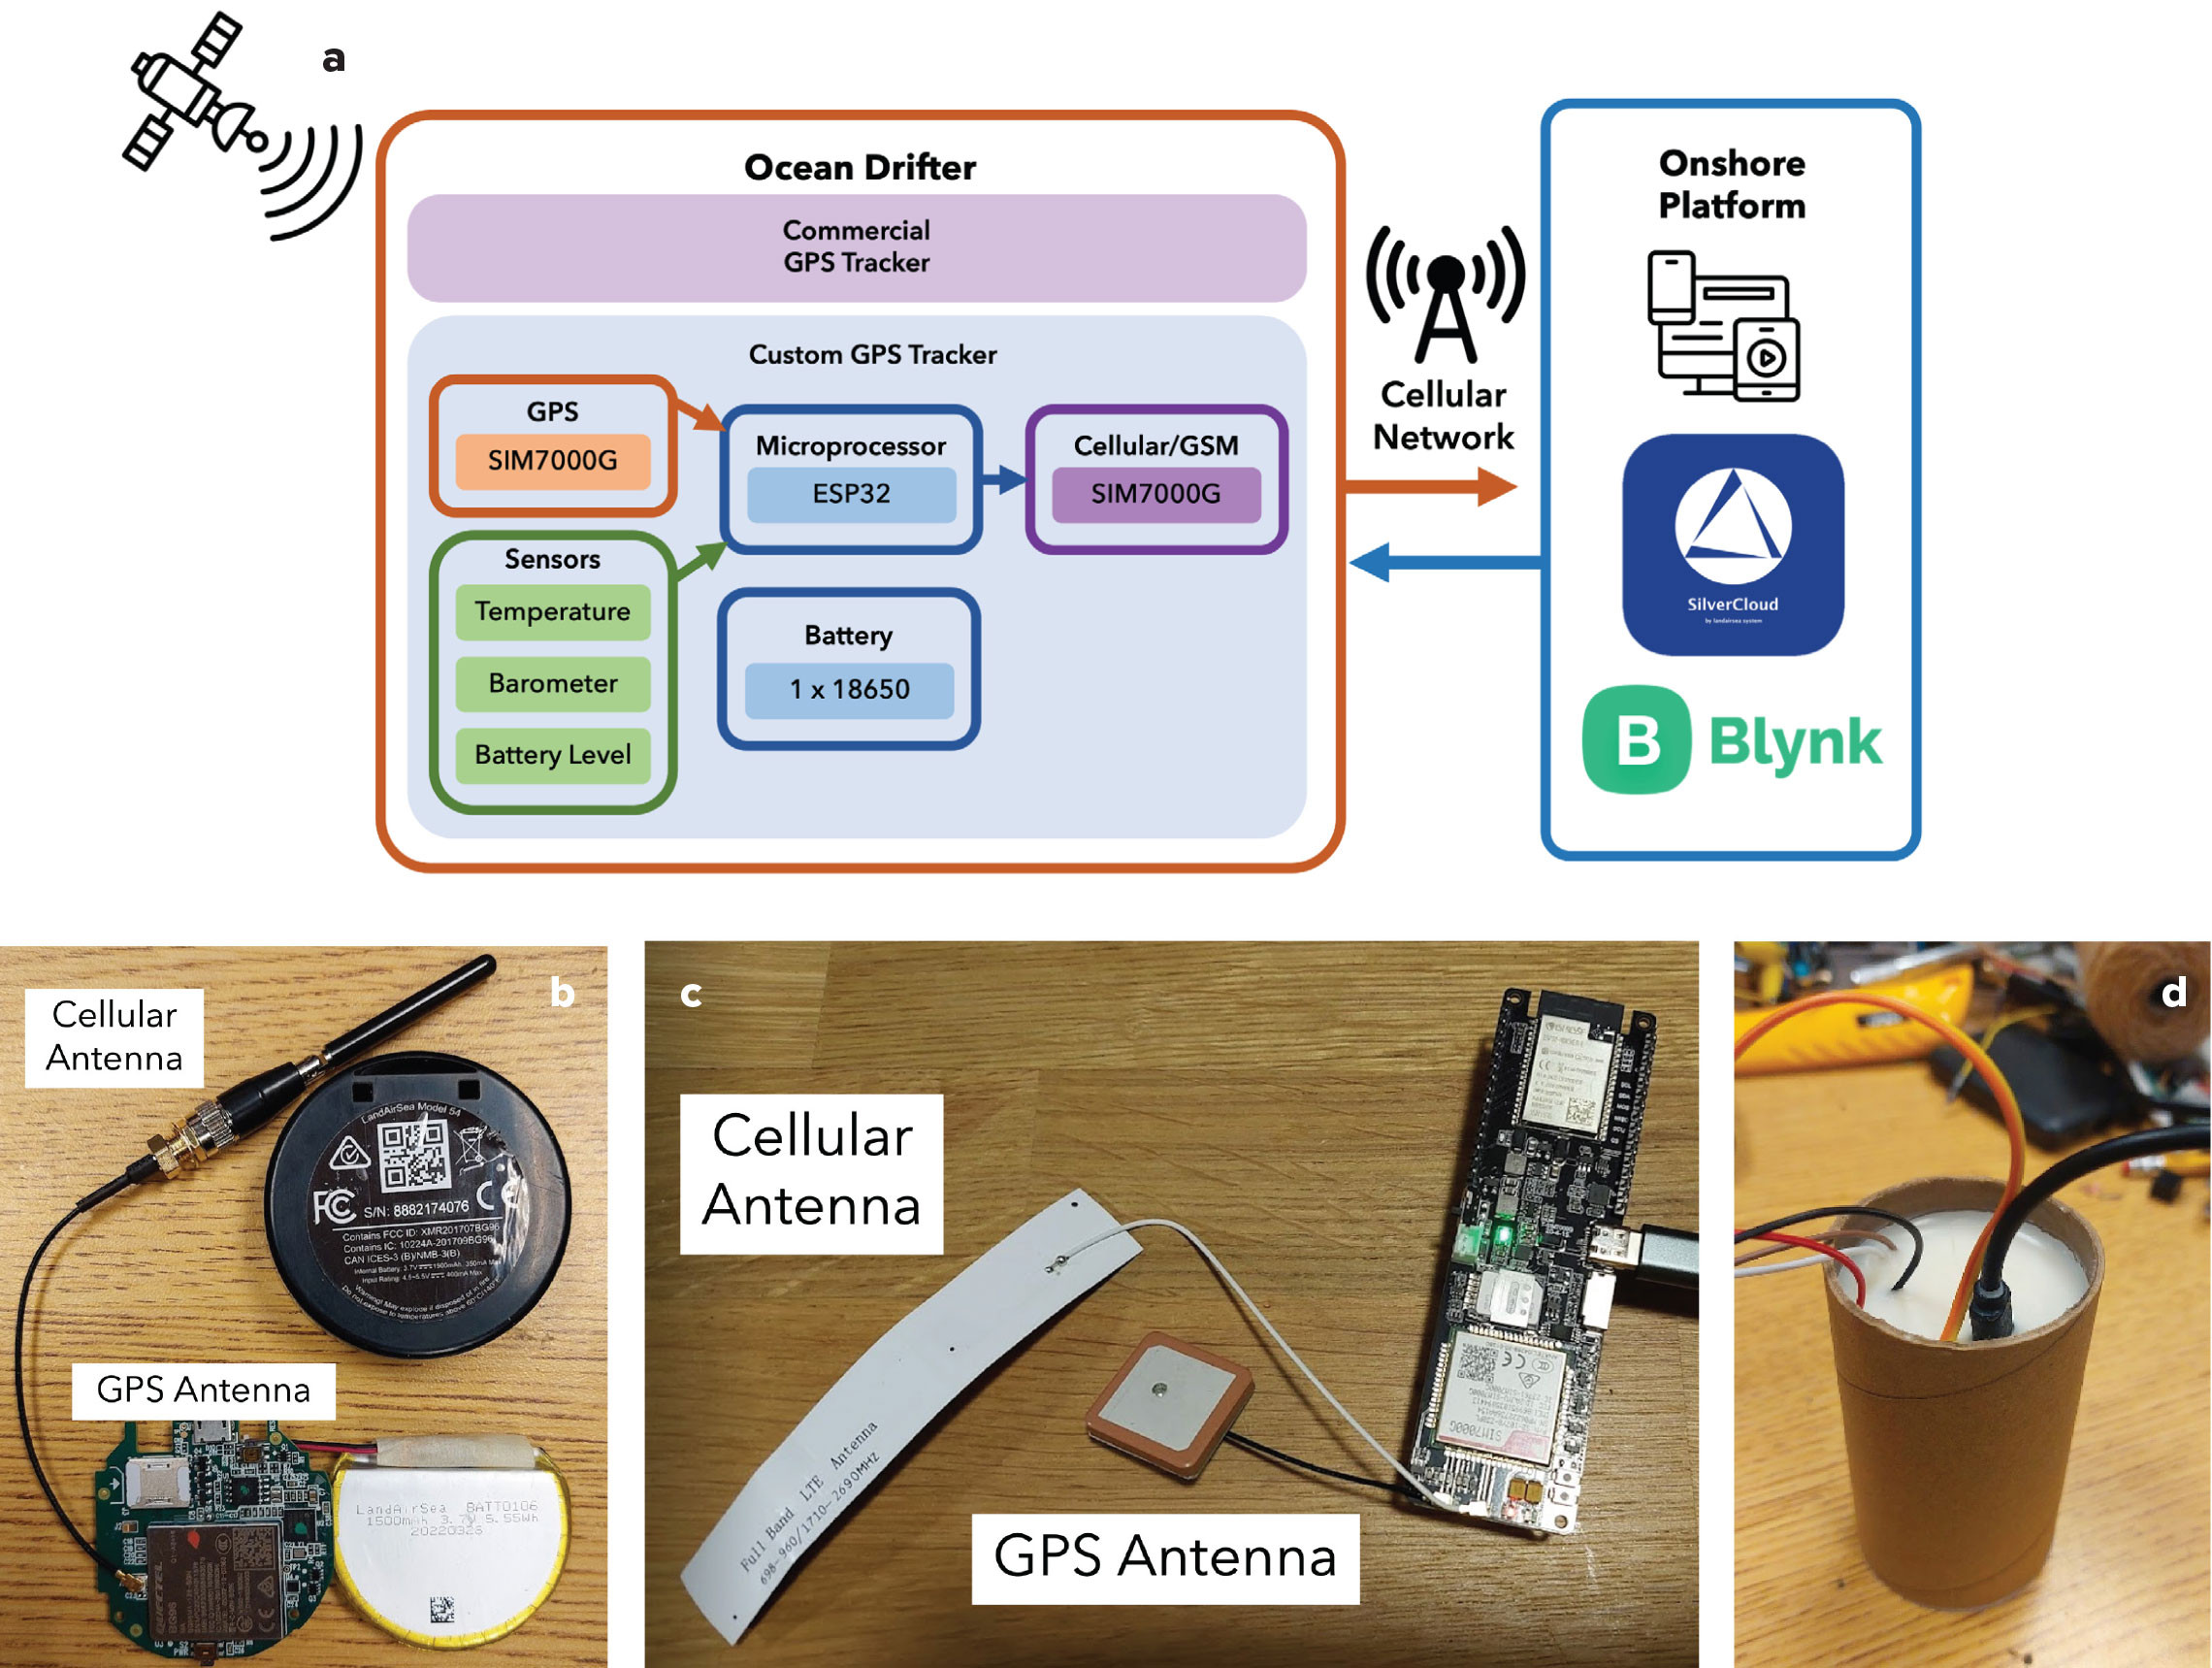
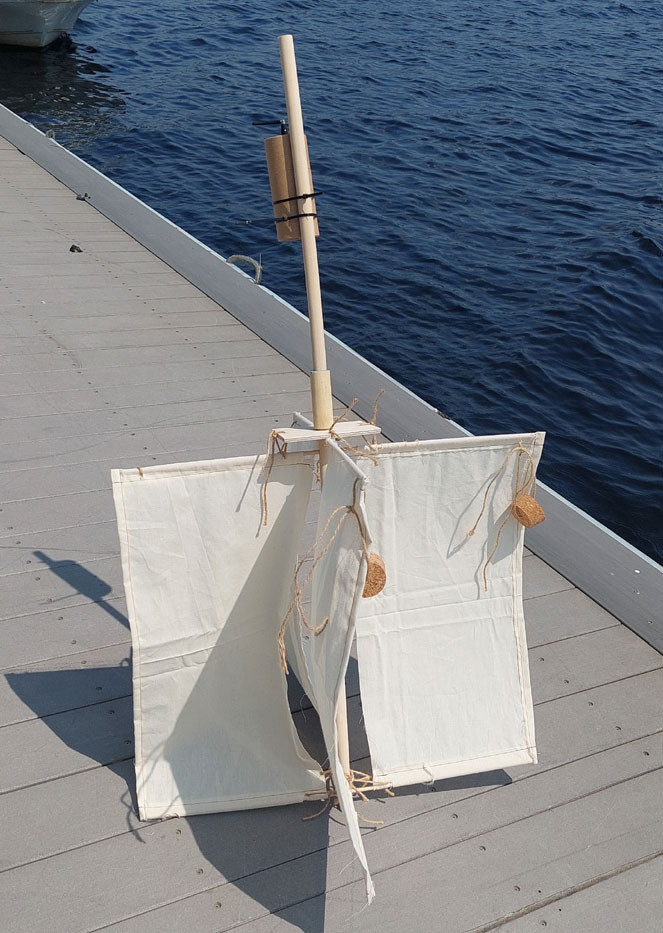
The electronic stack was enclosed in a bamboo container coated with water-resistant shellac resin (Figure 3). This housing was designed to keep the electronics dry during splashing and brief submersion, with the expectation that it would remain at least 10 cm above the waterline for most of the deployment. To improve waterproofing, students could use coconut wax to protect electronics, excluding antennas.
Field Application
Student Design and Deployment
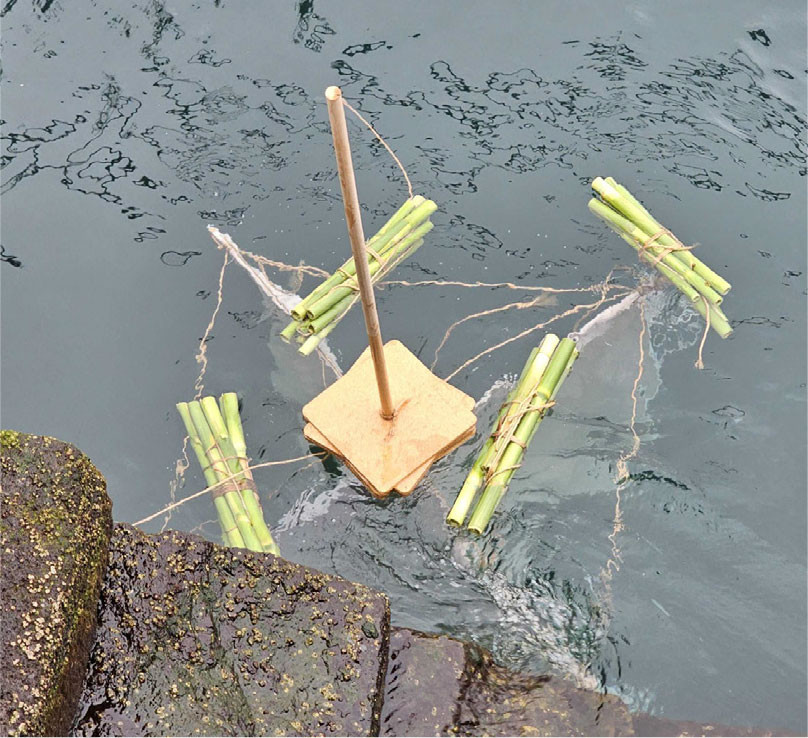
The seven teams (six student teams and one instructor team) explored various design approaches, varying the size and shape of the drogue (cross-shaped vs. square-shaped), the drogue depth (ranging from just below the surface to 15 m deep), and the placement and distribution of weights and buoyant materials. Additionally, some students incorporated store-bought coconut shells and locally sourced cane as supplementary buoyancy materials (Figure 4). During testing, they adjusted buoyancy by modifying the float and weight, checked the drifter’s ability to self-right after capsizing (Figure 5), and validated both the commercial and the custom GPS tracking systems.
|
|
|
|
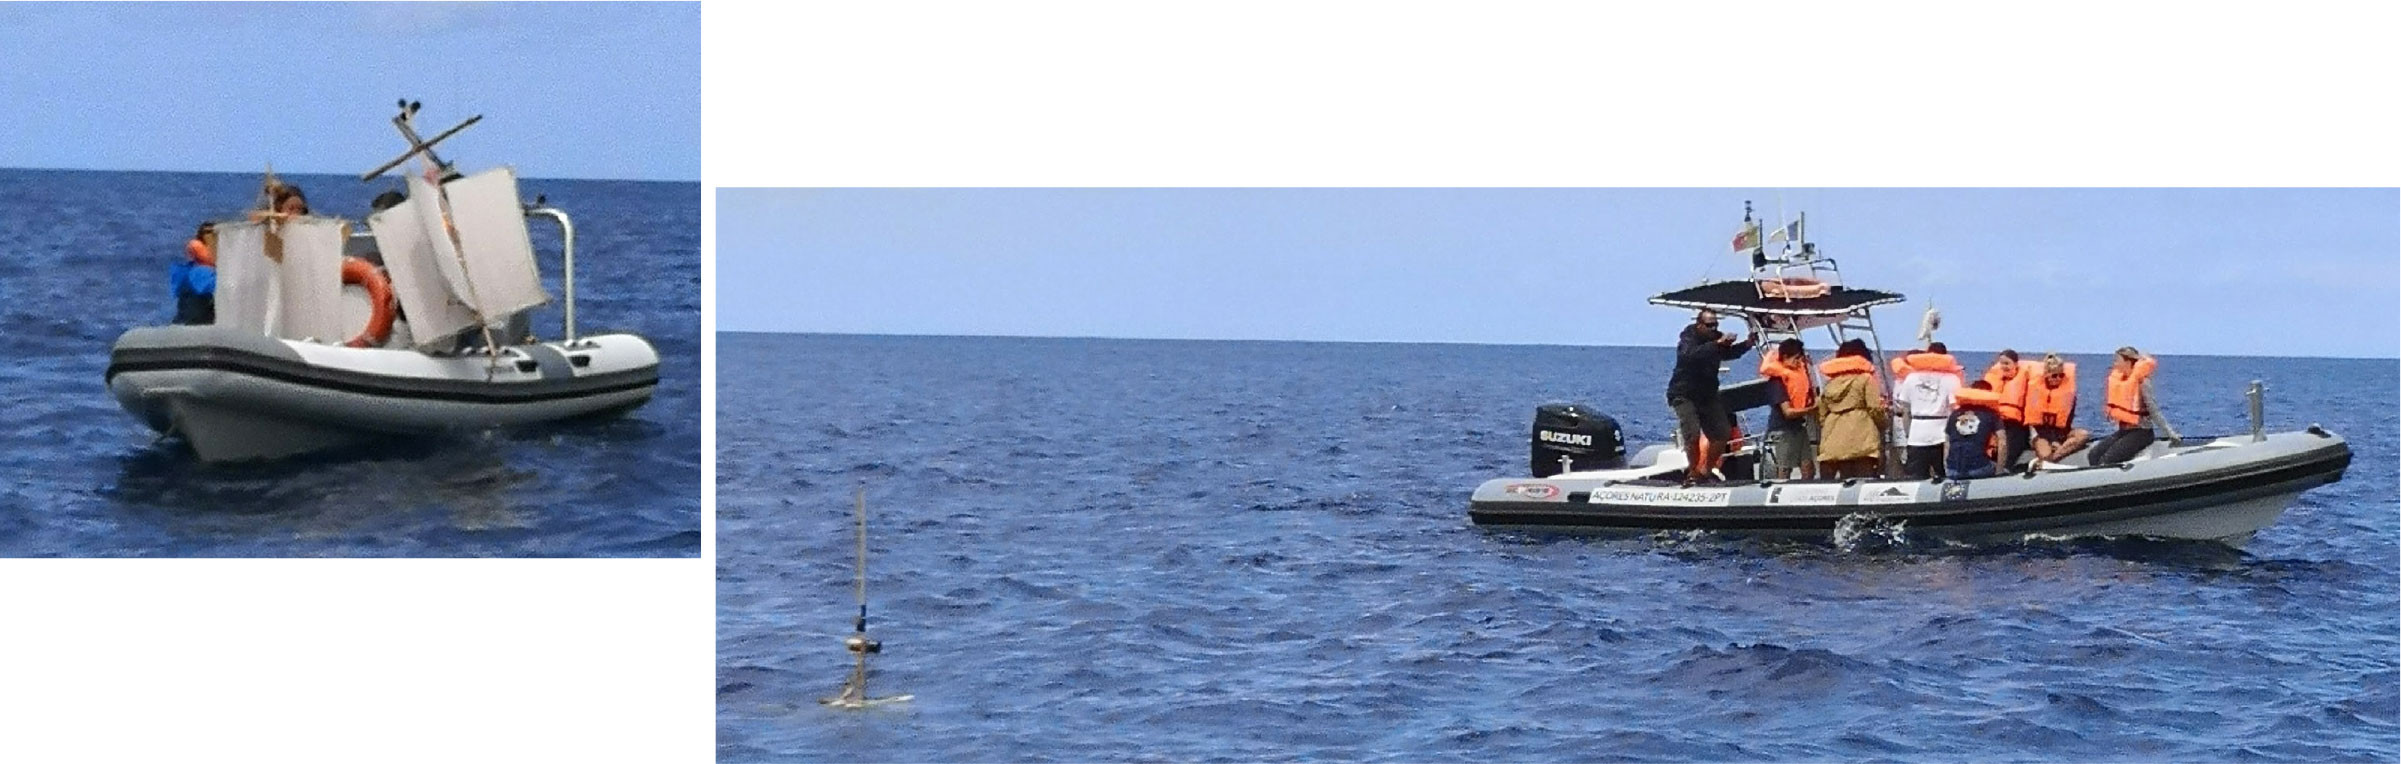
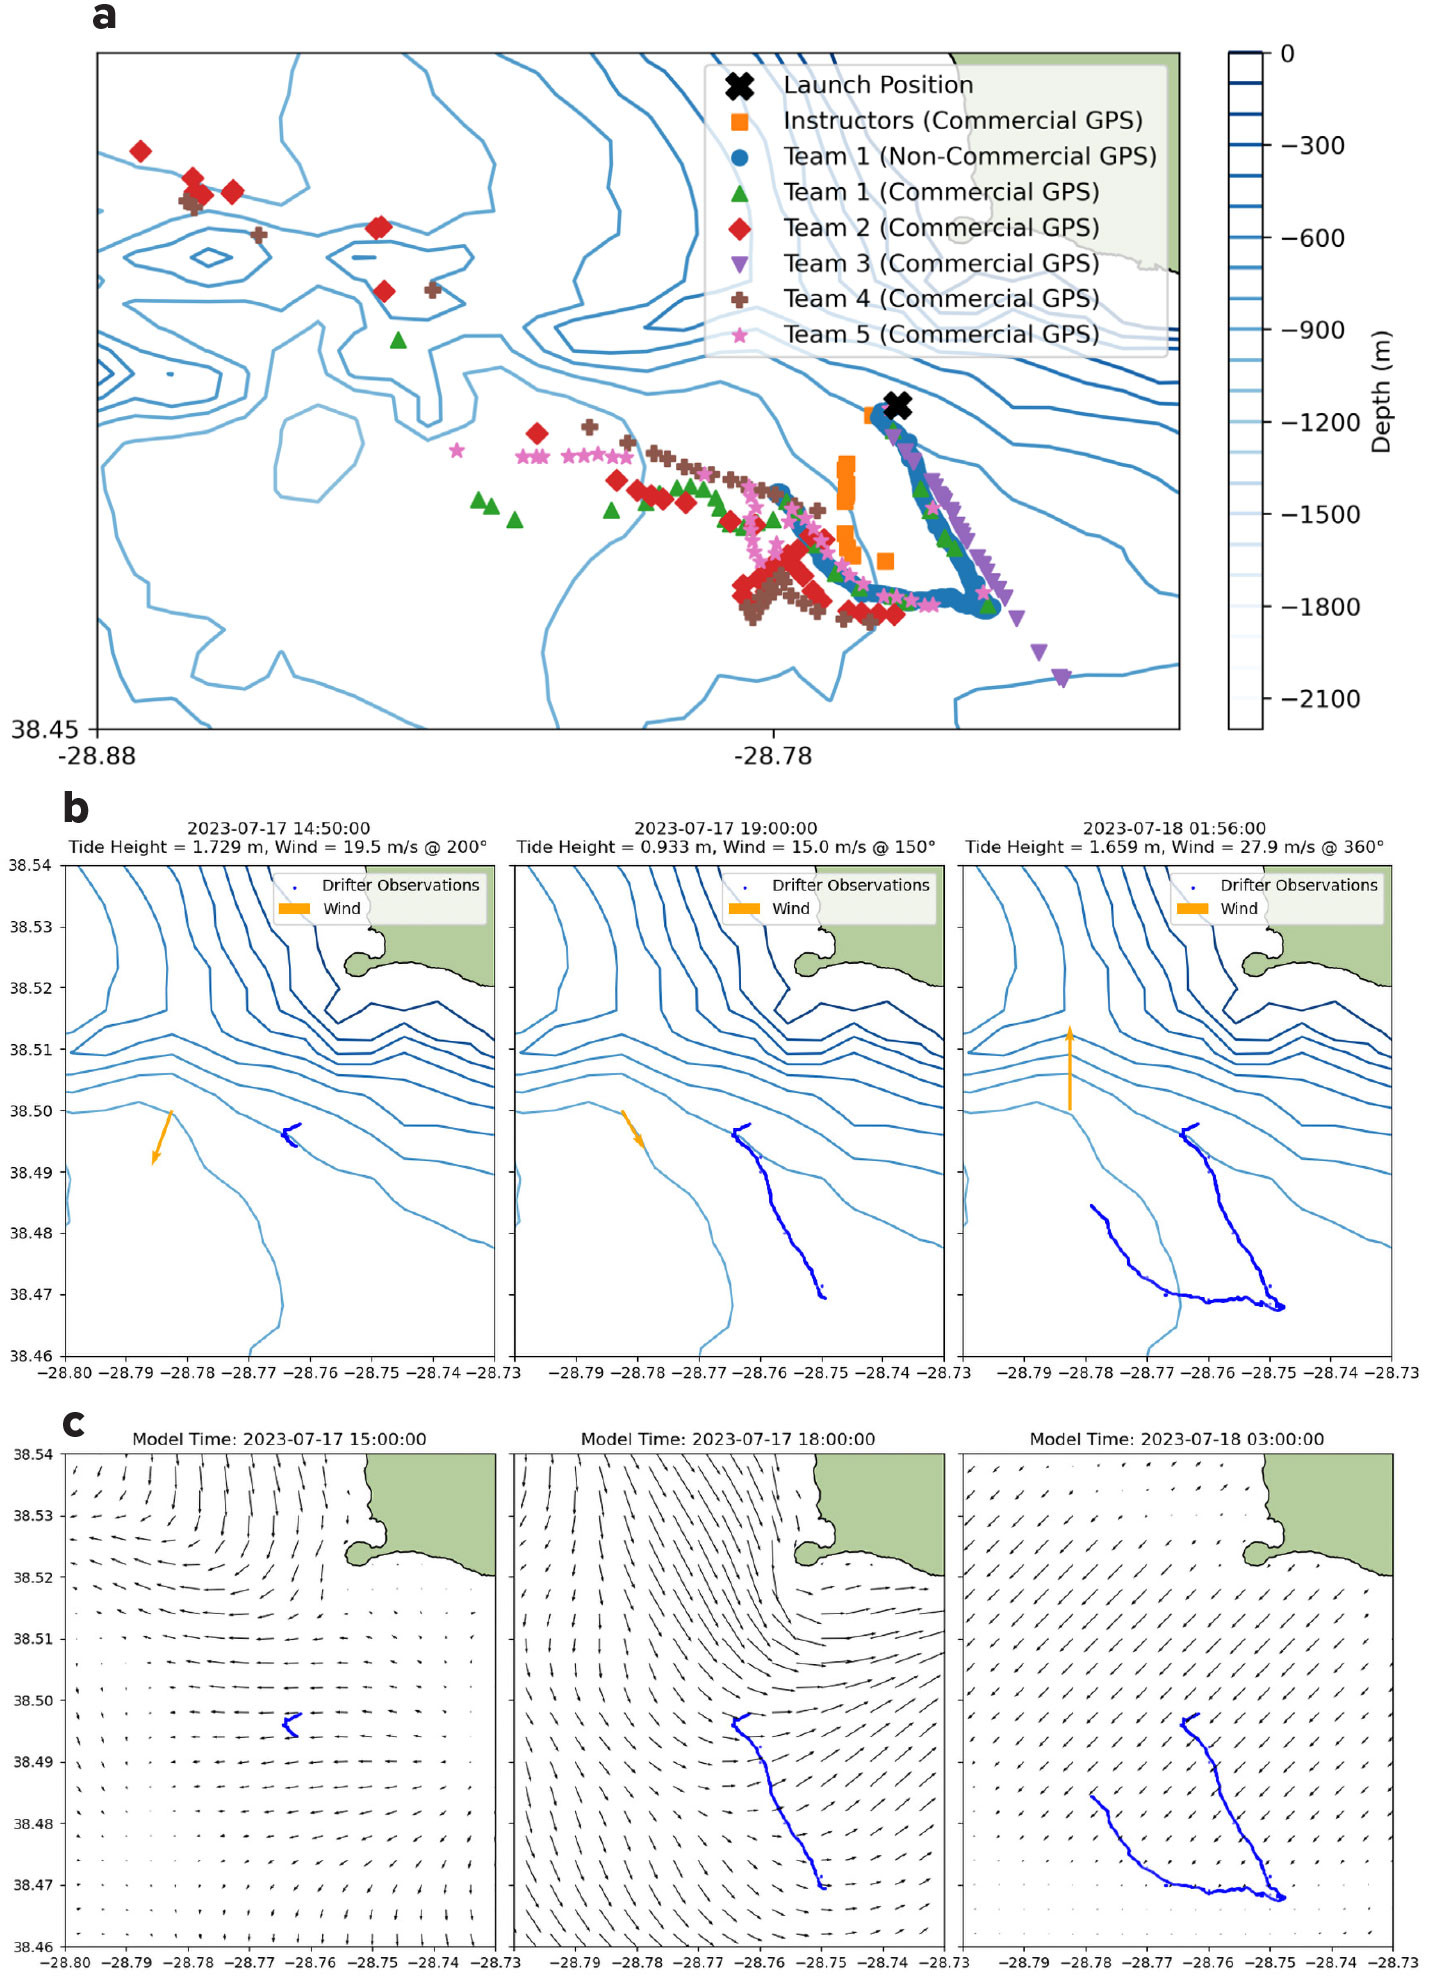
The drifters were deployed nearly simultaneously from the same location along the coast of Faial Island, Azores, Portugal, with photos of the deployment from the boat shown in Figure 6. The drifters communicated for 12 to 36 hours before being lost at sea, with the furthest transmission recorded at approximately 11 km from the initial drop-off point. The loss could be attributed to the drifters traveling beyond the range of the LTE-M signal, a mechanical failure that caused them to sink, or an electrical short circuit due to water breach.
|
|
Data Analysis
In the final step, students analyzed the drifter observations and compared them to local bathymetry, wind forecasts, and tides. They accessed oceanographic data through the Copernicus Marine Environment Monitoring Service archive, which provides comprehensive global and regional datasets of ocean currents, sea level, and meteorological variables. In the following analysis, the bathymetry was obtained from EMODnet Bathymetry Consortium. Students also accessed wind data from Windy.com, but these data get deleted after one year. Here, we used surface wind observations from the NOAA Integrated Surface Database (ISD) provided through SENSOTO, which contains hourly mean wind speed (m s–1) and wind direction (°), measured at the Horta station (WMO ID: 085050-99999; 38.52° N, 28.72° W) near Horta Airport. This station is the closest meteorological site to the drifter launch point. The teams were also introduced to the operational numerical model engine, MOHID Water System, from +ATLANTIC CoLAB (Neves, 1985; Santos, 1995). This platform uses a system of models to cover the Azores archipelago with different resolutions by downscaling the Copernicus Marine Global model. The MOHID modeling systems also provide an accurate estimate of the local tides.
Figure 7a shows the GPS observations of the deployed drifters. The Team 6 drifter was never able to record any measurements, and some drifters lost GPS connection earlier than others. Only Team 1 collected data from both GPS units, confirming close agreement. The non-commercial unit sampled at a faster rate. In general, most of the drifters followed similar patterns. The drifter built by the instructors had a drogue depth of 15 m, which may explain its different trajectory at the start of the release. The drifter from Team 3 had a larger surface area protruding out of the water, which may explain why it deviated from the other trajectories, potentially being more strongly carried by wind.
Figure 7b,c shows the location of the drifter from Team 1 with the non-commercial GPS at three timestamps. Figure 7b shows the position over a contour plot of the bathymetry with an orange arrow denoting the wind speed and direction and the tide height listed in the panel header. In Figure 7c, the position is shown over the flow field obtained from the +Atlantic CoLAB MOHID model. While the temporal resolution of the model is low (one snapshot every three hours), it is still a helpful tool for estimating the trajectory of the drifter and teaching students about data assimilation.
|
|
Possible Modifications
Course Modifications
Most student designs were variations of the example drifter introduced during the course. To encourage greater diversity in design, we recommend presenting multiple example drifters. Additionally, we suggest documenting and evaluating how design differences affect water-following performance. Increasing testing opportunities at the deployment site would also be beneficial; for instance, teams could deploy multiple drifters over several days to better track current patterns. To further engage students, they could be challenged to select their own deployment locations and develop, then validate, current models using their drifter data (Champenois et al., 2025). Finally, the curriculum could be enhanced by including a lesson focused on assessing and quantifying uncertainty in both measurements and models.
Drifter Design Modifications
Incorporating environmental sensors, such as those measuring salinity, temperature, and pH, into the drifter’s custom electronic stack can capture a broader range of oceanographic data, which helps contextualize drifter trajectories and contributes to understanding ocean processes. Switching to a commercial satellite-based GPS tracker removes the 4G network range limitation, providing much larger coverage at a higher cost. Achieving longer deployments (>1 week) would require a significant redesign, focusing on a more durable frame and drogue, extended battery life, and a robust communication system. Because this would involve more permanent materials and a higher cost, drifter retrieval should also be considered.
Ocean Drifter Development as a Teaching Tool
We developed and tested a curriculum to teach undergraduates and graduate students in oceanography and engineering about ocean sensor design, ocean sensing, and ocean hydrodynamics. The project challenged students to design, build, and deploy an ocean drifter for measuring near-surface ocean currents, as well as analyze and compare the measured data. The hands-on curriculum was paired with lectures on oceanography, marine robotics, and ocean monitoring. Understanding the movement of drifters required students to engage with the Lagrangian perspective, in which sensors follow the flow, as they tracked drifter trajectories to study how ocean currents transport material, in contrast to the Eulerian perspective that observes stationary points. This hands-on experience helped them explore real-world processes such as dispersion and mixing in coastal environments—concepts central to physical oceanography.
Students faced several challenges, including limited opportunities for at-sea testing and deployment due to weather and ocean conditions. Additionally, limitation in materials and tools restricted each team to building just one drifter. This single deployment meant students launched their final designs under conditions that were different from any prior testing. Specifically, winds and currents were stronger at the deployment location than they were in the protected harbor used for initial testing. This project revealed several challenges with remote sensing in marine environments. Drifters with higher buoyancy tended to maintain GPS signal transmission longer by better protecting electronics from wave impacts. While most drifters followed similar trajectories, those with deeper drogues or larger surfaces exposed to wind diverged, illustrating design impacts on current-following performance. The custom GPS units may have failed due to degradation of the water-resistant shellac coatings and coconut wax potting from saltwater and wind erosion.
The construction and design process was largely student-driven, with instructors checking in regularly to ensure that teams stayed on track. For many students, this was their first time deploying equipment at sea. Instructors provided support by guiding them through the deployment process, logistics, and design considerations for launching from a boat. In the second week, an additional lecture on ocean modeling was introduced, which enabled students to analyze how their drifters’ movements were influenced by ocean phenomena.
The design challenge proved to be an engaging and educational experience for the students. In the course evaluation, one student shared: “It was a great experience to learn material outside of my degree classes. I feel like I have a much more holistic understanding of marine robotics now that I understand oceanography and some marine biology.”
Acknowledgments
This publication was made possible by the support of the Marine Robotic Summer School, a collaborative initiative by the MIT Portugal Program (MPP), LSTS – Underwater Systems and Technology Laboratory from Faculty of Engineering – University of Porto (FEUP), and the Instituto de Investigação em Ciências do Mar – OKEANOS of the University of the Azores. The program was further supported by CoLab +ATLANTIC, the Gaspar Frutuoso Foundation, the School of the Sea of the Azores, Luso-American Development Foundation (FLAD), and Marinha Portuguesa. The summer school was held under the High Patronage of the Regional Government of the Azores. The authors thank Professor Douglas Hart for mentorship and feedback. This work was supported by the Portuguese Foundation for Science and Technology (FCT) under the MIT Portugal program and by the National Science Foundation Graduate Research Fellowship (Grant No. 2141064).