INTRODUCTION
Globally, biological dinitrogen (N2) fixation provides the majority of bioavailable nitrogen (N) to the ocean, with additional contributions from atmospheric deposition, river runoff, and submarine groundwater discharge (SGD; Figure 1). These processes contribute to the inventory of bioavailable N in the forms of nitrate (NO3–), nitrite (NO2–), and ammonium (NH4+), as well as particulate and dissolved organic N (PON and DON, respectively), all of which are considered “fixed” N.
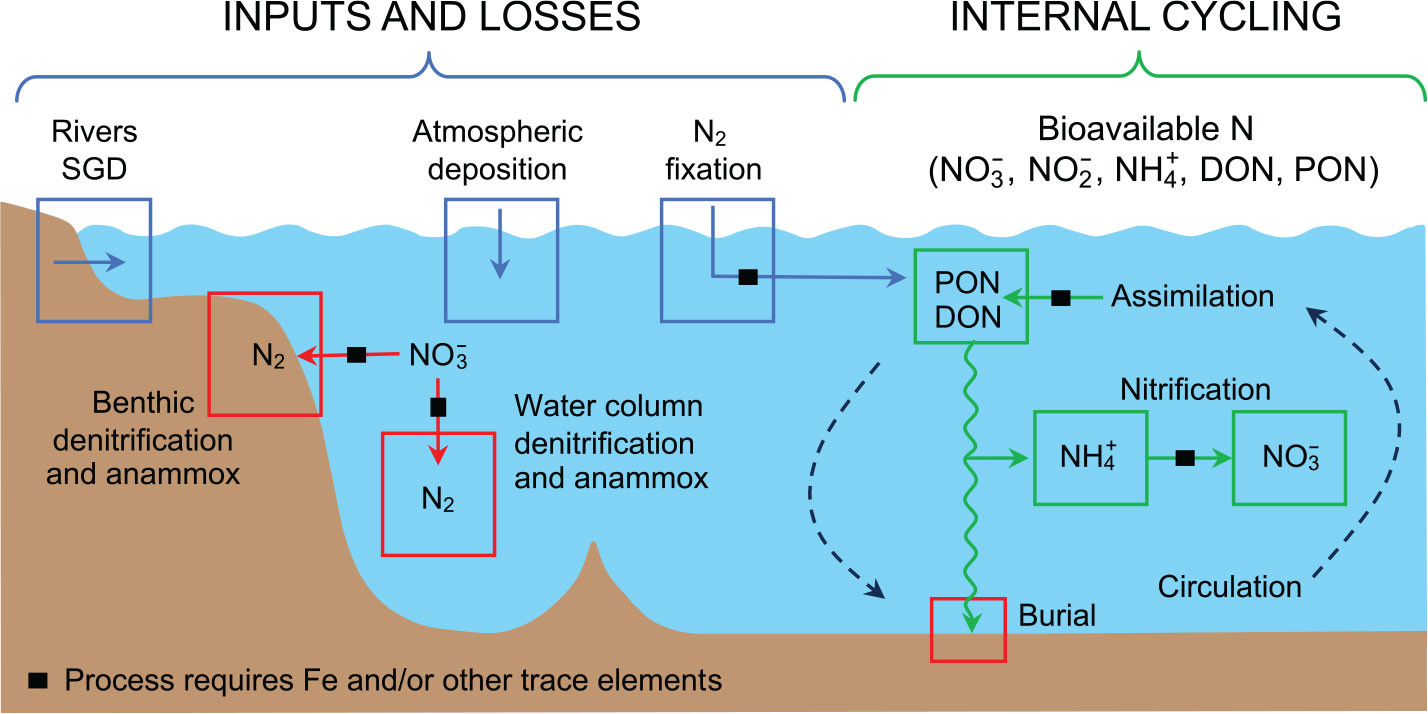
FIGURE 1. Schematic of the marine nitrogen cycle showing the major fixed N inputs (blue arrows) of rivers, submarine groundwater discharge (SGD), atmospheric deposition, and N2 fixation; losses (red arrows) via benthic and water column denitrification and anammox and organic N burial; and internal cycling processes (green arrows) of assimilation, ammonification, and nitrification. Processes requiring iron (Fe) and/or other trace metal cofactors are indicated with black squares overlaid on the arrows. Ocean circulation is represented with dashed arrows. Figure modified with permission from Fitzsimmons and Conway (2023). > High res figure
|
Bioavailable N is cycled among these forms through assimilation processes whereby inorganic and dissolved organic forms of N are incorporated into biomass (PON), and the reverse, whereby PON is degraded to DON and ammonium (Figure 1). Reduced N in the forms of ammonium and DON can then be oxidized to nitrite and nitrate through nitrification, which produces nitrous oxide (N2O) as a byproduct (Stein, 2019; Wan et al., 2023). Alternatively, uptake of these reduced forms of N by primary producers supports regenerated production, which is defined as phytoplankton growth using N sourced from within the sunlit (euphotic) zone (Dugdale and Goering, 1967). By contrast, new and export production are fueled by N supplied to the euphotic zone via N2 fixation, atmospheric deposition, fluvial inputs, laterally transported organic nutrients, and/or upward transport of nitrate from the aphotic zone (Dugdale and Goering, 1967; Eppley and Peterson, 1979; Figure 1).
Nitrogen loss occurs through N2 production via the processes of denitrification and anaerobic ammonia oxidation (anammox) in anoxic sediments and water parcels (Figure 1). Because N2 is not widely bioavailable, its production is considered a loss of bioavailable N from the marine environment. The burial of organic N that escapes degradation in the water column and shallow sediments is the other main loss of bioavailable N from the water column. Of these, benthic denitrification is perhaps the largest sink for bioavailable N, although estimates of N loss range widely and are a key uncertainty in the marine N budget (Gruber and Sarmiento, 1997; Brandes and Devol, 2002; Codispoti, 2007; DeVries et al., 2013; Wang et al., 2019).
The N cycle is unique among marine elemental cycles in being primarily driven by biological processes. As described above, the main inputs and losses of bioavailable N, as well as its internal cycling, rely on the activities of specialized microbial metabolisms. The enzymes that catalyze N oxidation and reduction reactions can be some of the most abundant proteins in the global ocean (Saito et al., 2020), and because they rely on metal cofactors at their active sites (Morel and Price, 2003), their activity can be limited by trace metal availability (Morel et al., 2020). A classic example is the limitation of nitrate assimilation in high-nutrient, low-chlorophyll regions by low iron availability (Martin et al., 1991). Iron is also required for enzymes involved in N2 fixation, as well as some steps of nitrification (Wei et al., 2006; Ferguson et al., 2007; Shafiee et al., 2019), denitrification (Zumft, 1997), and anammox (Kartal and Keltjens, 2016) (Figure 1). Thus, the utilization of nitrogenous substrates for assimilation or energy generation can be affected not only by the availability of those substrates but also by the availability of trace metals for enzyme activity (Morel et al., 2020; Rafter, 2024, in this issue). Understanding the distribution of processes involved in the marine N cycle and budget is thus aided by considering trace metal availability in the environment.
Nutrient Stoichiometry
Accurate estimates of N inputs and losses are necessary for a first-order constraint on the oceanic N inventory, which has implications for better understanding ocean fertility and climate. The quantities of fixed N supply to and loss from the ocean have been widely explored through the distributions of nitrate and phosphate (PO43–) concentrations, which are routinely measured on oceanographic expeditions. Combining these nutrient measurements to compute the tracer N*, typically defined as [NO3–] – 16 × [PO43–], has been instrumental in mapping and quantifying N2 fixation and N loss in the Atlantic and Pacific Oceans (Gruber and Sarmiento, 1997; Deutsch et al., 2001). Subsequently, surface distributions of P*, typically defined as [PO43–] – [NO3–] ÷ 16 (Deutsch et al., 2007), have been used to diagnose regions that may favor N2 fixation, where positive P* values indicate the availability of PO43– in excess of stoichiometric N requirements (Deutsch et al., 2007; Moore et al., 2009). The surface layer convergence of P* computed by ocean circulation models has also been used to quantify N2 fixation, by attributing the consumption of excess PO43– to N2 fixation (Deutsch et al., 2007; Wang et al. 2019). These estimates provide some of the most spatially integrated evaluations of basin-scale N input and loss but are sensitive to locally significant atmospheric and riverine inputs, as well as internal cycling through variations in the N:P ratio of nutrients incorporated into and released from organic matter (Arrigo, 2005; Mills and Arrigo, 2010; Martiny et al., 2013; Wang et al., 2019; Liang et al., 2023). Further, in regions where N2 fixation and denitrification may both impact nutrient ratios, those signals counteract each other, leading to a net effect that diminishes the signal of both N input and N loss in inorganic nutrient distributions (Sigman et al., 2005; Yoshikawa et al., 2015). These limitations can be overcome by complementary measurements of biogenic N2 distributions (Chang et al., 2010; DeVries et al., 2012), instantaneous production rates (Moore et al., 2009; Yoshikawa et al., 2015; Shao et al., 2023), and stable isotope ratios (see below).
Isotopic Systematics
The N and oxygen (O) isotope ratios in nitrate (15RNO3 and 18RNO3, respectively) provide an alternate view of nitrate input, loss, and internal cycling in the ocean. The mean ocean nitrate δ15N, δ15N (‰) = (15RNO3/15RN2 – 1) × 1,000, where 15RN2 is the N isotope ratio of N2 in air, is around 5‰ (Sigman et al., 2000), set by the balance between the input of N with a low δ15N from N2 fixation and the isotopic fractionation imposed by N loss via denitrification (and anammox) in the water column and marine sediments (Brandes and Devol, 2002). Water column denitrification, in particular, causes a large increase in nitrate δ15N for a given amount of nitrate consumed, whereas benthic denitrification causes relatively little change in nitrate δ15N (Cline and Kaplan, 1975; Brandes et al., 1998). There has also been recent recognition of a role for isotopic fractionation during nitrate consumption in the Southern Ocean in modulating mean ocean nitrate δ15N (Fripiat et al., 2023). The mean nitrate δ18O, δ18O (‰) = (18RNO3/18RVSMOW – 1) × 1,000, where 18RVSMOW is the O isotope ratio in Vienna Standard Mean Ocean Water (VSMOW), is approximately 2‰ (Casciotti et al., 2002; Sigman et al., 2005). In contrast to mean ocean nitrate δ15N, this mean δ18O value is predominantly controlled by nitrification, which adds O atoms to the nitrate pool, and nitrate assimilation, which removes them (i.e., internal N cycle processes; Sigman et al., 2005; Rafter et al., 2013). Water column denitrification plays a lesser role in setting the average deep ocean nitrate δ18O because it represents a smaller global flux than nitrate assimilation, which is the dominant sink for nitrate O isotopes. Measurements of nitrate δ15N and δ18O thus allow overlapping N cycle processes to be disentangled, often through their difference as the tracer Δ(15–18) = δ15N – δ18O (Sigman et al., 2005; Rafter et al., 2013).
For example, during nitrate assimilation and denitrification, the O isotopes in nitrate are fractionated to approximately the same extent as the N isotopes, so that the δ18O and δ15N of the nitrate pool rise in a ratio of 1:1 as consumption proceeds (Casciotti et al., 2002; Granger et al., 2004, 2008, 2010; Karsh et al., 2012; Rohde et al., 2015). As a result, these processes lead to no change in nitrate Δ(15–18) (Rafter et al., 2013). In contrast, the remineralization (via ammonification and nitrification) of PON yields nitrate with a δ15N that roughly equals that of the PON being regenerated while its δ18O is set by nitrification, which incorporates the δ18O of seawater (typically ~0‰) plus an isotopic offset of ~1.1‰ (Sigman et al., 2009; Buchwald et al., 2012; Marconi et al., 2015, 2019; Boshers et al., 2019). When nitrification occurs coincident with partial nitrate assimilation, the δ18O of the combined (i.e., partially assimilated plus newly nitrified) nitrate pool initially increases while its δ15N is unaltered, leading to a decline in Δ(15–18) (Wankel et al., 2007; Sigman et al., 2009; Rafter et al., 2013; Fawcett et al., 2015). While the remineralization of newly fixed N can also cause nitrate Δ(15–18) to decline, this change is due to a stronger decrease in nitrate δ15N than δ18O (Knapp et al., 2008; Rafter et al., 2013; Marshall et al., 2023). As such, the influence of N2 fixation on nitrate isotopes can be separated from that of coupled partial nitrate assimilation and nitrification (Fawcett et al., 2015; Marshall et al., 2023). By investigating the regional- and basin-scale distributions of nitrate δ15N and δ18O (Figure 2), we aim to understand the balance of processes affecting the N inventory. More background on nitrate isotope applications in the ocean is available in the original literature and recent overviews (Casciotti, 2016b; Sigman and Fripiat, 2019). Here, we aim to illustrate how major questions in marine N cycle research have been informed by basin-scale measurements of nitrate isotopes, such as: what are the rates and controls on the N inputs and losses that govern the marine N budget on a global scale, and what are the dominant forms of and supply routes for N fueling biological production and altering the health of ecosystems? We additionally consider insights gleaned from measurements of dissolved organic nutrients and the δ15N of DON.
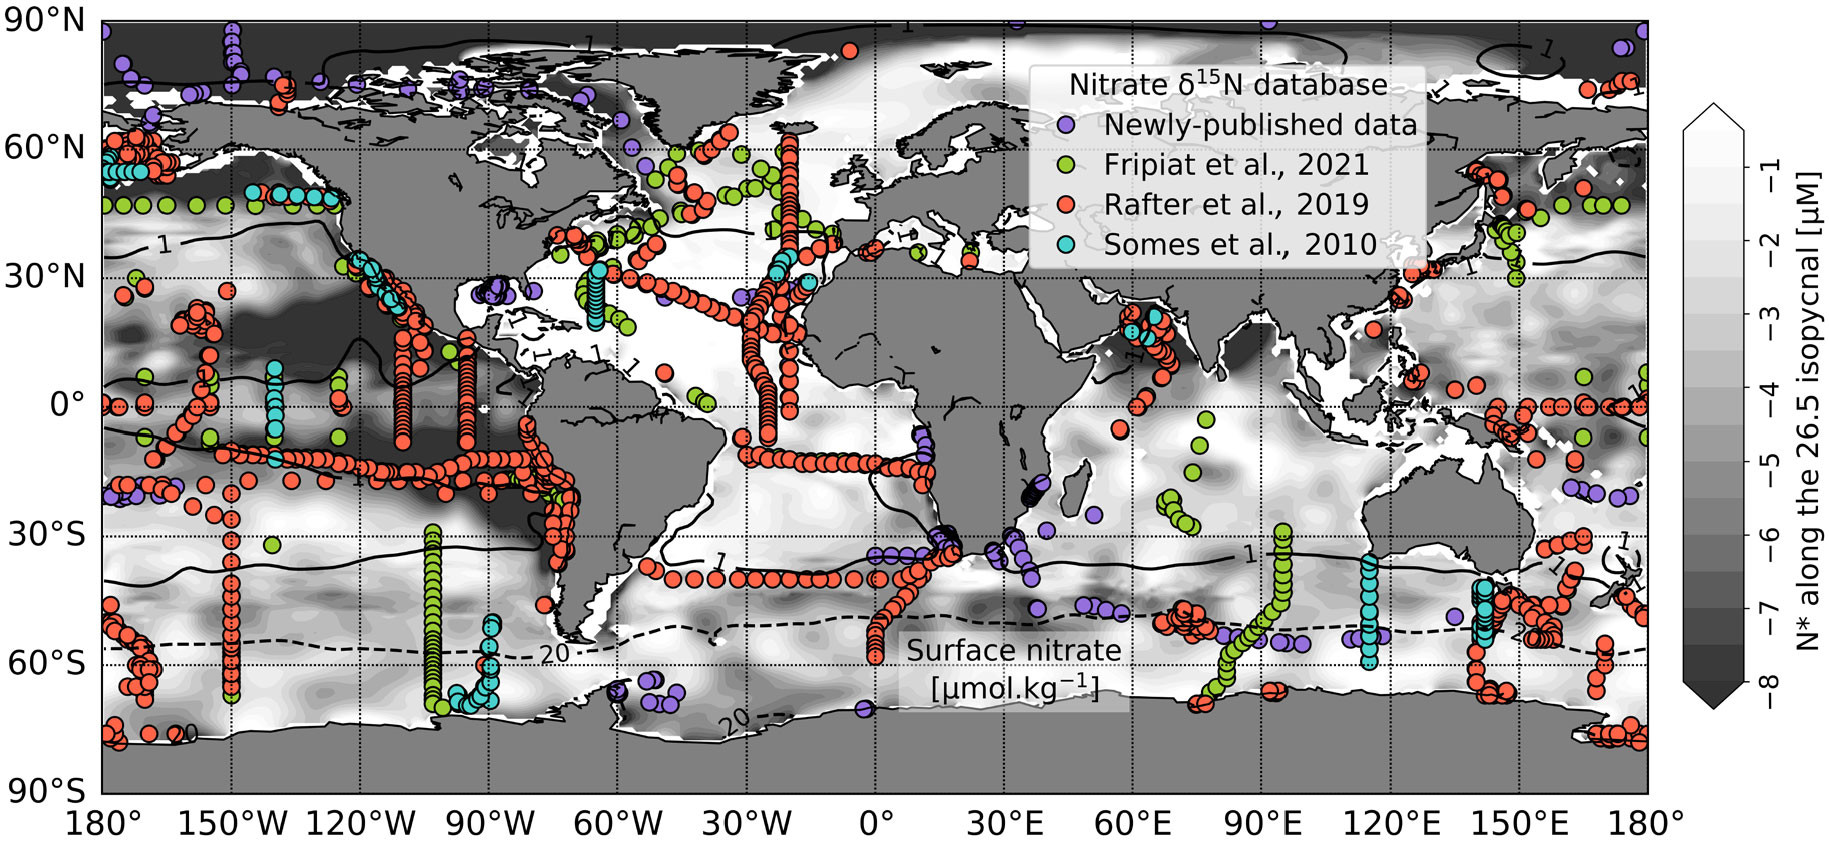
FIGURE 2. Map of the published global ocean nitrate δ15N databases from 2010 to 2024. The background color indicates N* (= [NO3–] – 16 × [PO43–]) in μM along the 26.5 kg.m–3 isopycnal, which is where some of the lowest N* signals occur in the Pacific and some of the highest in the Atlantic. The solid and dashed black contours indicate the 1 and 20 μM surface nitrate concentrations, respectively. N* and nitrate concentration data are from the World Ocean Atlas 2018 (Garcia et al., 2018). Symbol color indicates the database in which observations were first included (see legend). Supplementary Table S1 provides references for new data included in the 2024 update. > High res figure
|
NITROGEN INPUTS TO THE OCEAN
Biological N2 Fixation
Geochemical tracers such N* and nitrate δ15N provide a spatially integrative approach to identifying and quantifying N input through N2 fixation. The δ15N of Trichodesmium, a widespread tropical diazotroph, ranges from –2‰ to 0‰ (Carpenter et al., 1997; Karl et al., 1997; Montoya et al., 2002; Holl et al., 2007), which is significantly lower than thermocline and deep ocean nitrate δ15N (2‰–7‰; Figure 3; Sigman et al., 2000; Knapp et al., 2008; Rafter et al., 2013, 2019; Fripiat et al., 2021a). The remineralization of newly fixed organic matter thus lowers nitrate δ15N while raising N* by introducing nutrients with a high N:P ratio (i.e., 25:1 to 50:1; White et al., 2006; Knapp et al., 2012) relative to mean ocean N:P (i.e., ~16:1; Redfield et al., 1963).
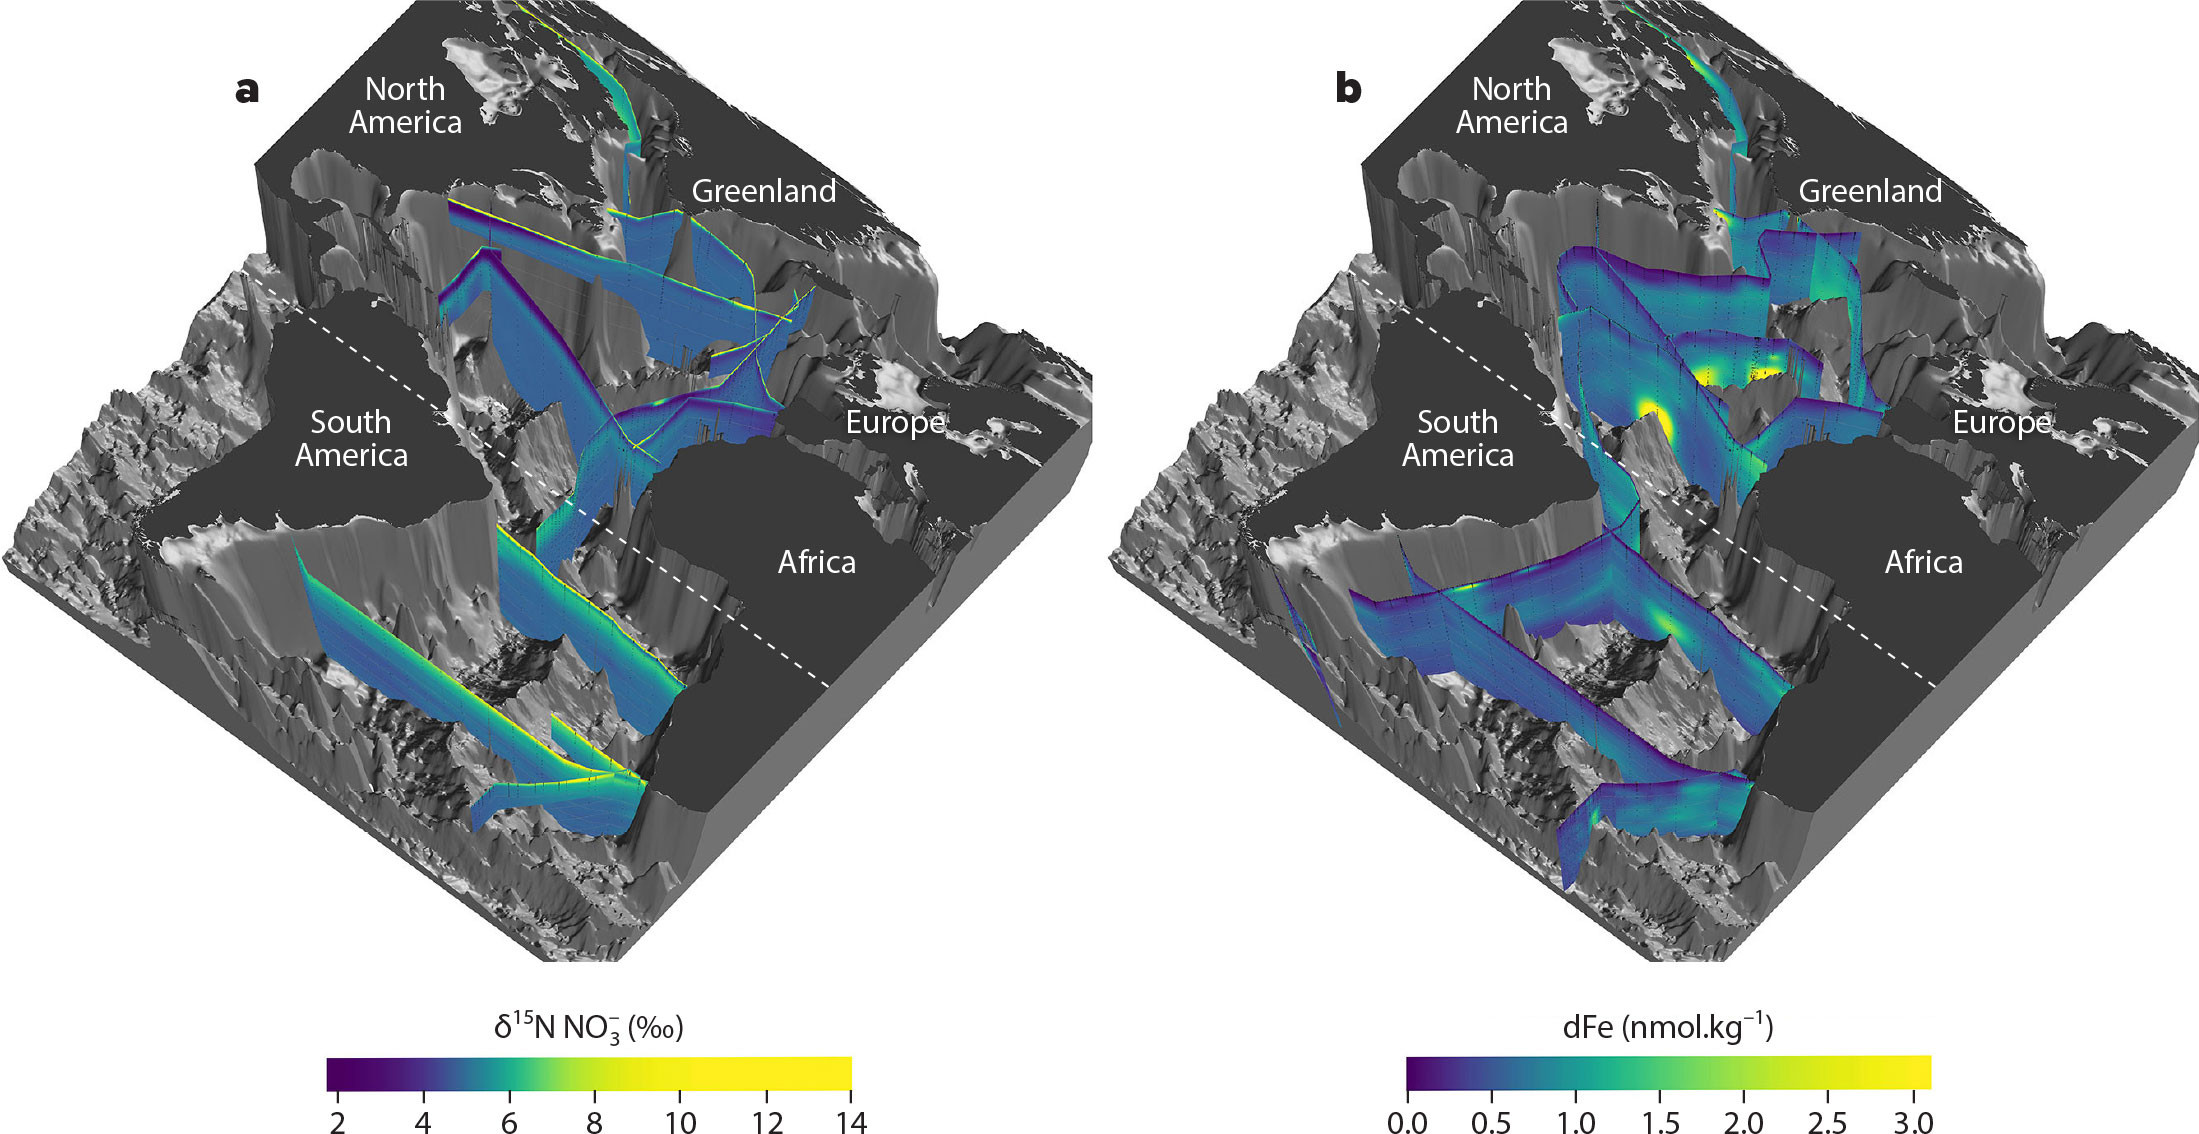
FIGURE 3. Three-dimensional visualization of (a) nitrate δ15N (‰ vs. air), and (b) dissolved iron (dFe; nmol.kg–1) in the Atlantic Ocean. In each panel, low values are shown in blue and high values are shown in yellow. Nitrate δ15N data in panel a were obtained from the locations shown in Figure 2 (Somes et al., 2010; Rafter et al., 2019; Fripiat et al., 2021b), and the dissolved iron data from the same region (panel b) are from GEOTRACES IDP2021v2 (GEOTRACES Intermediate Data Product Group, 2023). The dashed white line indicates the equator. 3D graphics created by Reiner Schlitzer, Alfred Wegener Institute. > High res figure
|
N2 fixation rates can be estimated by coupling these geochemical tracer distributions with information on ocean circulation. Inferred estimates of N2 fixation that rely on N* necessarily involve assumptions of the N:P stoichiometry of N2 fixing (diazotrophic) and non-diazotrophic plankton. These estimates suggest that N2 fixation predominantly occurs in the warm, well-lit low latitude ocean but with zonal differences (Gruber and Sarmiento, 1997; Deutsch et al., 2007; Moore et al., 2009; Wang et al., 2019). At a global scale, higher N2 fixation rates in the Pacific (95–100 Tg N yr–1) than in the Atlantic (20–34 Tg N yr–1) and the Indian Oceans (22–27 Tg N yr–1) suggest that while N gain is greatest in the Pacific, this ocean basin is actually a net sink for N (Luo et al., 2012; Landolfi et al., 2018; Wang et al., 2019). However, gaps in global ocean nutrient distributions (e.g., the South Atlantic and much of the Indian Ocean) as well as observed temporal and spatial variability in organic matter N:P ratios (White et al., 2006; Martiny et al., 2013; Liang et al., 2023) leave open the possibility for new insights into the rates and distribution of N2 fixation, particularly in the Southern Hemisphere.
The addition of isotopic measurements to basin-wide transects has provided new insights into the distribution of N2 fixation in the global ocean. For example, some of the first efforts to combine nitrate δ15N data from a transect in the western subtropical North Atlantic with an ocean model yielded a whole Atlantic N2 fixation rate of 15–24 Tg N yr–1 (Knapp et al., 2008). This N isotope-based estimate is remarkably consistent with one based on N* and volume fluxes from transects across the Atlantic, of 15–21 Tg N yr–1 (Moore et al., 2009). Notably, these geochemical signals (δ15N and N*) manifest most strongly in the thermocline, where remineralized products accumulate (Figure 2), and integrate over the spatial and temporal scales of that water mass, so they do not necessarily represent in situ rates. For example, the low-δ15N nitrate observed in the Sargasso Sea thermocline is largely representative of a basin-wide N2 fixation signal rather than incidences of local N2 fixation (Knapp et al., 2008; Marconi et al., 2015).
In addition, the thermocline nitrate concentration affects the δ15N signal. In the North Atlantic along the cross-basin GEOTRACES GA03 transect (35°N, 70°W to 18°N, 15°W), a strong positive correlation was observed between the concentration and δ15N of thermocline nitrate, with both parameters decreasing from east to west (Figure 3; Marconi et al., 2015). The authors concluded that the low nitrate concentration at the top of the thermocline acts to focus the low δ15N signal deriving from the regeneration of newly fixed N, such that the observed zonal decrease in thermocline nitrate δ15N does not require a coincident increase in the N2 fixation rate. Quantification of the meridional flux of nitrate δ15N and N* across multiple zonal transects of the Atlantic Ocean has also revealed that N2 fixation predominantly occurs in the tropical Atlantic between 11°S and 24°N (Marconi et al., 2017b).
In the subtropical South Pacific (~17°S) and South Indian (~32°S) Oceans, zonal transects of nitrate δ15N and/or N* suggest that N2 fixation occurs largely in the western subtropics and is negligible to the east (Grand et al., 2015; Yoshikawa et al., 2015), consistent with regional studies from the boundaries of both basins (Knapp et al., 2016a, 2018; Bonnet et al., 2017, 2023; N. Lehmann et al., 2018; Forrer et al., 2023; Marshall et al., 2023). N2 fixation also appears to be limited in the central subtropical South Atlantic (Moore et al., 2009) and South Pacific (Peters et al., 2018b) where iron availability (Figure 3b) and the aeolian iron supply to surface waters are low (Jickells et al., 2005; Mahowald et al., 2009). This notion is borne out by existing nitrate isotope sections that do not show a pervasive signal of low δ15N nitrate in the subtropical South Atlantic thermocline between 35° and 40°S (Figure 3a; Tuerena et al., 2015; Marconi et al., 2017b). However, across the tropical South Atlantic (~12°S), signals of N2 fixation are apparent in the Angola Gyre in the east, yet not in the west (Marshall et al., 2022) (Figure 4a). These zonally heterogeneous distributions of N2 fixation across the low latitudes suggest that N2 fixation may not occur as homogeneously as some models predict, and more importantly, that the controls on N2 fixation are dependent on regional P and iron availability, as discussed below.
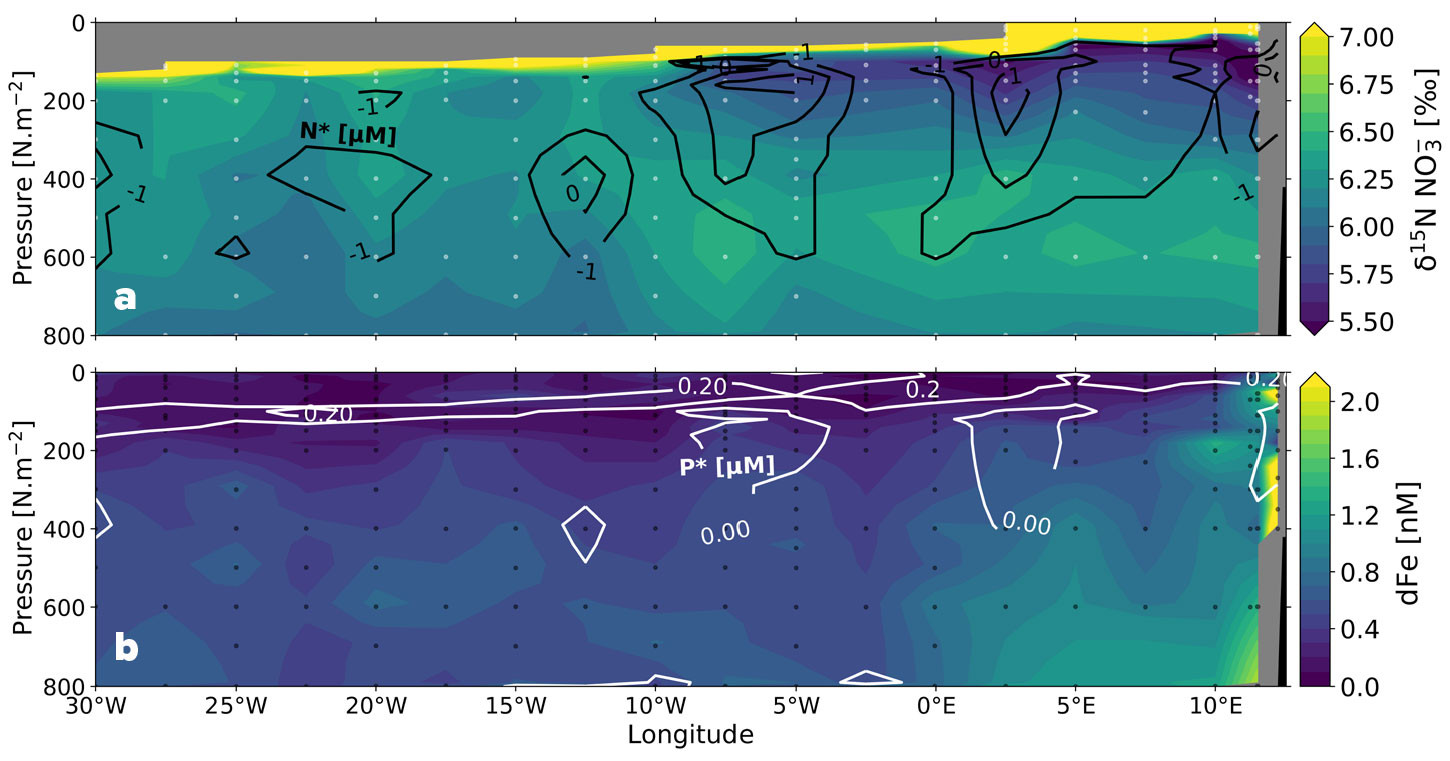
FIGURE 4. Zonal depth sections across the tropical South Atlantic Ocean (CoFeMUG along ~11°S) of (a) nitrate δ15N (‰ vs. air) with black contours indicating N* (= [NO3–] – 16 × [PO43–]) (μM), and (b) dissolved iron (dFe, nM) with white contours indicating P* (= [PO43–] – [NO3–] ÷ 16) (μM) (Noble et al., 2012; Marconi et al., 2017b; Marshall et al., 2022). On panel a, low-δ15N nitrate and elevated N* in the Angola Gyre thermocline (east of 10°W, 50–400 m) both signal N2 fixation, neither of which are apparent in the western portion of the CoFeMUG transect. On panel b, elevated dissolved iron concentrations supplied by the margin overlap with elevated surface P* in the Angola Gyre; the coincidence of these two conditions appears to favor N2 fixation. > High res figure
|
Converging Controls on N2 Fixation
Diazotrophs can be limited by both iron and P (Berman-Frank et al., 2001; Mills et al., 2004; Held et al., 2020). Large-scale sampling of N2 fixation proxies (e.g., nitrate δ15N, N*, 15N incubation experiments, diazotroph abundances) coincident with measurements of dissolved iron and (in)organic P pools suggest that N2 fixation is driven by both the availability of iron and excess P. In other words, where iron is locally available, excess P is taken up by diazotrophs to fix N2 (Deutsch et al., 2007; Moore et al., 2009; Weber and Deutsch, 2014; Snow et al., 2015; Wang et al., 2019). For example, in the North Atlantic where iron is often non-limiting (Figure 3b), diazotrophs appear to use excess P (including both PO43– and dissolved organic P, DOP) to fix N2 (Dyhrman and Ruttenberg, 2006; Sohm and Capone, 2006; Orchard et al., 2010; Landolfi et al., 2015), while in the South Atlantic where excess PO43– is present, diazotrophs appear to use non-aeolian iron to fix N2 (Marshall et al., 2022; Figure 4b). In the subtropical North Pacific Ocean, elevated N2 fixation rates have recently been surmised to be jointly regulated by iron and P availability (Wen et al., 2022; Horii et al., 2023). Similarly, in the Southwest Indian Ocean, elevated N2 fixation rates coincide with an overlapping supply of aeolian and sedimentary iron and excess P (Grand et al., 2015; Chowdhury et al., 2023; Marshall et al., 2023).
Improvement in our understanding of the sources, distributions, and cycling of both iron and P over the last decade has contributed to the discovery of new regions of N2 fixation (Zehr and Capone, 2020). For many years, dust deposition was considered the only quantitatively important source of iron to the ocean, with other iron sources thought to contribute negligibly to the euphotic zone (Mahowald et al., 2005). More recently, however, non-aeolian iron sources (e.g., oxygenated and anoxic ocean sediments, hydrothermal vents, and sea ice) are increasingly being recognized as quantitatively important (Tagliabue et al., 2010, 2022; Conway and John, 2014; Rijkenberg et al., 2014; Resing et al., 2015; Fitzsimmons et al., 2017; Jenkins et al., 2020; Homoky et al., 2021; Fitzsimmons and Conway, 2023), including for alleviating regional diazotroph iron limitation (Bonnet et al., 2023). In concert, our understanding of P cycling, and its utilization by diazotrophs, has improved, aided by an expanding DOP database (Liang et al., 2022b).
The three major oxygen deficient zones (ODZs; i.e., the eastern tropical North and South Pacific [ETNP and ETSP, respectively], and the Arabian Sea) have presented specific challenges to our understanding of the controls on N2 fixation using the geochemical tracers discussed above, due to the opposing effects of N2 fixation and denitrification on N* and nitrate δ15N. In these areas, the upwelling and offshore advection of iron- and P-replete (N-deplete) waters from the ODZ appear to generate ideal conditions for N2 fixation (Deutsch et al., 2007); however, the observations are inconsistent as to the importance of N2 fixation in these regions, with some studies indicating considerable N2 fixation (Capone et al., 1998; Sigman et al., 2005; Fernandez et al., 2011) and others indicating that N2 fixation rates can be exceedingly low (Turk-Kubo et al., 2014; Berelson et al., 2015; Knapp et al., 2016a). The spatial decoupling of excess P and iron availability could explain the inconsistency, with iron being more quickly depleted in nearshore waters than P, thus limiting N2 fixation despite the presence of excess P (Fernandez et al., 2011; Dekaezemacker et al., 2013; Jayakumar et al., 2017). Another explanation relates to the variable time and depth scales over which iron, P, nitrate δ15N, N*, and N2 fixation experiments integrate. For example, 15N2 fixation rates are often measured over a day or less (Montoya et al., 1996; Luo et al., 2012; White et al., 2020; Shao et al., 2023), while iron recycling can occur over days to weeks (Boyd and Ellwood, 2010; Rafter et al., 2017; Tagliabue et al., 2019) and the accumulation of newly fixed N as nitrate in the thermocline integrates over years to decades (Gruber and Sarmiento, 1997). The variability associated with P and iron limitation on N2 fixation over various spatial (i.e., intra- and inter-basin) and temporal scales suggests that iron exerts the dominant control on regional N2 fixation rates and that P in excess of N exerts the dominant control on global N2 fixation rates (Weber and Deutsch, 2014; Wen et al., 2022).
Atmospheric and Margin Influences on the Marine Nitrogen Cycle
Globally, atmospheric deposition contributes 39–90 Tg N yr–1 and river runoff contributes 11–43 Tg N yr–1 to the ocean (Duce et al., 1991; Seitzinger et al., 2010; Yang and Gruber, 2016; Jickells et al., 2017; Wang et al., 2019). Submarine groundwater discharge (SGD), while poorly constrained, likely adds fluxes of N comparable in magnitude to rivers (Santos et al., 2021). For a comprehensive review on N cycling between the atmosphere and surface ocean, including the use of geochemical tracers such as nitrate δ15N and N*, see Altieri et al. (2021).
The riverine N flux is small relative to other N sources and is also highly regional, making it difficult to quantify. In addition, at least a quarter of river-derived N fails to reach the open ocean and is instead trapped by intense recycling over the shallow continental shelves (Jickells et al., 2017; Sharples et al., 2017; Izett and Fennel, 2018). For example, Mississippi River nitrate, which has a distinct δ15N of 8‰ (Bryant-Mason et al., 2013), has not been detected in the off-shelf waters in the Gulf of Mexico (Howe et al., 2020; Knapp et al., 2022), most likely because it is consumed in nearshore waters (Rabalais et al., 1996). Nevertheless, the Amazon River has been found to enhance regional ocean productivity by supplying N, along with excess P and iron that fuel local N2 fixation (Subramaniam et al., 2008). Similarly, the Congo River margin supplies a significant flux of iron to the eastern tropical South Atlantic (Noble et al., 2012; Vieira et al., 2020) that appears to support regional N2 fixation (Sohm et al., 2011; Marshall et al., 2022).
The δ15N of nitrate and DON from river runoff and SGD are perhaps the most unconstrained N sources to the ocean, with measurements of nitrate δ15N from rivers ranging from –3‰ to 28‰ and averaging 7.1‰, and from shallow aquifers ranging from 2‰ to 27‰ and averaging 7.7‰ (Matiatos et al., 2021). Each of these sources may have distinct relationships with trace elements, but few studies include measurements of dissolved metal concentrations and nitrate isotopes, or DON and DOP concentrations and DON δ15N to constrain source relationships, especially in margin environments where multiple sources may mix. Existing datasets from nearshore regions show significant correlations between concentrations of dissolved organic matter (DOM), salinity, and/or trace metal concentrations associated with rivers and/or continental shelves (Chen et al., 2022, 2023). For example, along the oligotrophic West Florida Shelf (WFS; Figure 5a), significant correlations of DON and dissolved iron concentrations have been observed (Figure 5b; Mellett and Buck, 2020). Here, high concentrations of DON and dissolved iron in nearshore waters give way in offshore waters to lower concentrations consistent with those observed in the oligotrophic North Atlantic, i.e., ~4–5 µM DON and <1 nM dissolved iron, respectively (Knapp et al., 2011; Hatta et al., 2015). The highly correlated concentration gradients on the WFS have been interpreted as indicating common margin sources of DON and trace metals, raising questions about how DON from margin sources such as SGD may serve as a ligand for trace metals and thus impact their transfer from nearshore to offshore environments (Beck et al., 2007, 2010).
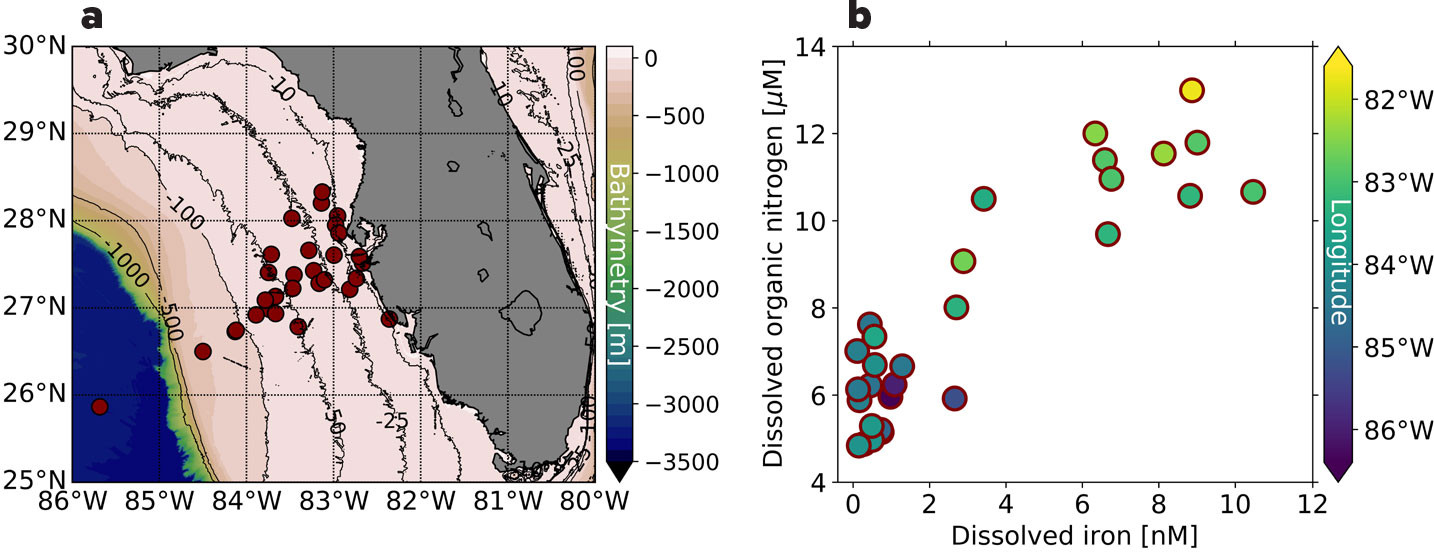
FIGURE 5. (a) Map of West Florida Shelf stations sampled in June 2015 and February-March 2018, and (b) dissolved organic nitrogen (DON, μM) versus dissolved iron concentrations (dFe, nM) at these stations, with symbol color indicating station longitude. DON is highly correlated with dissolved iron (r2 =0.89 for 2015 and r2 =0.91 for 2018). The dissolved iron data were previously published in Mellett and Buck (2020). DON was measured according to Knapp et al. (2005). > High res figure
|
Allochthonous Dissolved Organic Nutrient Fluxes
Decades of work have shown that about 20% of new production is released as DOC (Hansell and Carlson, 1998; Romera-Castillo et al., 2016), and recent work suggests similar relationships for DON (Letscher et al., 2013; Knapp et al., 2018; Zhang et al., 2020) and DOP (Liang et al., 2023). These findings are consistent with field-based incubation studies showing that DON is preferentially released by phytoplankton when grown on “new” sources of N, including nitrate (Bronk and Ward, 1999, 2000) and N2 (Capone et al., 1994; Glibert and Bronk, 1994; Bonnet et al., 2016; Knapp et al., 2016b). Observations suggest that there is net DON and DOP production in coastal and other upwelling areas, with advection of DON and DOP into the oligotrophic gyres (Letscher et al., 2013; Liang et al., 2022a) where they may be used to support a significant fraction of new and export production (Letscher et al., 2013, 2022; Knapp et al., 2018; Liang et al., 2022a, 2023).
Many of the enzymes that enable dissolved organic nutrient assimilation have metal co-factors. These include urease, which requires nickel (Dupont et al., 2008); enzymes allowing the use of primary amines and/or amino acids, which require copper (Palenik and Morel, 1991); and enzymes supporting the utilization of various forms of DOP, which require zinc, cadmium, cobalt, and/or iron (Duhamel et al., 2021). Thus, it would perhaps be unsurprising if DON and DOP distributions correlated with dissolved metal availability in the surface ocean. However, few studies of marine DOM cycling have also included measurements of dissolved trace metal concentrations, limiting our understanding of the extent to which DOM release by new production is influenced by trace metal availability. Because dissolved organic nutrients fuel a significant fraction of export production in oligotrophic gyres, our poor understanding of the controls on marine DOM production means we lack constraints on an important source of nutrients.
Additionally, while dissolved organic nutrient fluxes from ocean margins to gyres are required by models to resolve oligotrophic nutrient budgets (Torres-Valdes et al., 2009; Letscher et al., 2016, 2022), surface ocean concentration gradients have been challenging to document due to the sparse datasets for DOP, and for DON, by the poor precision of high temperature chemical oxidation measurements of its concentration (Letscher et al., 2013). New DON (Hansell et al., 2021) and DOP (Liang et al., 2022b) concentration datasets should improve our understanding of spatial distributions. Additionally, new measurements of DON concentration using higher-sensitivity wet-chemical oxidation methods paired with the analysis of DON δ15N have revealed patterns of both DON production and consumption. For example, DON consumption was inferred from its isotopic variations for the first time in the eastern tropical South Pacific (Knapp et al., 2018) and was later confirmed in the South China Sea (Zhang et al., 2020). Cross-basin sections pairing DON concentration measured by wet-chemical oxidation methods, DON δ15N analyses, and trace metal concentration and speciation measurements are now being made for some GEOTRACES and GO-SHIP transects, providing constraints on the role of trace metal availability in dissolved organic matter production and consumption.
INTERNAL CYCLING OF NITROGEN IN THE OCEAN
Nitrogen Speciation, Transport, and Uptake in the Euphotic Zone
The internal cycling of N in the ocean strongly affects the distribution of the N species and their isotopes. In this section, we focus on the imprint of the internal N cycle on the isotopes of nitrate, as this is the species predominantly measured as part of global-scale programs such as GEOTRACES. In addition, nitrate is the major subsurface source of fixed N for phytoplankton, and its residence time is longer than that of many other fixed N species such as ammonium, nitrite, and labile DON; thus, processes that alter the isotopic composition of nitrate exert a dominant control on the distribution of oceanic N isotopes. This is especially true in water masses sourced from the Southern Ocean (e.g., Antarctic Intermediate Water, AAIW; Subantarctic Mode Water, SAMW), which supply nitrate to the global thermocline (see below).
An early examination of nitrate N isotope data from samples collected along transects of the eastern Indian (WOCE I09S) and Pacific (ANT XII/4) sectors of the Southern Ocean (Sigman et al., 1999, 2000) revealed a strong negative correlation between nitrate concentration and δ15N in the surface layer. This relationship is due to the preferential assimilation of 14N-bearing nitrate by phytoplankton (i.e., isotope fractionation), which causes 15N enrichment of the residual nitrate pool relative to the immediate source of nutrients to the surface layer (Sigman et al., 1999; Altabet, 2001; Karsh et al., 2003; Lourey et al., 2003). Investigations of large-scale sections of nitrate δ15N and δ18O have revealed that nitrate assimilation is typically the dominant biological process acting on the surface nitrate pool (cyan arrow in Figure 6a), with little room for sustained in situ nitrification (Rafter et al., 2013; Marconi et al., 2015; Tuerena et al., 2015; Fripiat et al., 2019; Marshall et al., 2023). A notable exception is the Antarctic Zone of the Southern Ocean, where winter conditions are extremely unfavorable for phytoplankton growth. Smart et al. (2015) measured the dual isotopes of nitrate along WOCE line A12 between 52.0°S and 57.8°S in austral winter and found the δ18O of mixed-layer nitrate to be strongly elevated relative to its δ15N (purple arrows in Figure 6b), characteristic of in situ nitrification, with the newly produced nitrate having a δ15N of <–5‰ (i.e., set by the PON plus ammonium being remineralized) and a δ18O of +1.1‰ (Sigman et al., 2005; Wankel et al., 2007). In the Antarctic Zone mixed layer, nitrate assimilation and nitrification appear to occur dominantly in summer and winter, respectively, with the apparent wintertime rise in nitrate δ15N and δ18O toward the surface due not to assimilation but to mixing between the summer/autumn mixed layer (lower nitrate concentration, higher δ15N and δ18O) and underlying Circumpolar Deep Water (higher nitrate concentration, lower δ15N and δ18O) (Smart et al., 2015).
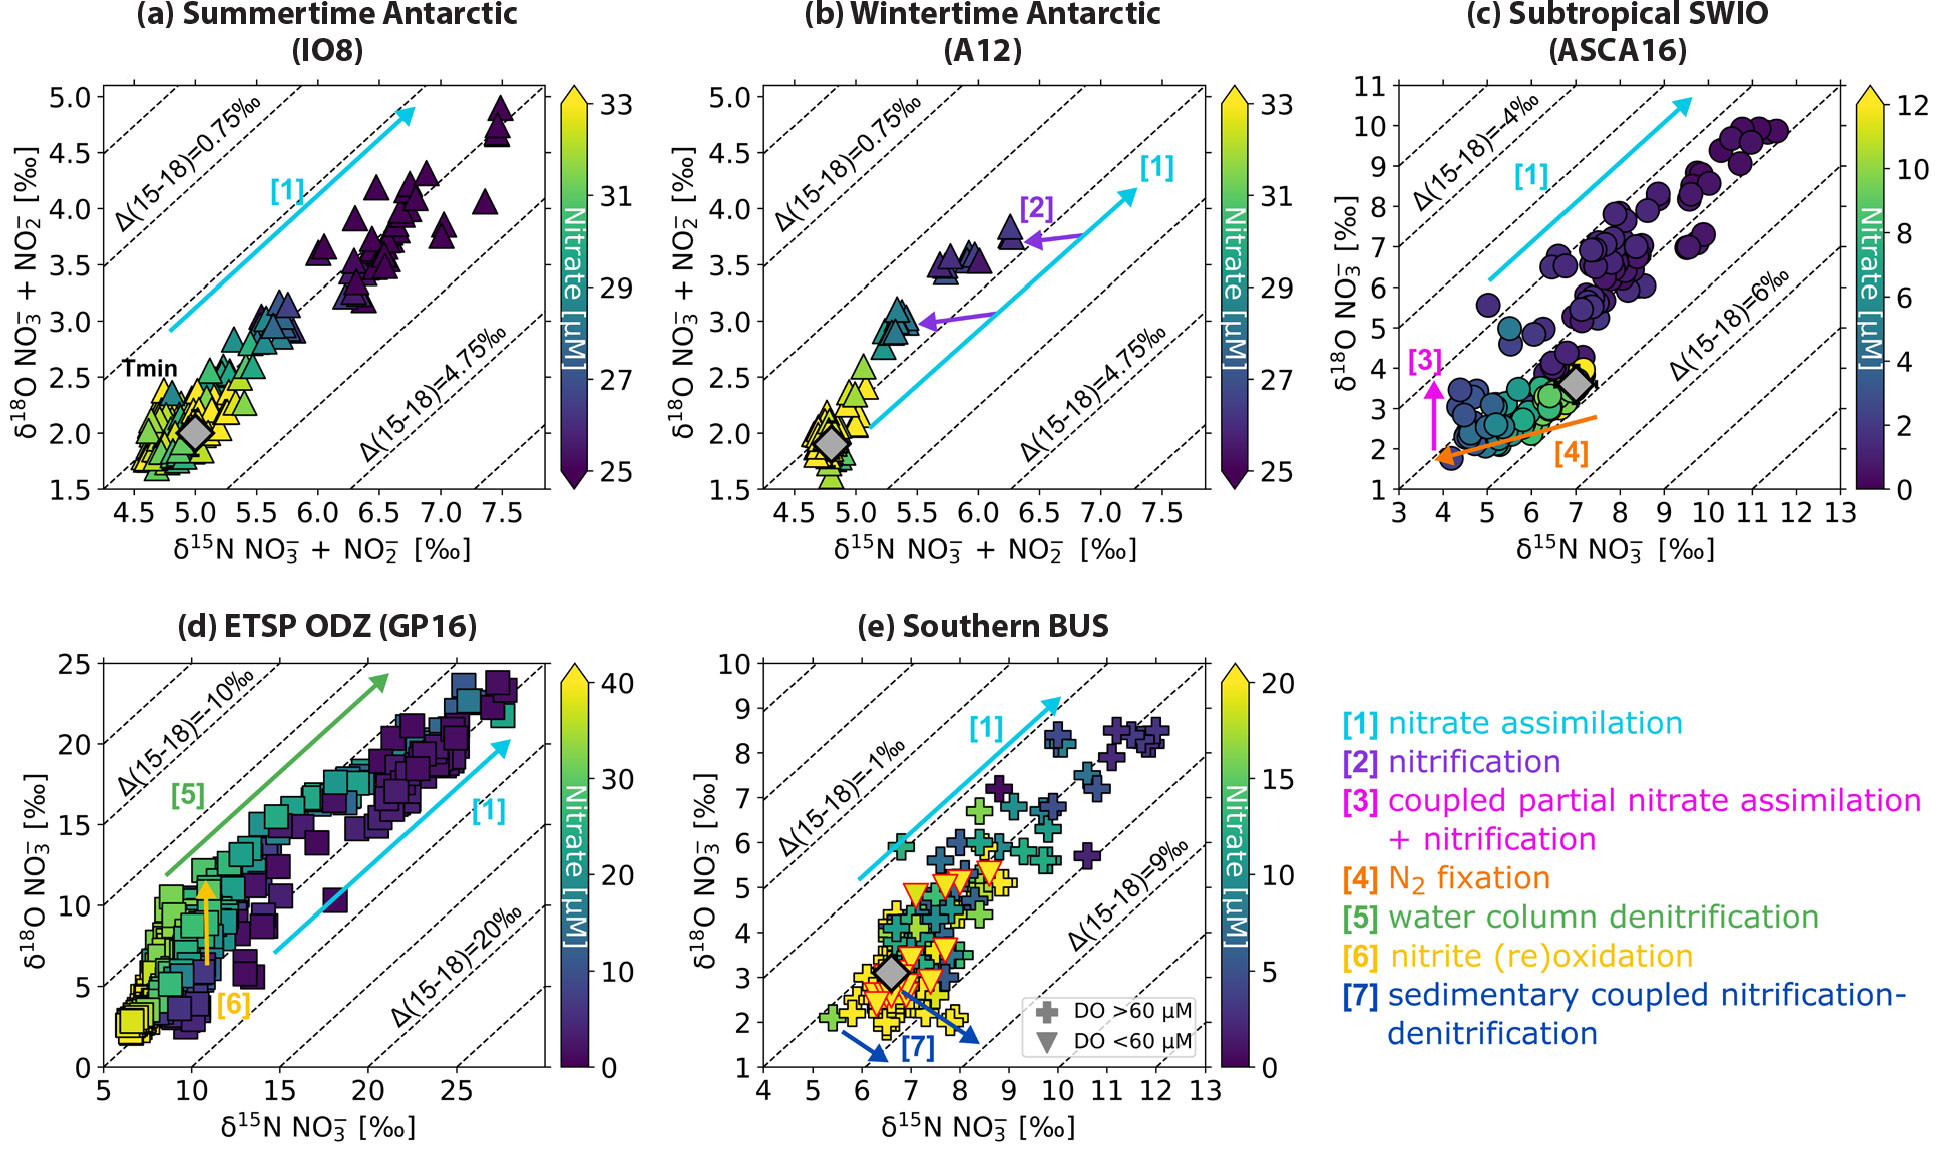
FIGURE 6. Nitrate δ18O (‰ vs. VSMOW) versus δ15N (‰ vs. air) for the (a) summertime Antarctic (IO8) (Fripiat et al., 2019), (b) wintertime Antarctic (A12) (Smart et al., 2015), (c) subtropical southwest Indian Ocean (ASCA16) (Marshall et al., 2023), (d) Eastern Tropical South Pacific (GP16) (Peters et al., 2018b), and (e) southern Benguela upwelling system (SBUS) (Flynn et al., 2020). Symbol color shows sample nitrate concentration, and the effect of the major N cycle processes on the nitrate isotopes is indicated by the arrows (see legend). Dashed contour lines show Δ(15-18) [(‰) = δ15N – δ18O] (Sigman et al., 2005; Rafter et al., 2013). The gray diamonds on panels a and b indicate the mean δ18O and δ15N of nitrate in Circumpolar Deep Water (CDW), and those on panels c and e, of nitrate in Subantarctic Mode Water (SAMW); these water masses constitute the ultimate source of nutrients to the surface layer of the Antarctic and subtropical southwest Indian Ocean and SBUS, respectively (Sigman et al., 2000; Flynn et al., 2020; Marshall et al., 2023). In panel e, samples with dissolved oxygen concentrations (DO) <60 μM are distinguished by triangles. > High res figure
|
Nitrate isotope sections are particularly powerful for investigating how N cycle processes occurring in geographically limited regions are connected via large-scale ocean circulation. Rafter et al. (2013) used measurements of nitrate δ15N and δ18O from the Pacific—CLIVAR P16S, augmented by data from 7°S to 7°N (Rafter et al., 2012) and station ALOHA at 22.75°N (Sigman et al., 2009)—to explore subsurface patterns in the nitrate isotopes, which they found to be strongly influenced by N cycle processes occurring in overlying surface waters. For instance, partial nitrate assimilation in Southern Ocean surface waters yields sinking PON that is relatively low in δ15N compared to the background nitrate. As a result, subsurface nitrate, particularly in the Subantarctic, has a low δ15N for its δ18O (Rafter et al., 2013; Fripiat et al., 2019, 2021a). The subsequent subduction and northward advection of the partially assimilated surface nitrate in AAIW and the less dense SAMW means that thermocline nitrate sourced from the Southern Ocean is relatively high in δ15N (Sigman et al., 2000, 2009; DiFiore et al., 2006; Rafter et al., 2013; Marconi et al., 2015). The upward supply and consumption of this high-δ15N nitrate in the low-latitude surface yields sinking PON that is as high or higher in δ15N than the subsurface water mass into which it is remineralized, causing the δ15N of subsurface nitrate to be elevated relative to its δ18O (Rafter et al., 2013). This trend is eroded in the western Pacific, North Atlantic, and southwest Indian subtropical gyres where the remineralization of low-δ15N material causes the δ15N of thermocline nitrate to decrease considerably more than its δ18O (Bock et al., 1989; Knapp et al., 2008; Rafter et al., 2013; Marconi et al., 2015, 2017b; Forrer et al., 2023; Marshall et al., 2023). In nitrate δ18O versus δ15N space, N2 fixation drives thermocline nitrate towards a δ15N of –1‰ and δ18O of +1.1‰, the values expected for the nitrification of newly fixed N (orange arrow in Figure 6c; Knapp et al., 2008).
Estimating the δ15N of sinking PON from nitrate isotope sections has implications for determining the extent to which surface productivity is fueled by N2 fixation versus subsurface nitrate (Altabet, 1988; Casciotti et al., 2008; Rafter et al., 2013; Marconi et al., 2019) and for understanding the influence of denitrification in the Pacific ODZs on basin-scale biogeochemistry (Figure 7a; Rafter et al., 2013; Peters et al., 2018b). However, the preferential consumption of 14N-bearing (and/or low-δ15N) forms of DON and/or suspended PON may also contribute to the accumulation of low-δ15N nitrate in the upper thermocline (Casciotti et al., 2008; Knapp et al., 2018; Zhang et al., 2020) and would have a similar effect on thermocline nitrate isotopes to that of remineralization of N2 fixation-sourced sinking PON described above.
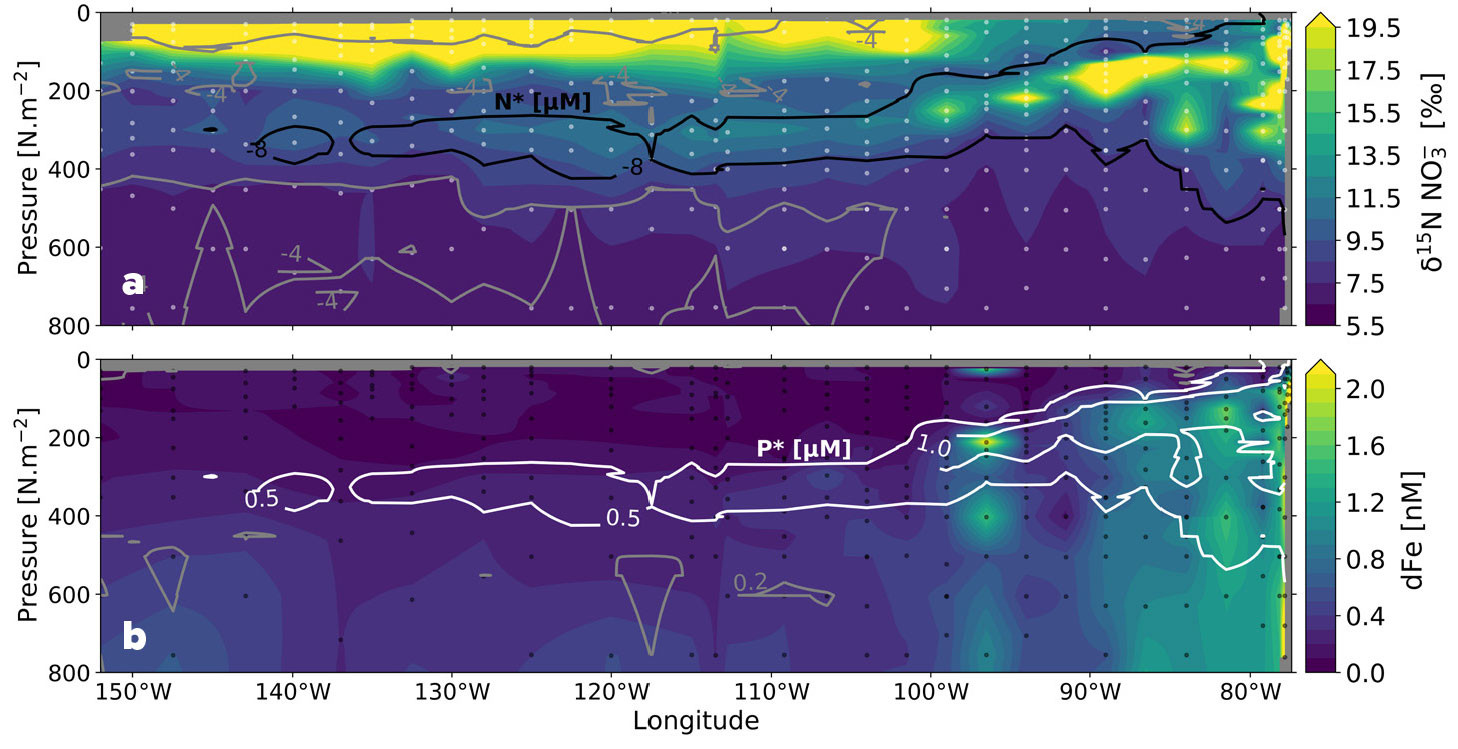
FIGURE 7. Zonal depth sections across the eastern tropical South Pacific Ocean (GP16 along ~15°S) of (a) nitrate δ15N (‰ vs. air) (Peters et al., 2018b) with black and gray contours indicating N* (= [NO3–] – 16 × [PO43–]) (μM), and (b) dissolved iron (dFe) (nM) (GEOTRACES Intermediate Data Product Group, 2023) with white and gray contours indicating P* (= [PO43–] – [NO3–] ÷ 16) (μM). On panel a, high-δ15N nitrate and low N* result from water column denitrification, the signal of which is advected westward from the eastern tropical South Pacific low oxygen margin. On panel b, elevated dissolved iron concentrations supplied by the margin overlap with elevated P*, which together could promote N2 fixation in the nearshore waters. > High res figure
|
Deman et al. (2021) measured the nitrate isotopes along GA01 (40°–60°N, 12°–54°W) to the north of GA03, sampling both the subtropical and subpolar North Atlantic. They concluded from the cohesive relationship of nitrate concentration to δ15N that nitrate is supplied to the subpolar gyre surface from the upward mixing of Labrador Sea Water, then consumed as the Ekman layer flows equatorward. In addition, at the base of the deep mixed layer of the subpolar gyre, the rise in nitrate δ18O coincident with no change in its δ15N indicates coupled partial nitrate assimilation and nitrification (as exemplified by the magenta arrow in Figure 6c; Sigman et al., 2005; Fawcett et al., 2015). The nitrate sections show that this signal is transported into the subtropical thermocline via the subduction and equatorward flow of isopycnals that outcrop in the subpolar region. The authors conclude that repeated cycles of nitrate consumption and nitrification act to drive down the δ18O of nitrate in the east-to-west flowing thermocline waters of the subtropical gyre, with nitrate eventually converging on the low δ18O (1.1‰; essentially the nitrification value) observed at the Bermuda Atlantic Time-series Study site (Knapp et al., 2008; Fawcett et al., 2015, 2018). The same remineralization pathways also cause the δ15N of subtropical North Atlantic thermocline nitrate to decline as newly fixed nitrate is added (Knapp et al., 2008; Bourbonnais et al., 2009; Marconi et al., 2015).
Lehmann et al. (2019) measured the nitrate isotopes along line GN02 that transects the Labrador Sea, Baffin Bay, and the Canadian Arctic Archipelago. In Baffin Bay, the high δ15N (7‰) and low δ18O (1‰) of deep-water nitrate suggest a Pacific origin for the nutrients that ultimately support export production. Because the lower δ15N (5.8‰) of nitrate in the overlying intermediate waters evinces a contribution of Atlantic water, and given that less sinking material will be remineralized in deep than intermediate waters, the authors conclude that the deep basin residence time must be much longer than that of the intermediate layer. The implication is that nutrients removed from Baffin Bay surface waters are trapped at depth over long timescales. By combining their nitrate isotope data (invariant δ15N and δ18O at depth) with N* (<–4 μM), N. Lehmann et al. (2019) also determine that sedimentary denitrification is a substantial sink for fixed N in Baffin Bay.
UNDERSTANDING NITROGEN CYCLING AND LOSS IN OXYGEN DEFICIENT ZONES
The quantity of fixed N loss from the ocean has been widely documented through the distributions of oxygen and nutrients (nitrate and phosphate). For example, nitrate deficits were used to estimate the quantity and rate of N loss in the low oxygen waters of the ETNP (Cline and Richards, 1972). N* has also been used to estimate the Pacific N budget (Deutsch et al., 2001). This approach yielded rates of water column denitrification in the ETNP and ETSP of 22 ± 3.4 and 26 ± 4.1 Tg N yr–1, respectively. While N* inherently makes assumptions about the N:P stoichiometry of organic matter and the mechanism of N loss, these estimates are remarkably similar to those based on the distributions of excess N2, which are independent of N:P remineralization ratios and N loss mechanisms (Chang et al., 2010; DeVries et al., 2012, 2013). Global models that allow variation in the N:P of exported organic matter also yield similar rates of water column N loss in the Pacific (Wang et al., 2019).
Nitrate isotope measurements have provided additional insights into N cycling and loss in water column ODZs (Sigman et al., 2005; Casciotti, 2016b). As nitrate is consumed by denitrification, preferential removal of 14N-nitrate leads to progressive enrichment of 15N in the remaining nitrate pool (green arrow in Figure 6d). This isotopic fractionation is clearly observed in marine ODZs (Figure 7a) and has been quantified as an isotope effect, which relates a given increase in δ15N or δ18O to the amount of nitrate removed (Mariotti et al., 1981). In order to translate nitrate isotope measurements into a quantity of N loss, it is important to know this conversion factor (isotope effect) accurately. However, estimates of the isotope effect range from 13‰ to 40‰ for water column denitrification (Cline and Kaplan, 1975; Brandes et al., 1998; Voss et al., 2001) and 0‰–3‰ for benthic denitrification (Brandes and Devol, 1997; M.F. Lehmann et al., 2007; Somes et al., 2013), with differing implications for the fraction of N loss occurring in the water column versus the sediments and the overall amount of N lost from the ocean. For example, using an isotope effect for water column denitrification of 25‰ to evaluate the marine N isotope budget, sedimentary denitrification is required to exceed water column denitrification by a factor of 3 to 4 (Brandes and Devol, 2002). This magnitude of sedimentary denitrification, however, results in a significant imbalance in the global marine N budget (Codispoti, 2007).
Subsequent work has shown that processes other than denitrification are important to consider in the N cycle of marine ODZs. Anammox (Kuypers et al., 2005; Lam et al., 2009; Ward, 2013; Babbin et al., 2014), nitrite (re)oxidation (i.e., the oxidation of nitrite produced via dissimilatory nitrate reduction in the ODZ; Fussel et al., 2012; Casciotti, 2016a), and migration of zooplankton (Bianchi et al., 2014) can contribute to the speciation, quantity, and isotopic composition of fixed N species and subsequent marine N loss. In particular, the isotope effect for denitrification could be overestimated based on water column nitrate isotope measurements due to two factors linked to nitrite oxidation: (1) the nitrate deficit does not accurately reflect the amount of nitrate reduction that has occurred (i.e., if most of the nitrate reduced to nitrite is subsequently reoxidized, it does not contribute to the nitrate deficit), and (2) the 15N enrichment in nitrate is amplified through the inverse kinetic isotope effect for nitrite oxidation, which causes nitrite enriched in 15N to be preferentially reoxidized to nitrate (yellow arrow in Figure 6d; Casciotti, 2009; Casciotti et al., 2013; Gaye et al., 2013; Bourbonnais et al., 2015; Peters et al., 2018a). A widespread influence of nitrite oxidation in marine ODZs (T.S. Martin et al., 2019a; Babbin et al., 2020; Buchanan et al., 2023; Sun et al., 2023) thus suggests that the isotope effect for water column denitrification is likely lower than 25‰, which would require less benthic denitrification to balance the N isotope budget.
Further insights into the isotope effects for water column denitrification come from sectional studies and large-scale data analyses (Marconi et al., 2017a; Peters et al., 2018b). Marconi et al. (2017a) compared the results of a multi-box model involving aerobic respiration and denitrification to nitrate isotope measurements along isopycnal surfaces across the South Pacific. They observed that as the δ15N of nitrate increases along isopycnal surfaces, its concentration also increases. They modeled the increases in nitrate concentration and δ15N arising from the combination of aerobic remineralization, which produces nitrate with a δ15N reflecting that of the biomass being degraded, and denitrification, which consumes nitrate and raises the δ15N of the residual nitrate pool. From this analysis, an isotope effect for denitrification as low as 13‰ was found to fit the nitrate isotope data, which is in keeping with studies of denitrifying bacteria grown under conditions (i.e., organic matter and nitrate supplies) similar to those found in the ocean (Kritee et al., 2012), and could allow a nitrate mass and isotope budget that is balanced (DeVries et al., 2012).
The influence of ODZ processes on nitrate isotope distributions was also examined in the South Pacific along the GEOTRACES GP16 section between Peru and Tahiti (Peters et al., 2018b). Coincident measurements of nitrate isotopes (Figure 7a; Peters et al., 2018b) and dissolved iron (Figure 7b; GEOTRACES Intermediate Data Product Group, 2023) on this GEOTRACES section also provided insights into potential limitation of N2 fixation by iron in the subtropical gyre. Surface samples with low nitrate and iron concentrations appear to be affected primarily by nitrate assimilation, without clear effects of N2 fixation (Peters et al., 2018b). In contrast, the samples from the ODZ have higher nitrate concentrations and are impacted by a combination of water column denitrification and nitrite reoxidation (Figure 6d; Casciotti and Buchwald, 2012). Using an isotope mixing model, the contributions of preformed, regenerated, and ODZ-derived nitrate to the distribution of nitrate isotopes along the section were also determined. Both denitrification and remineralization of high-δ15N organic matter likely contribute to elevating nitrate δ15N above the preformed values imported from the Southern Ocean (Rafter et al., 2013). This interpretation supports that of Marconi et al. (2017a), who found that by including remineralized nitrate, the nitrate isotope distributions could be explained by a 13‰ isotope effect for water column denitrification. T.S. Martin et al. (2019b) also found that a lower isotope effect for denitrification (13‰) was suitable for simulating nitrate δ15N values observed in and around ODZs using a 3D global inverse model (T.S. Martin et al., 2019a).
Shorter, more spatially resolved nitrate isotope sections have also proven valuable in regions where the biogeochemical and physical variability is high. For example, Flynn et al. (2020) measured the nitrate isotope ratios along four zonal transects (extending ≤300 km offshore and comprising at least 10 stations each) of the southern Benguela upwelling system (SBUS). Here, wind-driven upwelling of offshore SAMW occurs in spring and summer, with quiescent conditions prevailing in autumn and winter (Hutchings et al., 2009). Primary productivity in SBUS surface waters is remarkably high, exceeding that which can be supported by the offshore SAMW nutrient supply. Flynn et al. (2020) found in both summer and winter that regenerated nitrate and phosphate were “trapped” on the shelf, significantly augmenting the nutrient reservoir available for upwelling. Moreover, this subsurface nitrate was high in δ15N and low in δ18O relative to off-shelf SAMW, the bottom waters were characterized by a significant N deficit (shelf-wide mean of 4.6–6.0 μM; individual values as high as 23 μM), and oxygen concentrations were typically >60 μM. These data are best explained by coupled nitrification-denitrification in the sediments, which drives the loss of low-δ15N N2 and raises the δ15N of the fixed N remaining in the water column, while concurrently decreasing its δ18O (blue arrows in Figure 6e; Granger et al., 2011; Brown et al., 2015). Similar relationships of nitrate δ15N to δ18O and N deficit have been observed on the Bering Sea and Chukchi shelves in the Arctic (Granger et al., 2011, 2013; Fripiat et al., 2018). In the SBUS, Flynn et al. (2020) also observed a few incidences of nitrate δ15N and δ18O rising in concert for subsurface samples characterized by the lowest oxygen concentrations, consistent with water column denitrification (triangles in Figure 6e; that these data do not fall along a slope of 1:1 and are not characterized by a lower dissolved oxygen concentration can be explained by on-shelf mixing with higher-oxygen waters containing nitrate with a different relationship of δ18O to δ15N). In the SBUS, therefore, the dual nitrate isotopes yield insights into oxygen conditions because denitrification (coincident rise in δ15N and δ18O) requires water column suboxia whereas coupled nitrification-denitrification (δ15N rise and δ18O decline) signals the development of suboxia in the sediments. The former scenario indicates a loss of N availability in the water column, with negative implications for higher trophic levels including fish, while the latter is most deleterious for benthic species.
LOOKING AHEAD
The increasing availability of isotope measurements of nitrate and DON lends itself to interpretation using regional-, basin-, and global-scale model frameworks. Modeling of nitrate isotopes has already enabled significant advances in our understanding of the inputs, outputs, and internal cycling of N in the ocean (Somes et al., 2010; DeVries et al., 2013; Yang and Gruber, 2016; Martin et al., 2019b; Rafter et al., 2019; Fripiat et al., 2021a, 2023). For example, the sensitivity of deep ocean nitrate δ15N to surface productivity and ocean circulation (Fripiat et al., 2023) implies that past changes in deep nitrate δ15N may not have been entirely due to variations in the fixed N budget (Brandes and Devol, 2002; Deutsch et al., 2004; Fripiat et al., 2023), particularly given likely changes in both productivity and circulation (Sigman et al., 2010). Further improvements in the spatial and temporal coverage of N isotope measurements will continue to constrain N cycle processes and their variability across seasons and ocean basins with differing circulation, productivity, ventilation rates, trace metal availability, and patterns of net N input or loss. In particular, we anticipate additional data from the Pacific and Indian Oceans from GEOTRACES cruises and analyses still underway. Moreover, the incorporation of rapidly growing N isotope databases (e.g., Figure 2, as well as DON δ15N) into coupled biogeochemical ocean models will improve coherent quantification and characterization of rates, transformations, and isotope effects for N cycle processes needed to reproduce these expanding data on a global scale.
Acknowledgments
The authors would like to gratefully acknowledge the international efforts and cooperation involved with the collection of the data and interpretations that formed the basis for this review. The International GEOTRACES Program is possible in part thanks to support from the US National Science Foundation (NSF) grant OCE-2140395 to the Scientific Committee on Oceanic Research (SCOR). The authors would like to thank guest editors Tim Conway, Jessica Fitzsimmons, Hélène Planquette, Taryn Noble, and Rob Middag for their handling of this manuscript, as well as Patrick Rafter and an anonymous reviewer for their insightful comments on an earlier draft. We are also thankful to Reiner Schlitzer for graciously producing the graphics used in Figure 3. KLC acknowledges support from NSF award OCE-2048961. ANK acknowledges support from NSF OCE-2148989. SF thanks the South African National Research Foundation (116142, 150540, and SANAP230527110611) and the University of Cape Town Vice-Chancellor’s Future Leaders 2030 program. TM and SF acknowledge the South African Department of Science and Innovation’s Biogeochemistry Research Infrastructure Platform (BIOGRIP). The international GEOTRACES program is possible in part thanks to the support from the US National Science Foundation (Grant OCE-2140395) to the Scientific Committee on Oceanic Research (SCOR).

 > High res figure


