Full Text
Range or resolution? We often get asked this question when mapping the seafloor. And it is important because the type of data we choose to collect fundamentally changes the science that can follow. Photos taken by camera-equipped autonomous underwater vehicles (AUVs) represent one extreme of the range/resolution trade-off, where sub-centimeter resolutions can be achieved, but typically only from close ranges of 2 m to 3 m. Taking images from higher altitudes increases the area mapped during visual surveys in two ways. First, a larger footprint can be observed in each image, and second, the lower risk of collision with rugged terrains when operating at higher altitudes allows use of flight-style AUVs (e.g., Autosub6000 shown in Figure 1), which are faster and more energy efficient than the hover-capable vehicles typically used for visual surveys. Combined, these factors permit several tens to more than a hundred hectares of the seafloor to be mapped in a single AUV deployment.
|
|
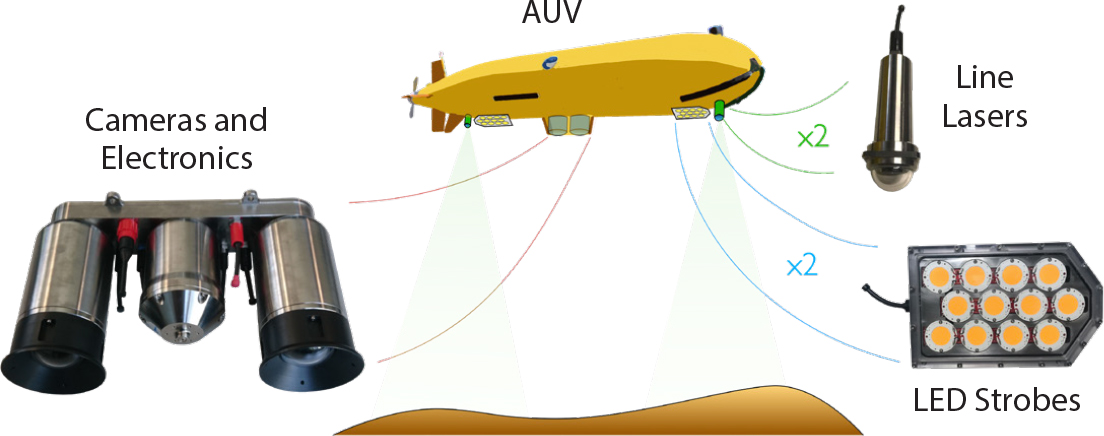
BioCam is a high-altitude three-dimensional (3D) imaging system that uses a stereo pair of high-dynamic-range scientific complementary metal-oxide semiconductor (sCMOS) cameras, each with 2,560 × 2,160 pixel resolution, that are mounted in a 4,000 m rated titanium housing. The housing has domed windows to minimize image distortion and also includes low-power electronics for communication, data storage, and control of the dual LED strobes and dual line lasers BioCam uses to acquire 3D imagery. The LED strobes each emit 200,000 lumens of warm hue white light for 4 milliseconds. The lasers each project a green line (525 nm, 1 W Class 4) onto the seafloor at right angles to the AUV’s direction of travel to measure the shape of the terrain. The optical components are arranged along the bottom of the AUV, with an LED and a laser each mounted fore and aft of the cameras (Figure 1). A large distance between these illumination sources and the cameras ensures high-quality images, and high-resolution bathymetry data can be gathered from target altitudes of 6 m to 10 m.
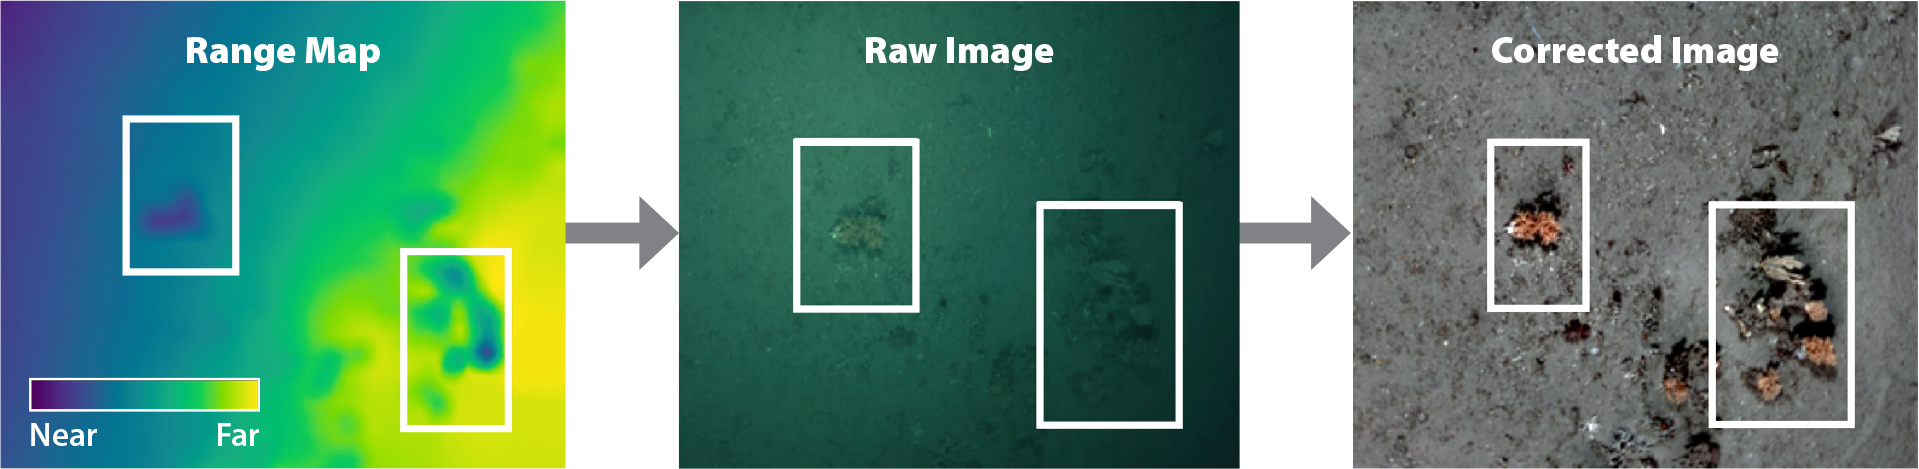
The large dynamic range of the sCMOS cameras is necessary for high-altitude imaging because red light attenuates much more strongly than green and blue light in water (Figure 2). A large dynamic range allows detection of low intensity red light with sufficient bit resolution to restore color information, while simultaneously detecting the more intense light of the other color channels without saturation. Range information from the dual lasers allows the distance light travels from the strobes to each detected pixel to be calculated for accurate color rectification (see Figure 2). Rectified color is projected onto the laser point cloud and fused with AUV navigation data to generate texture-mapped, 3D visual reconstructions (Bodenmann et al., 2017). The BioCam processing pipeline calibrates the dual laser setup so that quantitative length, area, and volumetric measurements can be made together with estimates of dimensional uncertainty, without the need for artificial field calibration targets (Leat et al., 2018).
|
|
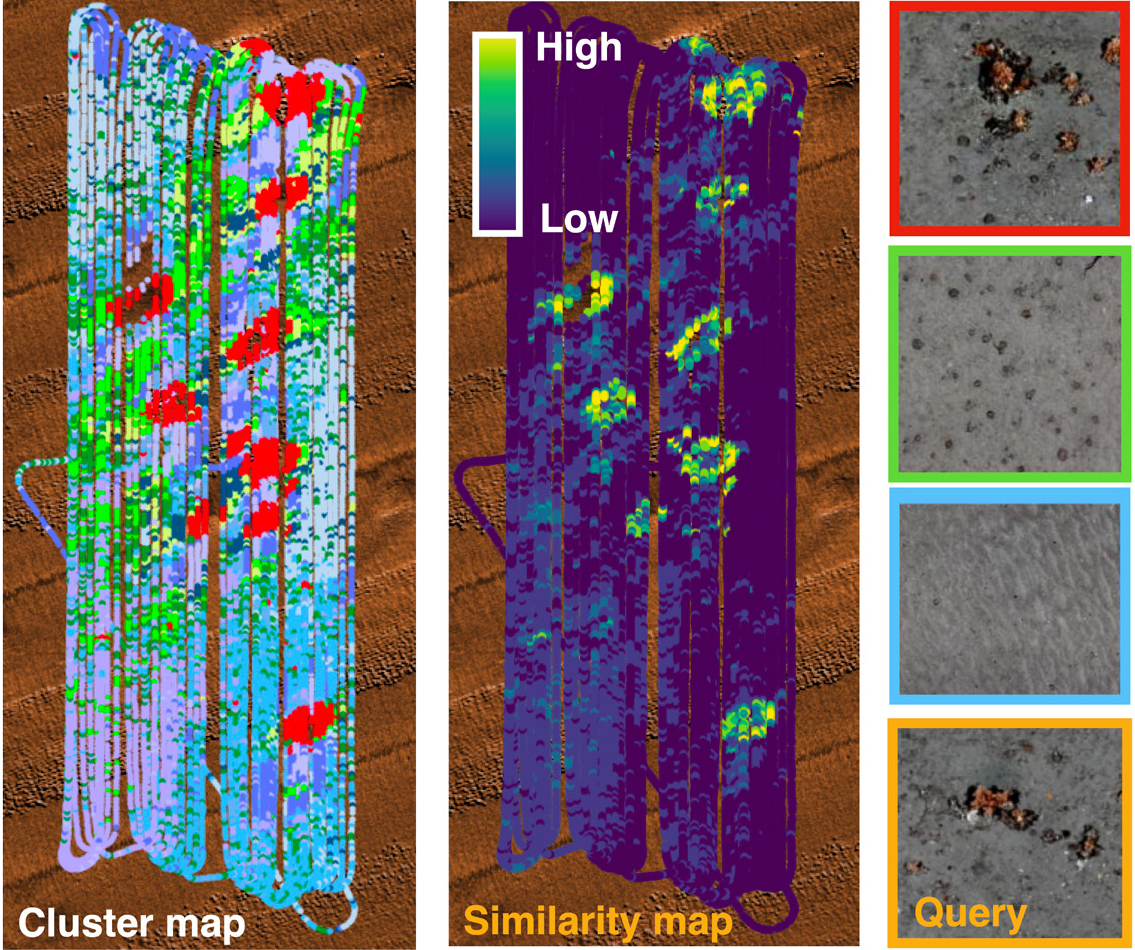
Although 3D reconstructions are useful for studying detailed seafloor information, exploring them is both time-consuming and subjective. To help plan more effective data acquisition during research expeditions, it is valuable to be able to rapidly understand large georeferenced image data sets in expedition-relevant timeframes. For this, we have developed location-guided unsupervised learning methods (Yamada et al., 2021) that can automatically learn the features that best describe images in a georeferenced data set without needing any human input for interpretation. These features are used to cluster images into groups with similar appearances, identifying the most representative images in each cluster and also allowing scientists to flexibly query data sets by ranking all images in order of their similarity to any input image, where the ranked outputs for different query images can be generated in milliseconds. Both the clustering and query returns can be visualized using georeference information to identify spatial patterns in the data sets.
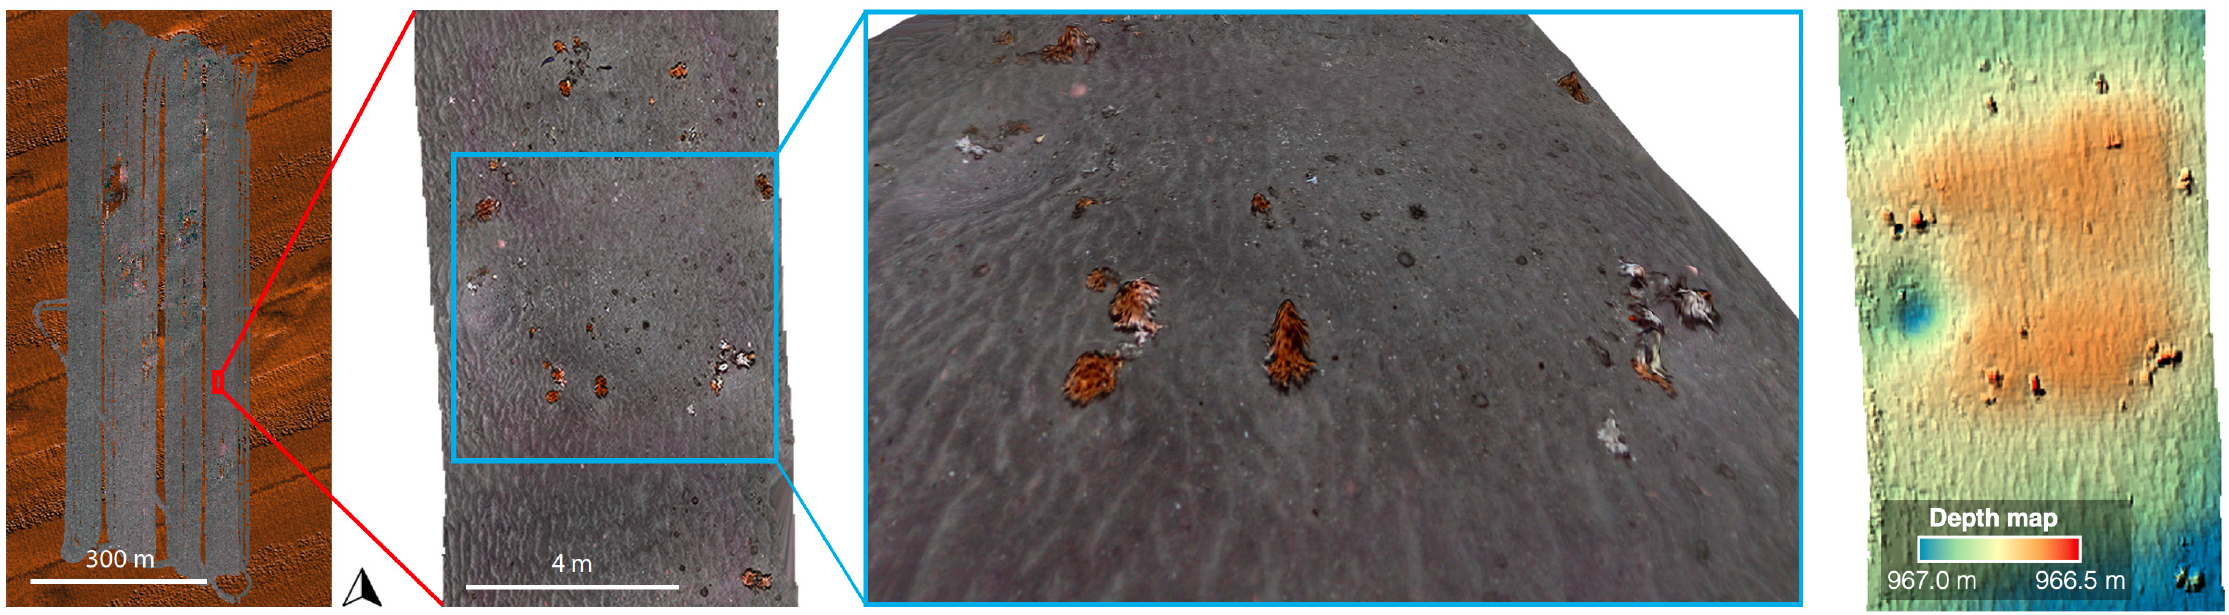
Figure 3 shows an example of a 3D visual reconstruction collected during a survey of the Darwin Mounds marine protected area, 160 km northwest of Cape Wrath, Scotland, at ~1,000 m depth. BioCam was mounted on the flight-style Autosub6000 AUV, which operated at 6 m altitude and 1 m/s forward speed to cover 30,000 m2/h. The setup achieved a resolution of 3.3 mm across track and 2 mm in depth. The closeup in Figure 3 shows individual colonies of cold-water-corals forming a ring around the base of a micro-mound. Figure 4 shows the results of clustering, representative image identification, and content-based query. Cold-water coral colonies were most densely distributed around the bases of mounds, several of which are significantly larger (up to 75 m wide and 5 m high) than the micro-mound in Figure 3, forming ring patterns more broadly throughout the 30 ha region mapped during the dive. The clustering results also show that xenophyophores, large single-cell organisms recognized as a vulnerable marine ecosystem indicator species, are most densely distributed in the tails of the mounds. The ability to recognize biological zonation associated with mounds, in particular micro-mounds that are difficult to observe in lower resolution acoustic data, illustrates how combining subcentimeter resolution 3D visual mapping with methods developed to summarize observations and flexibly answer queries can generate rapid human insight and so help focus efforts in observation and downstream analysis.
|
|
|
|