
Full Text
The SPURS-2 region beneath the Intertropical Convergence Zone (ITCZ) in the eastern tropical Pacific Ocean is influenced by strong horizontal and vertical salinity gradients that result from numerous processes and features, including fronts, eddies, and filaments, freshening from local rainstorms, and advection of surface freshwater anomalies.
The Pacific Ocean thermal equator is located beneath the ITCZ where the surface trade winds converge and cause deep convection and sporadic heavy rainfall. Wind strength and duration vary over the course of the year because the ITCZ migrates north/south seasonally. The strongest salinity and temperature gradients are meridional in response to this progression. Variability in equatorial upwelling and atmospheric convection can also influence stratification in the region. The meridional gradients between the ITCZ and surrounding subtropical atmospheric regimes are also very sharp. The low wind, high rain region of the ITCZ is flanked on either side by high wind (up to 15 m s–1 trade winds) and almost no precipitation due to large-scale sinking of cold and dry air. In addition, the wind stress curl pattern associated with the ITCZ drives the seasonality in the large-scale zonal circulation system comprising the opposing North Equatorial Current and North Equatorial Counter Current. These currents carry different source waters that influence the salinity balance and the space-time structure of stratification, although their zonality is frequently disrupted by tropical instability waves, eddies, and filaments.
|
|
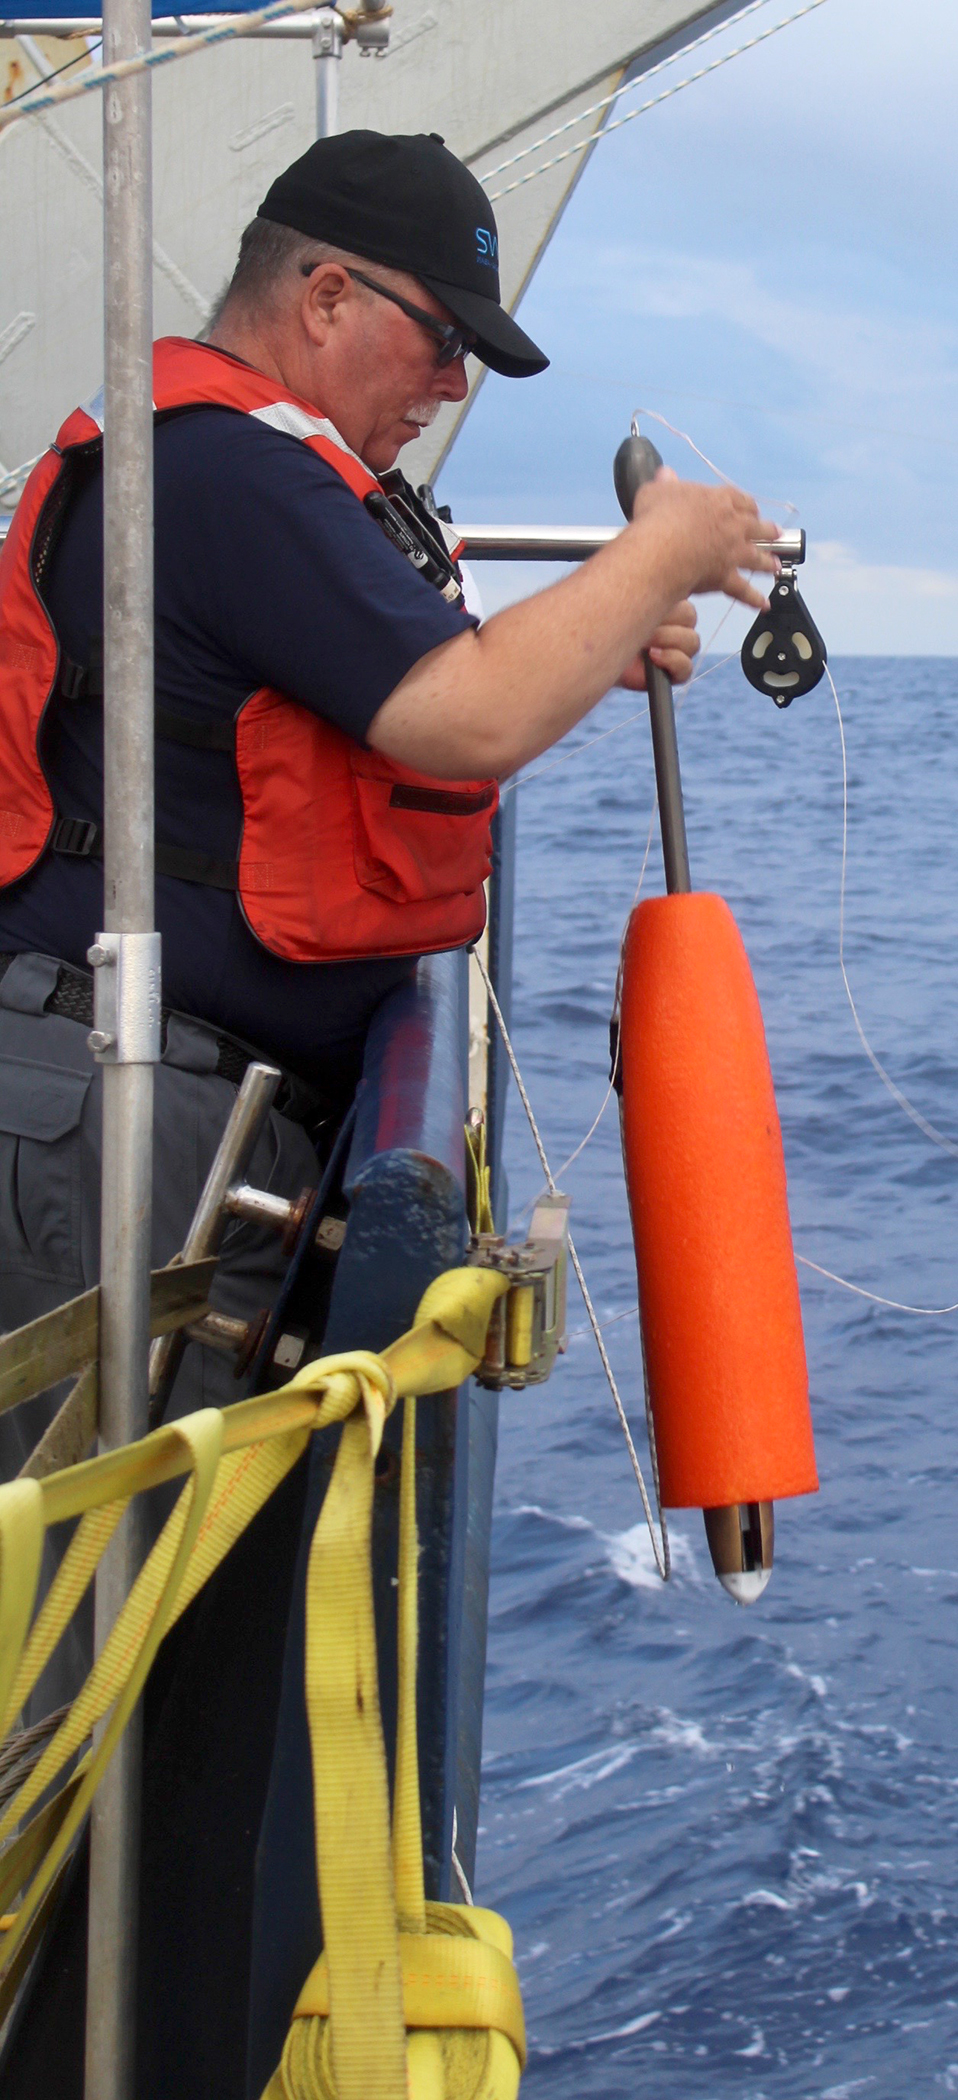
During the SPURS-2 field campaign, more than 50 CTD-O2 profiles and over 750 underway CTD (uCTD) profiles were completed to provide information about stratification in the upper 500 m of the water column. Many profiles were well mixed in both temperature and salinity (Figure 1, left panel). However, during SPURS-2 field campaigns, we also found many instances of unexpected upper ocean stratification exhibiting unique temperature and salinity features.
|
|
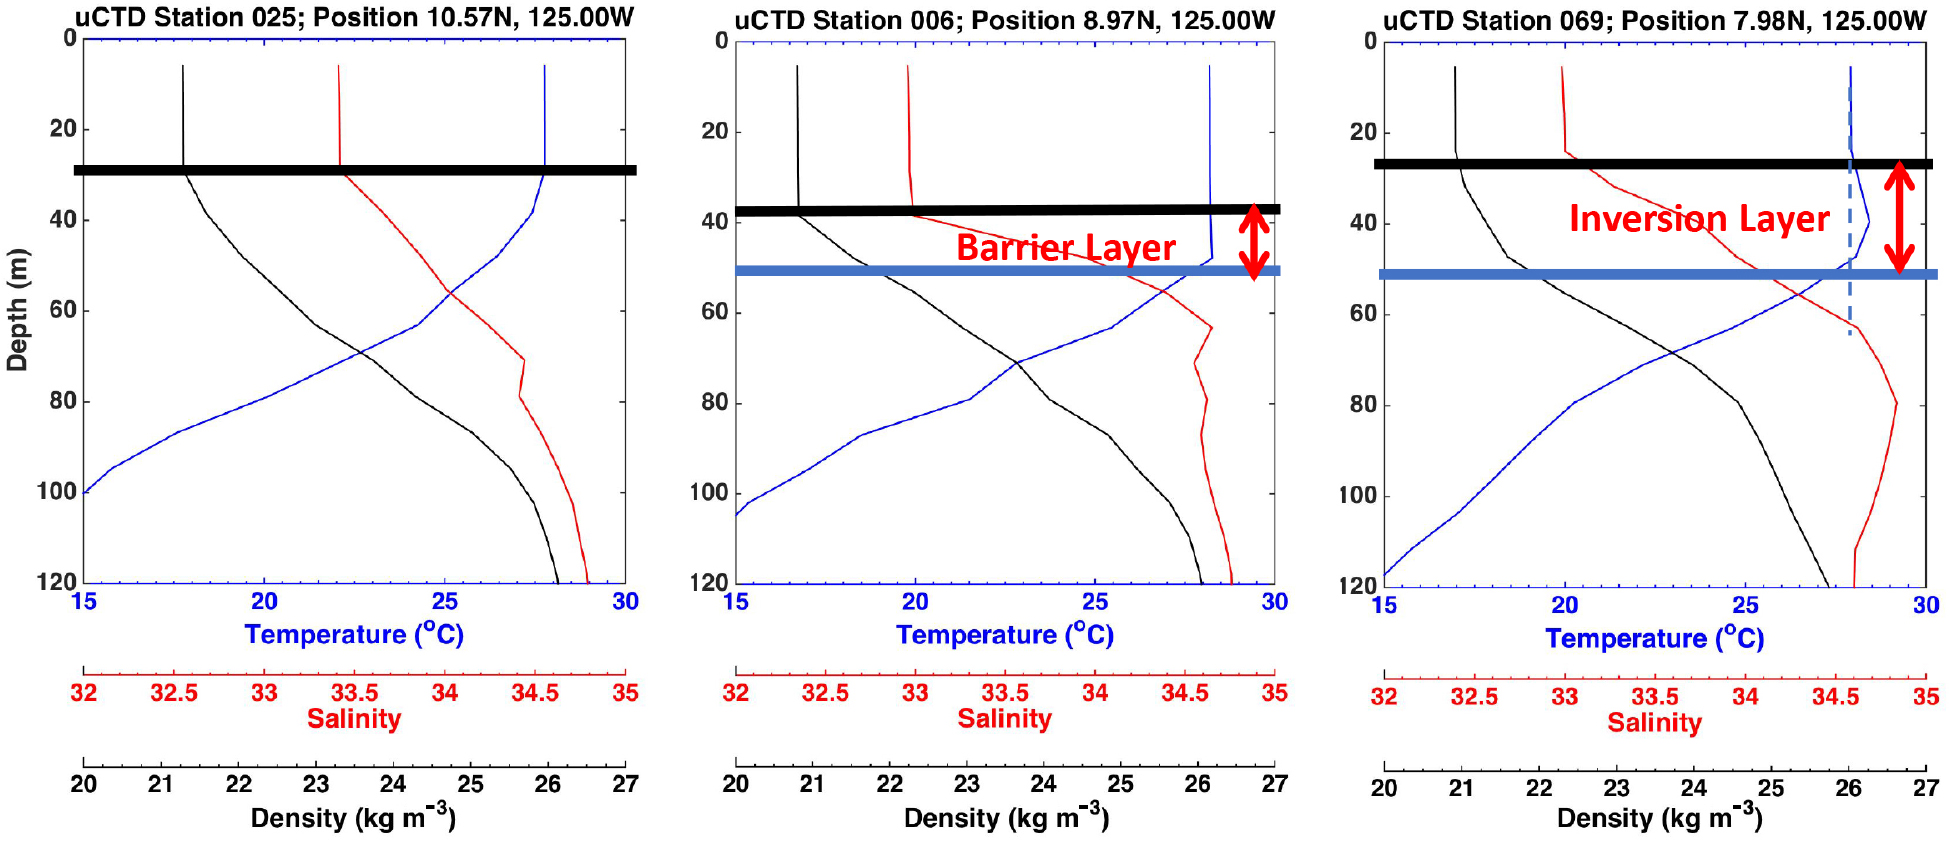
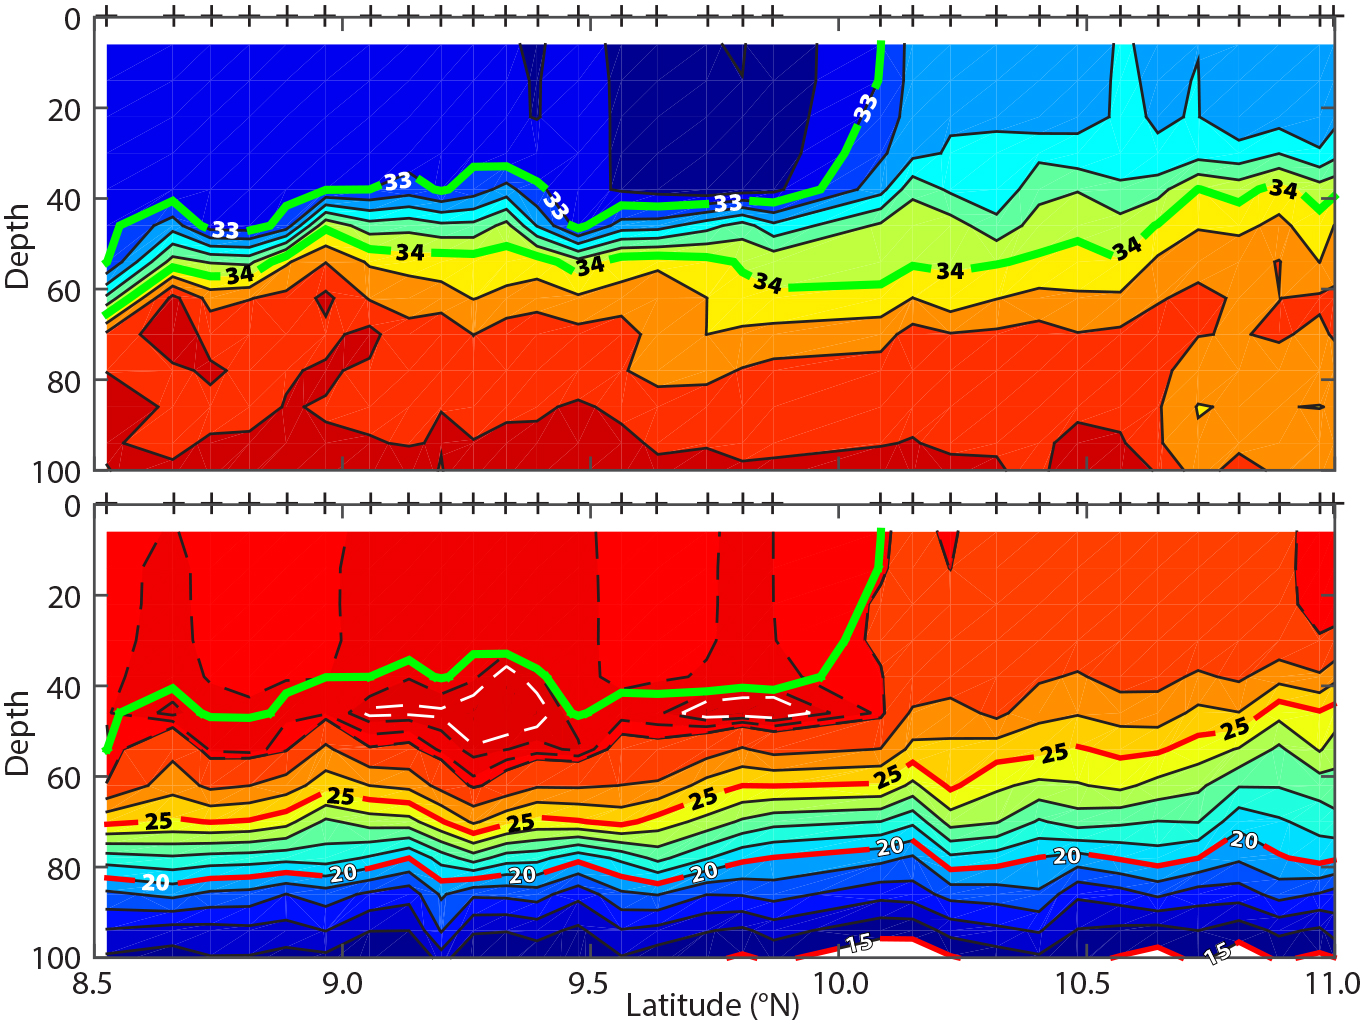
In some uCTD profiles, the density-defined mixed layer depth (MLD) is shallower than the isothermal layer depth (ILD), and a layer that is well mixed in temperature but not in salinity lies between the MLD and the ILD (Figure 1, middle panel). This is known as the barrier layer. As the name suggests, barrier layers can trap fluxes of heat, freshwater, and momentum to a thinner ocean surface layer, which enhances their impacts on air-sea exchanges and sea surface temperature. In addition, the presence of a barrier layer reduces or eliminates entrainment cooling at the base of the mixed layer. The relatively weak winds that characterized ITCZ presence during the SPURS-2 campaigns could be more conducive to barrier layer formation and longevity. Salt-stratified barrier layers were observed during the cruise where the warm layer extended deeper than the fresh surface layer (Figure 2).
|
|
In contrast to other tropical regions, the barrier layers that lie under the ITCZ appear to be quite thin: many SPURS-2 shipboard profiles reveal a typical barrier layer thickness of only 10–20 m beneath shallow mixed layers of only 40–60 m depth. Their formation mechanism in the eastern Pacific is not yet clear because the atmospheric and oceanic conditions are very different from the western Pacific warm pool region where barrier layers have previously been primarily studied (e.g., Lukas and Lindstrom, 1991; Roemmich et al., 1994; Sprintall and McPhaden, 1994). Likely formation candidates include rainfall and advective processes related to current shear and horizontal and vertical salinity gradients.
A temperature inversion occurs when a warm subsurface layer is sandwiched between cooler surface and deeper layers, During the SPURS-2 cruises, temperature inversions of up to 0.5°C and 20 m thickness occurred (Figure 1, right panel), often coinciding with rainstorms and weak winds, suggesting formation through local precipitation. Indeed, temperature inversions were ubiquitous at the base of the fresh pools in the halocline, sometimes extending laterally for 50–60 km, especially in the vicinity of fronts (Figure 2). Some CTD-O2 profiles showed that the inversion layers were associated with elevated oxygen, suggesting that subduction might play a role. It is unknown if the inversions are transient features or, indeed, what their timescales might be.
Numerous mechanisms might be responsible for the formation of inversions, including seasonal restratification of the mixed layer related to the march of the ITCZ, lateral water mass interleaving related to wind-forced advection of cold, less saline water over warm saline water, net heat loss at the sea surface, and frontal variability. Inversion layers can also occur in conjunction with barrier layers (e.g., Sprintall and Roemmich, 1999; Thadathil et al., 2002; Helber et al., 2012), developing when warming within the barrier layer is greater than warming in a fresh surface layer, such as might occur if the mixed layer is very shallow, thus permitting penetration of shortwave radiation through its base (Mignot et al., 2012).
Future analysis will explore the many fundamental open questions remaining about the characteristics and mechanisms responsible for the salinity stratification observed during the SPURS-2 field campaigns. How does seasonal migration of the ITCZ and the related wind, rainfall, and current system influence the barrier layers? Are the large temperature inversions associated with frontal variability? How, where, and when does the presence or absence of a barrier layer influence the coupled air-sea interaction in the eastern Pacific ITCZ region? What are the temporal and spatial scales of air-sea coupling related to salinity stratification that are captured by the satellite data?