Oceanography The Official Magazine of
The Oceanography Society
Volume 36 Supplement 1

View Issue TOC
Volume 36, No. 1
Pages 38 - 39

OpenAccess

UAV High-Resolution Imaging and Disease Surveys Combine to Quantify Climate-Related Decline in Seagrass Meadows

By Lillian R. Aoki, Bo Yang, Olivia J. Graham, Carla Gomes, Brendan Rappazzo, Timothy L. Hawthorne, J. Emmett Duffy, and Drew Harvell  
Jump to
Full text Citation References Copyright & Usage
Full Text

Seagrass meadows are essential habitats that support marine biodiversity and coastal communities while sequestering carbon, filtering water, and stabilizing coastal sediments. Warming temperatures stress seagrass meadows and can facilitate seagrass wasting disease, contributing to large-scale diebacks of seagrass meadows. Here, we demonstrate how high-resolution imagery, collected by uncrewed aerial vehicle (UAV) and validated by in situ sampling, can quantify seagrass responses to disease and thermal stress.

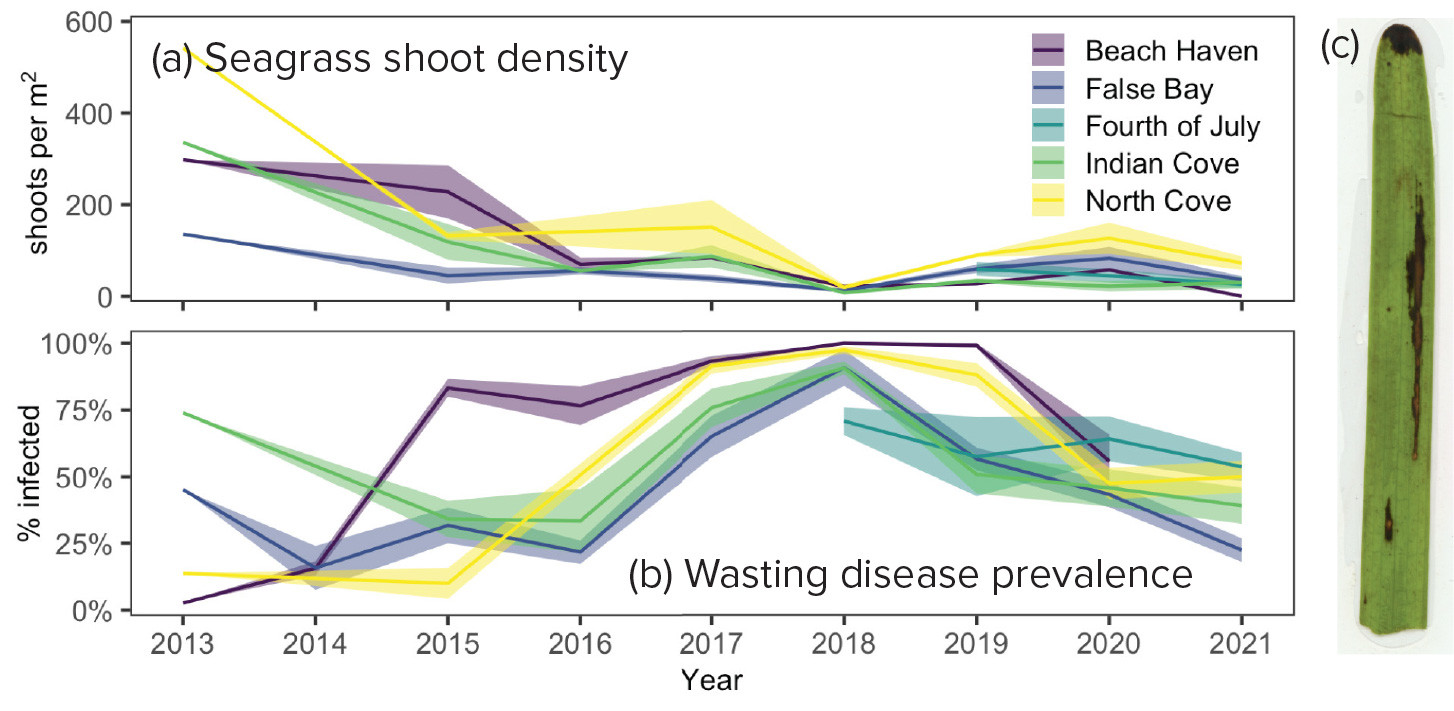
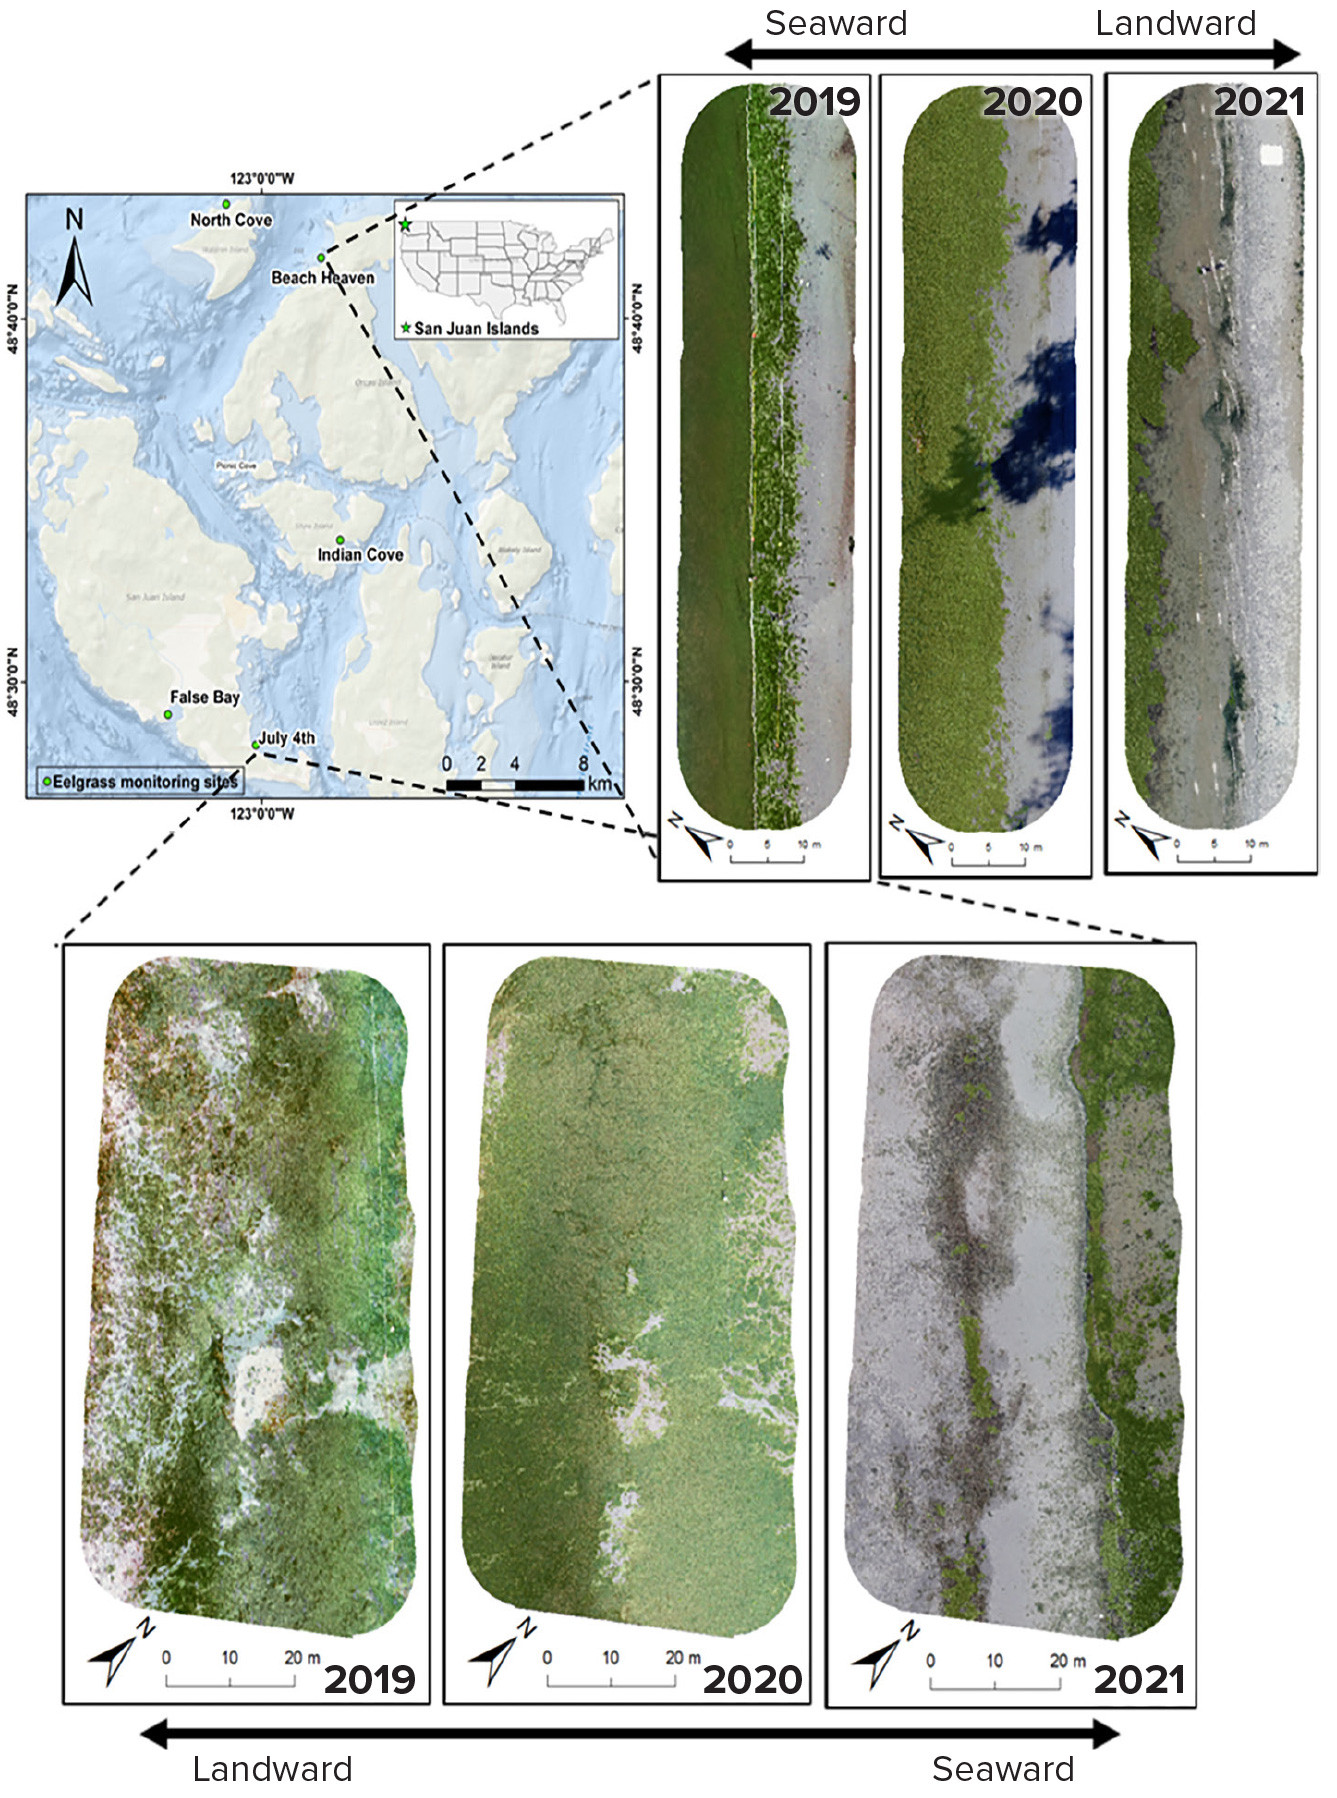
Seagrass meadows in the San Juan Islands, Washington, USA, have declined dramatically over the last decade. Shoot densities, measured along permanent monitoring transects, fell over 90% from 2013 to 2021, while wasting disease prevalence (percent infected plants) remained persistently above 40% since the 2016 Northeast Pacific heatwave (Figure 1). Since 2019, we have synchronized UAV surveys with midsummer in situ sampling. The UAV imagery greatly expands the scope of the data, extending beyond the monitoring transects to confirm large-scale loss of seagrass. Because this imagery can achieve 1–3 cm spatial resolution, analysis can connect individual plants (<3 cm) to ecosystem dynamics at the meadow scale (kilometers). The broad picture of seagrass decline detected in the UAV imagery reinforces the need for landscape-scale monitoring.


FIGURE 1. Long-term data from in situ surveys show substantial declines in seagrass shoot density over the last decade (a) while seagrass wasting disease infections have increased and remained elevated since the heat wave of 2016 (b). Colors indicate individual eelgrass meadows. Data from 2013 to 2017 redrawn from Groner et al. (2021). (c) An example of an infected eelgrass leaf with a dark wasting disease lesion. > High res figure


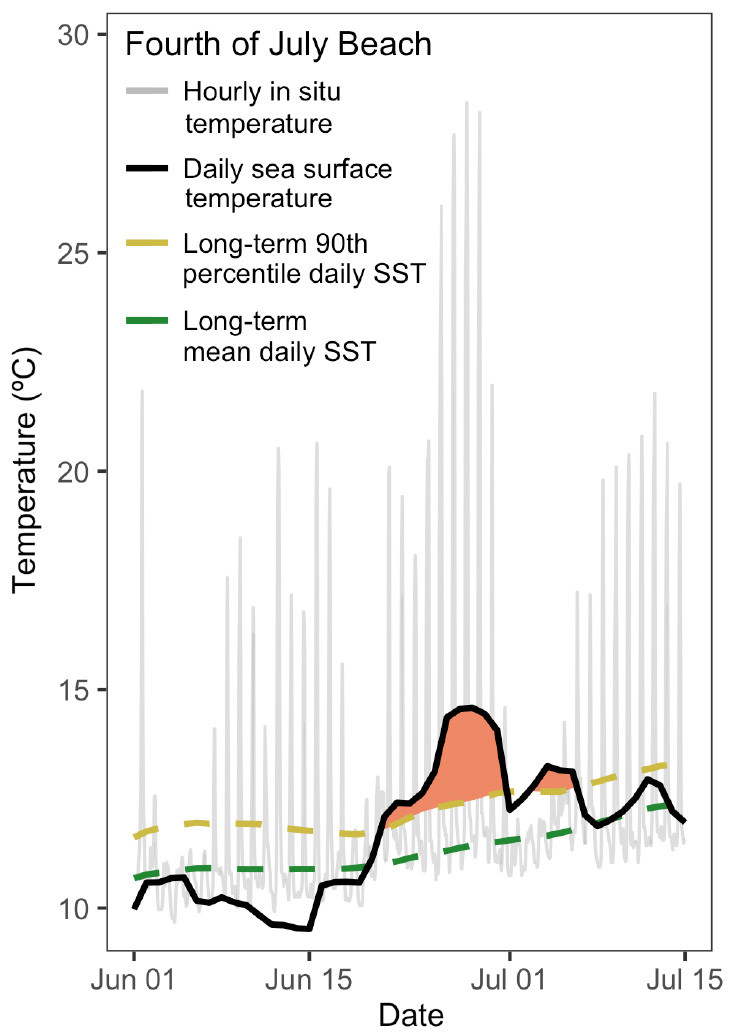
High-resolution imagery further provides insight into seagrass dynamics under climate change. Wasting disease is sensitive to warming, with infections increasing in warmer years (Groner et al., 2021). In June 2021, there was an unprecedented heating event in the study region (the 2021 Pacific Northwest heat dome). Daily sea surface temperatures exceeded the 90th percentile of long-term temperature records for 10 consecutive days (Figure 2). During this period, low tides occurred in early afternoon and the exposed intertidal meadows reached hourly temperatures as high as 34ºC at some sites, far exceeding the normal temperature range. These high temperatures cause physiological stress in seagrass, and prolonged exposure to high temperatures can cause plant mortality and rapid meadow diebacks. UAV imagery collected immediately following this event highlighted the dramatic loss of seagrass density and coverage for all monitoring sites, including the two sites shown here (Figure 3). At the Beach Haven site, the UAV imagery showed the nearly complete loss of the upper 10 m of seagrass between 2020 and 2021. This loss of habitat structure will have cascading ecological consequences, including reduced animal abundance, reduced carbon sequestration potential, and reduced shoreline protection. High levels of wasting disease infection in the years prior to this heatwave likely weakened these meadows, increasing their vulnerability to acute thermal stress and contributing to meadow-scale declines (Graham et al., 2021). Further quantification of spatiotemporal trends in patchiness, biomass, and plant health will show how climate-driven disturbance propagates across the landscape. Landscape-scale monitoring using UAV methods is increasingly urgent as the frequency, intensity, and duration of extreme heating events such as the 2021 heat dome increase under climate change.


FIGURE 2. During the 2021 Pacific Northwest heat dome, extreme daily sea surface temperatures (black line) above the long-term 90th percentile (gold line) were recorded at study sites, including Fourth of July Beach. Sea surface temperature (SST) records were measured by satellite remote sensing and show the severity of daily temperatures compared to historic baselines, whereas hourly temperatures (gray line) measured with sensors deployed in the seagrass meadow capture the extreme in situ temperatures during mid-afternoon low tides. Maximum hourly temperatures during the heat dome ranged from 28°C to 34ºC across the intertidal seagrass meadows in the study region. > High res figure


FIGURE 3. Five seagrass meadows in the San Juan Islands were surveyed annually beginning in 2019 using UAVs. Time series of the high-resolution imagery from two representative sites (Beach Haven, upper panels, and July 4, lower panels) show loss of seagrass extent in the 2021 images compared to prior years. At both sites, extensive areas of bare sand had replaced seagrass in the later images (seagrass area is highlighted in green in each image). Other parameters such as green leaf area index, seagrass biomass, and the presence of macroalgae can be derived through classification of the high-​resolution images. > High res figure


In the dynamic intertidal zone, the flexibility of UAV methods could revolutionize assessment of disturbance trajectories (Yang et al., 2020). Because UAVs can be deployed rapidly, cross-scale imagery can be collected immediately after disturbance as well as at seasonal or annual intervals. Advanced methods such as deploying UAVs with multispectral, hyperspectral, or thermal sensors, combined with ground-sampled spectral signatures, can provide new insights into indicators of plant health, competition with macroalgae, and the presence of invasive species. The ongoing development of machine learning image processing algorithms will facilitate rapid and high-throughput image analysis and support managers and monitoring programs focused on understanding the real-time status and temporal dynamics of these ecosystems. With worsening wasting disease outbreaks and extreme heating under climate change, synergistic combinations of in situ and UAV methods are needed to understand seagrass meadow dynamics across spatial and temporal scales.

Citation

Aoki, L.R., B. Yang, O.J. Graham, C. Gomes, B. Rappazzo, T.L. Hawthorne, J.E. Duffy, and D. Harvell. 2023. UAV high-resolution imaging and disease surveys combine to quantify climate-related decline in seagrass meadows. In Frontiers in Ocean Observing: Emerging Technologies for Understanding and Managing a Changing Ocean. E.S. Kappel, V. Cullen, M.J. Costello, L. Galgani, C. Gordó-Vilaseca, A. Govindarajan, S. Kouhi, C. Lavin, L. McCartin, J.D. Müller, B. Pirenne, T. Tanhua, Q. Zhao, and S. Zhao, eds, Oceanography 36(Supplement 1):38–39, https://doi.org/10.5670/oceanog.2023.s1.12.

References

Graham, O.J., L.R. Aoki, T. Stephens, J. Stokes, S. Dayal, B. Rappazzo, C.P. Gomes, and C.D. Harvell. 2021. Effects of seagrass wasting disease on eelgrass growth and belowground sugar in natural meadows. Frontiers in Marine Science 8:768668, https://doi.org/10.3389/fmars.2021.768668.

Groner, M., M. Eisenlord, R. Yoshioka, E. Fiorenza, P. Dawkins, O. Graham, M. Winningham, A. Vompe, N. Rivlin, B. Yang, and others. 2021. Warming sea surface temperatures fuel summer epidemics of eelgrass wasting disease. Marine Ecology Progress Series 679:47–58, https://doi.org/10.3354/meps13902.

Yang, B., T.L. Hawthorne, M. Hessing-Lewis, E.J. Duffy, L.Y. Reshitnyk, M. Feinman, and H. Searson. 2020. Developing an introductory UAV/drone mapping training program for seagrass monitoring and research. Drones 4:70, https://doi.org/10.3390/drones4040070.

Copyright & Usage

This is an open access article made available under the terms of the Creative Commons Attribution 4.0 International License (https://creativecommons.org/licenses/by/4.0/), which permits use, sharing, adaptation, distribution, and reproduction in any medium or format as long as users cite the materials appropriately, provide a link to the Creative Commons license, and indicate the changes that were made to the original content. Images, animations, videos, or other third-party material used in articles are included in the Creative Commons license unless indicated otherwise in a credit line to the material. If the material is not included in the article’s Creative Commons license, users will need to obtain permission directly from the license holder to reproduce the material.