Introduction
The tropics receive the highest solar irradiance on the planet, with net tropical heat gain exported poleward via the general circulation of the ocean and the atmosphere to moderate Earth’s climate. Intense tropical insolation that results in the highest open ocean sea surface temperatures (SSTs) in the world contributes to energetic ocean-atmosphere interactions over a broad range of timescales, from days to decades and longer. Consequential phenomena originating in the tropics include tropical cyclones, the intraseasonal Madden-Julian Oscillation (MJO), the mean seasonal cycle and monsoon circulations, the El Niño-Southern Oscillation (ENSO) and ENSO-like variations that occur in the equatorial Atlantic and the Indian Oceans, decadal timescale variations, and trends related to global warming. These phenomena have tremendous societal impact both regionally and, in some cases, globally though far-field atmospheric and oceanic teleconnections.
The Global Ocean Observing System (GOOS) was established to provide sustained and systematic observations to support better description, understanding, and prediction of the ocean’s role in weather and climate. It is based on a variety of in situ components designed to complement the constellation of Earth observing satellites (Speich et al., 2019). The Global Tropical Moored Buoy Array (GTMBA; Figure 1) and its components—the Tropical Atmosphere Ocean array/Triangle Trans-Ocean Buoy Network (TAO/TRITON), the Prediction and Research Moored Array in the Tropical Atlantic (PIRATA), and the Research Moored Array for African-Asian-Australian Monsoon Analysis and Prediction (RAMA)—are cornerstones of GOOS because they provide data on essential ocean and climate variables not available through other means (Foltz et al., 2019; Smith et al., 2019; Beal et al., 2020). GTMBA servicing cruises also provide deployment opportunities to help maintain other components of GOOS, such as Argo and the Global Drifter Program, as well as value-added shipboard measurements.

FIGURE 1. Array configuration of moorings in the Global Tropical Moored Buoy Array (GTMBA) in February 2010 and February 2023. The standard mooring design (in red) is most common; elaborations on that design are shown in different color coding (see Figure 2 for a mooring schematic). Flux Reference Sites (blue symbols) are locations where full sets of meteorological sensors measure shortwave radiation, downwelling longwave radiation, rainfall, and barometric pressure, permitting estimates of net heat, fresh water, buoyancy, and momentum flux across the air-sea interface. Some moorings measure CO2 as well (green and purple symbols). Moorings of the Indian national Ocean Moored Buoy Network in the northern Indian Ocean (OMNI) are shown in slightly smaller symbols so they can be distinguished from one another in the lower panel. Acoustic Doppler current profiler (ADCP) moorings and other subsurface moorings embedded at various locations in all three ocean basins are not shown for clarity. The Japan Agency for Marine-Earth Science and Technology (JAMSTEC) ended its western equatorial Pacific TRITON program in June 2021. > High res figure
|
The origins of GTMBA date back to mid-1970s efforts at NOAA’s Pacific Marine Environmental Laboratory (PMEL) to study how equatorial Pacific Ocean circulation affected the development of El Niño (Halpern, 1996). Those efforts greatly expanded in the mid-1980s during the international Tropical Ocean Global Atmosphere (TOGA) Program, with development of the TAO array in the Pacific to study ENSO (Hayes et al., 1991; McPhaden et al., 1998). TOGA was a 10-year program (1985–1994) that focused mostly on the Pacific (McPhaden et al., 2010a). It was not until after TOGA that the TAO array concept was extended in the mid-1990s to the Atlantic Ocean for studies of tropical Atlantic climate variability (Servain et al., 1998; Bourlès et al., 2019) and early in this century to the Indian Ocean for studies of the ocean’s role in the African-Asian-Australian monsoons (McPhaden et al., 2009).
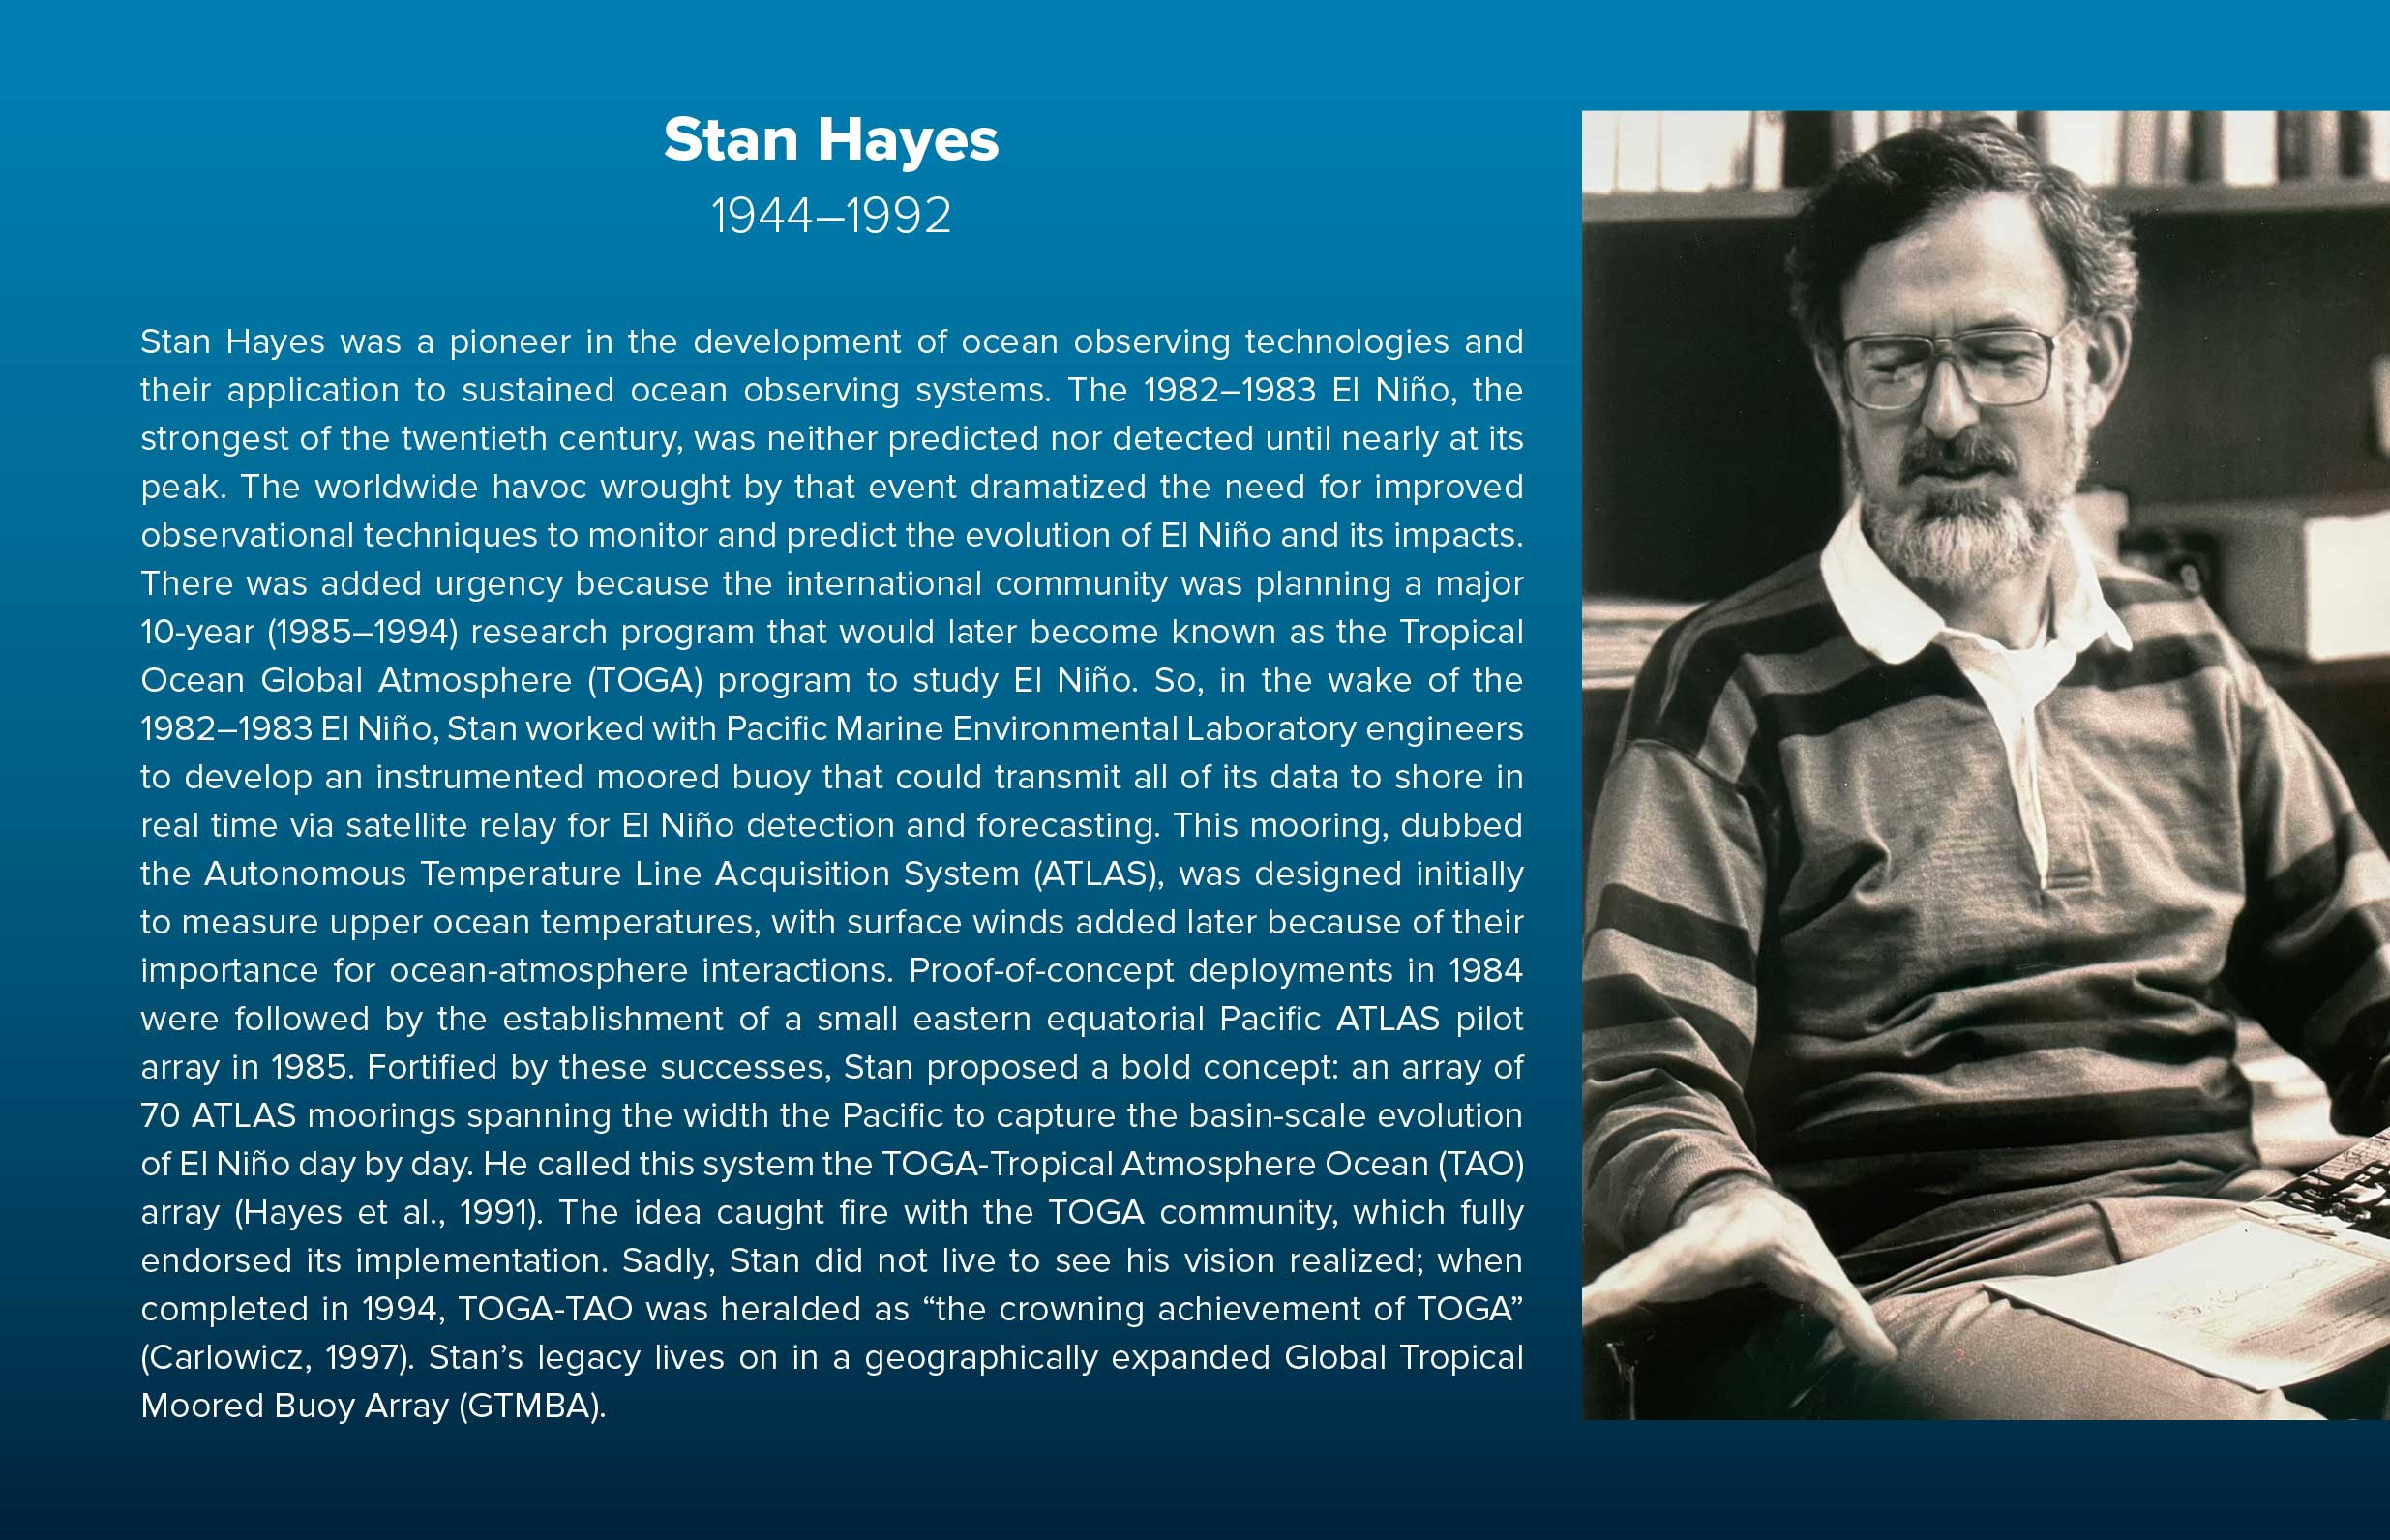
Moorings are ideally suited for studies of tropical ocean-atmosphere interactions because they can be instrumented to measure both upper ocean and surface meteorological variables from a single platform, they provide time-series measurements at high temporal resolution (minutes to hours) in order to reduce aliasing of short period fluctuations into lower frequency climate-scale signals, and they are maintained at fixed locations so the data do not convolve variability in space and time. The breakthrough technology that made the TAO array, and later GTMBA, possible was the development of the Autonomous Temperature Line Acquisition System (ATLAS) mooring inspired by Stan Hayes and designed by Hugh Milburn and the PMEL engineering staff in the early 1980s (see tribute to Stan Hayes at the end of this article). The basic ATLAS mooring system provided SST, upper ocean temperature, surface winds, and other meteorological parameters in real time via satellite relay so that they could be ingested into operational analysis and forecast systems for weather and seasonal climate prediction. The design eliminated bulky and expensive mechanical current meters that required complicated mooring line attachments and were prone to biofouling near the surface. As a result, the mooring lifetime could be extended from six months to one year, production costs were significantly reduced, and the use of a simplified mooring line allowed for real-time subsurface data telemetry. It thus became possible to envision developing and sustaining an array of ATLAS moorings spanning the width of the tropical Pacific basin to support ENSO research and forecasting.
The ATLAS mooring design has been updated several times over the years to take advantage of advances in sensor technology, electronics, data transmission systems, and hardware components (Figure 2). Some organizations contributing to GTMBA have also developed their own versions of the ATLAS mooring based on PMEL’s design principles. For example, in the late 1990s, the Japan Agency for Earth-Science and Technology (JAMSTEC) developed the ATLAS-like TRITON mooring that eventually replaced ATLAS moorings in the western Pacific (Ando et al., 2017). Likewise, in the first decade of this century, National Data Buoy Center (NDBC) “TAO Refresh” moorings replaced ATLAS moorings in the Pacific.
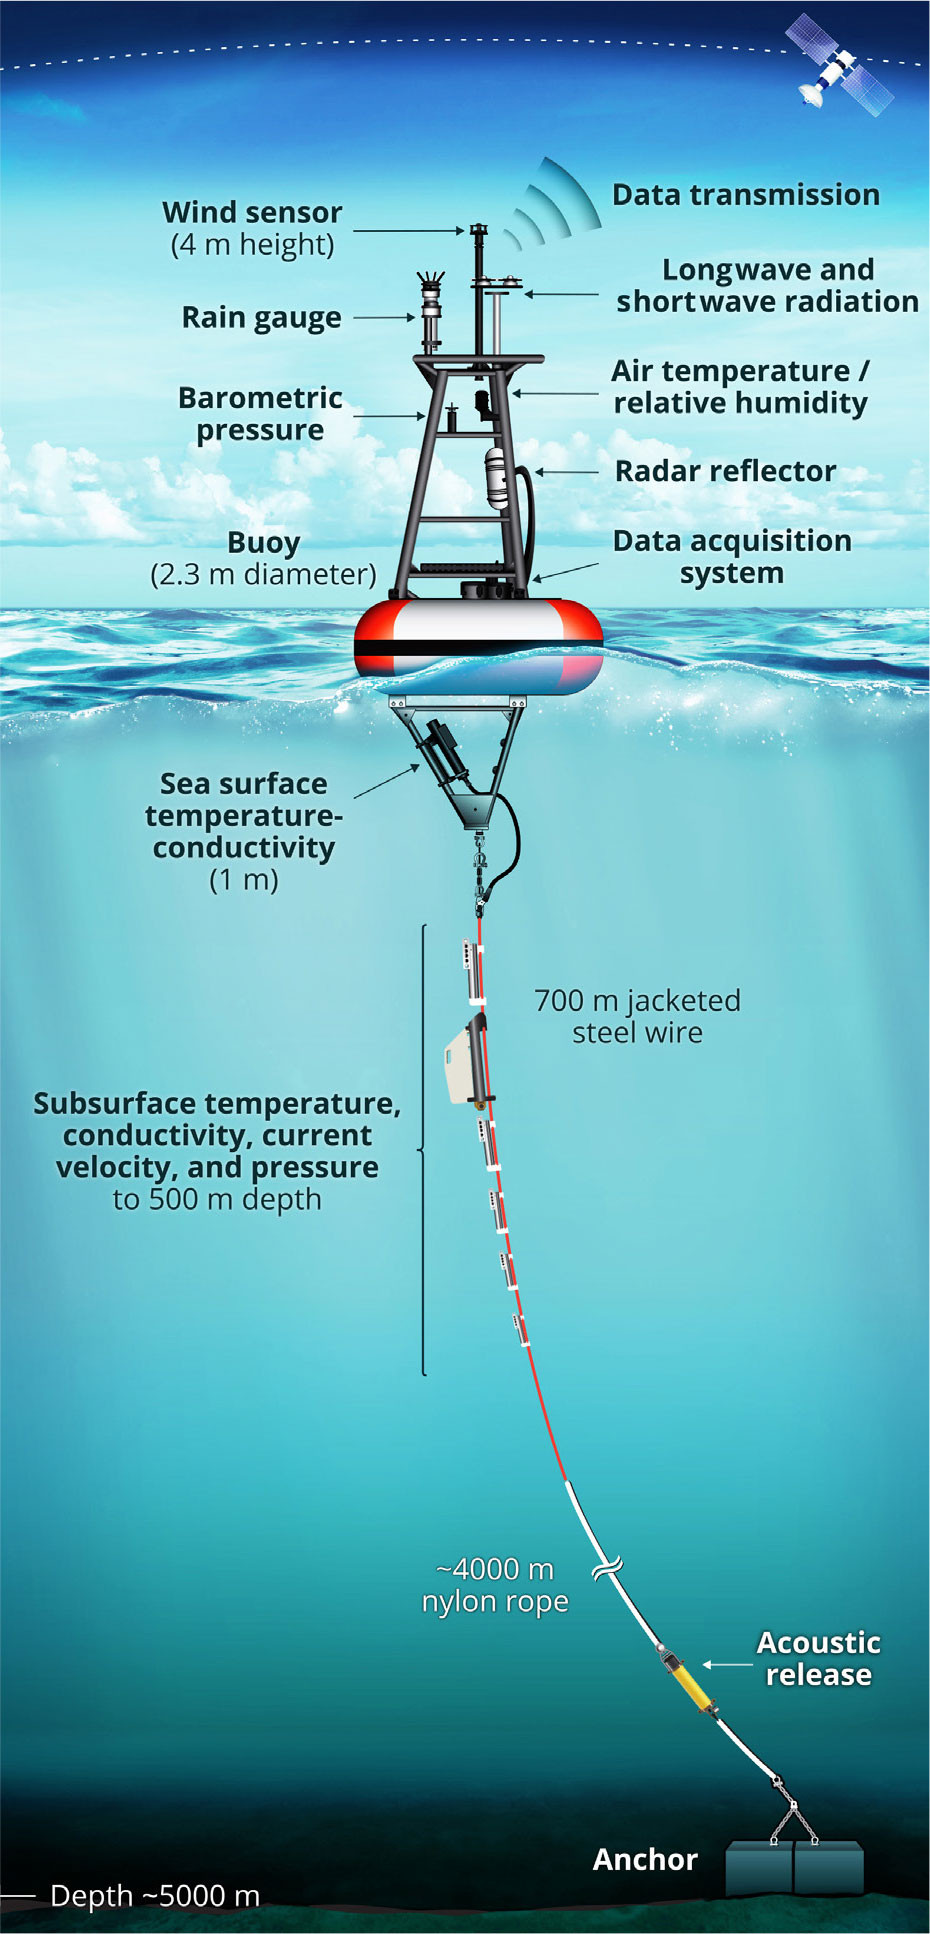
FIGURE 2. Schematic representation of a GTMBA surface moored buoy. The minimum set of measurements includes surface winds, air temperature, relative humidity, sea surface temperature (SST, nominally at 1 m depth), temperature at 10–12 depths in the upper 500 m, and ocean pressure at two depths. Surface salinity, subsurface salinity, mixed-layer currents, and additional meteorological variables as shown are also measured on many moorings. GTMBA data are distributed in real time on the Global Telecommunications System (GTS) several times a day to operational weather, ocean, and climate forecasting centers around the world. They are also posted daily and made freely available from the NOAA Pacific Marine Environmental Laboratory GTMBA website (https://www.pmel.noaa.gov/tao/drupal/disdel/) as well as from several websites maintained by partner institutions. The data are permanently archived at the National Centers for Environmental Information (NCEI). > High res figure
|
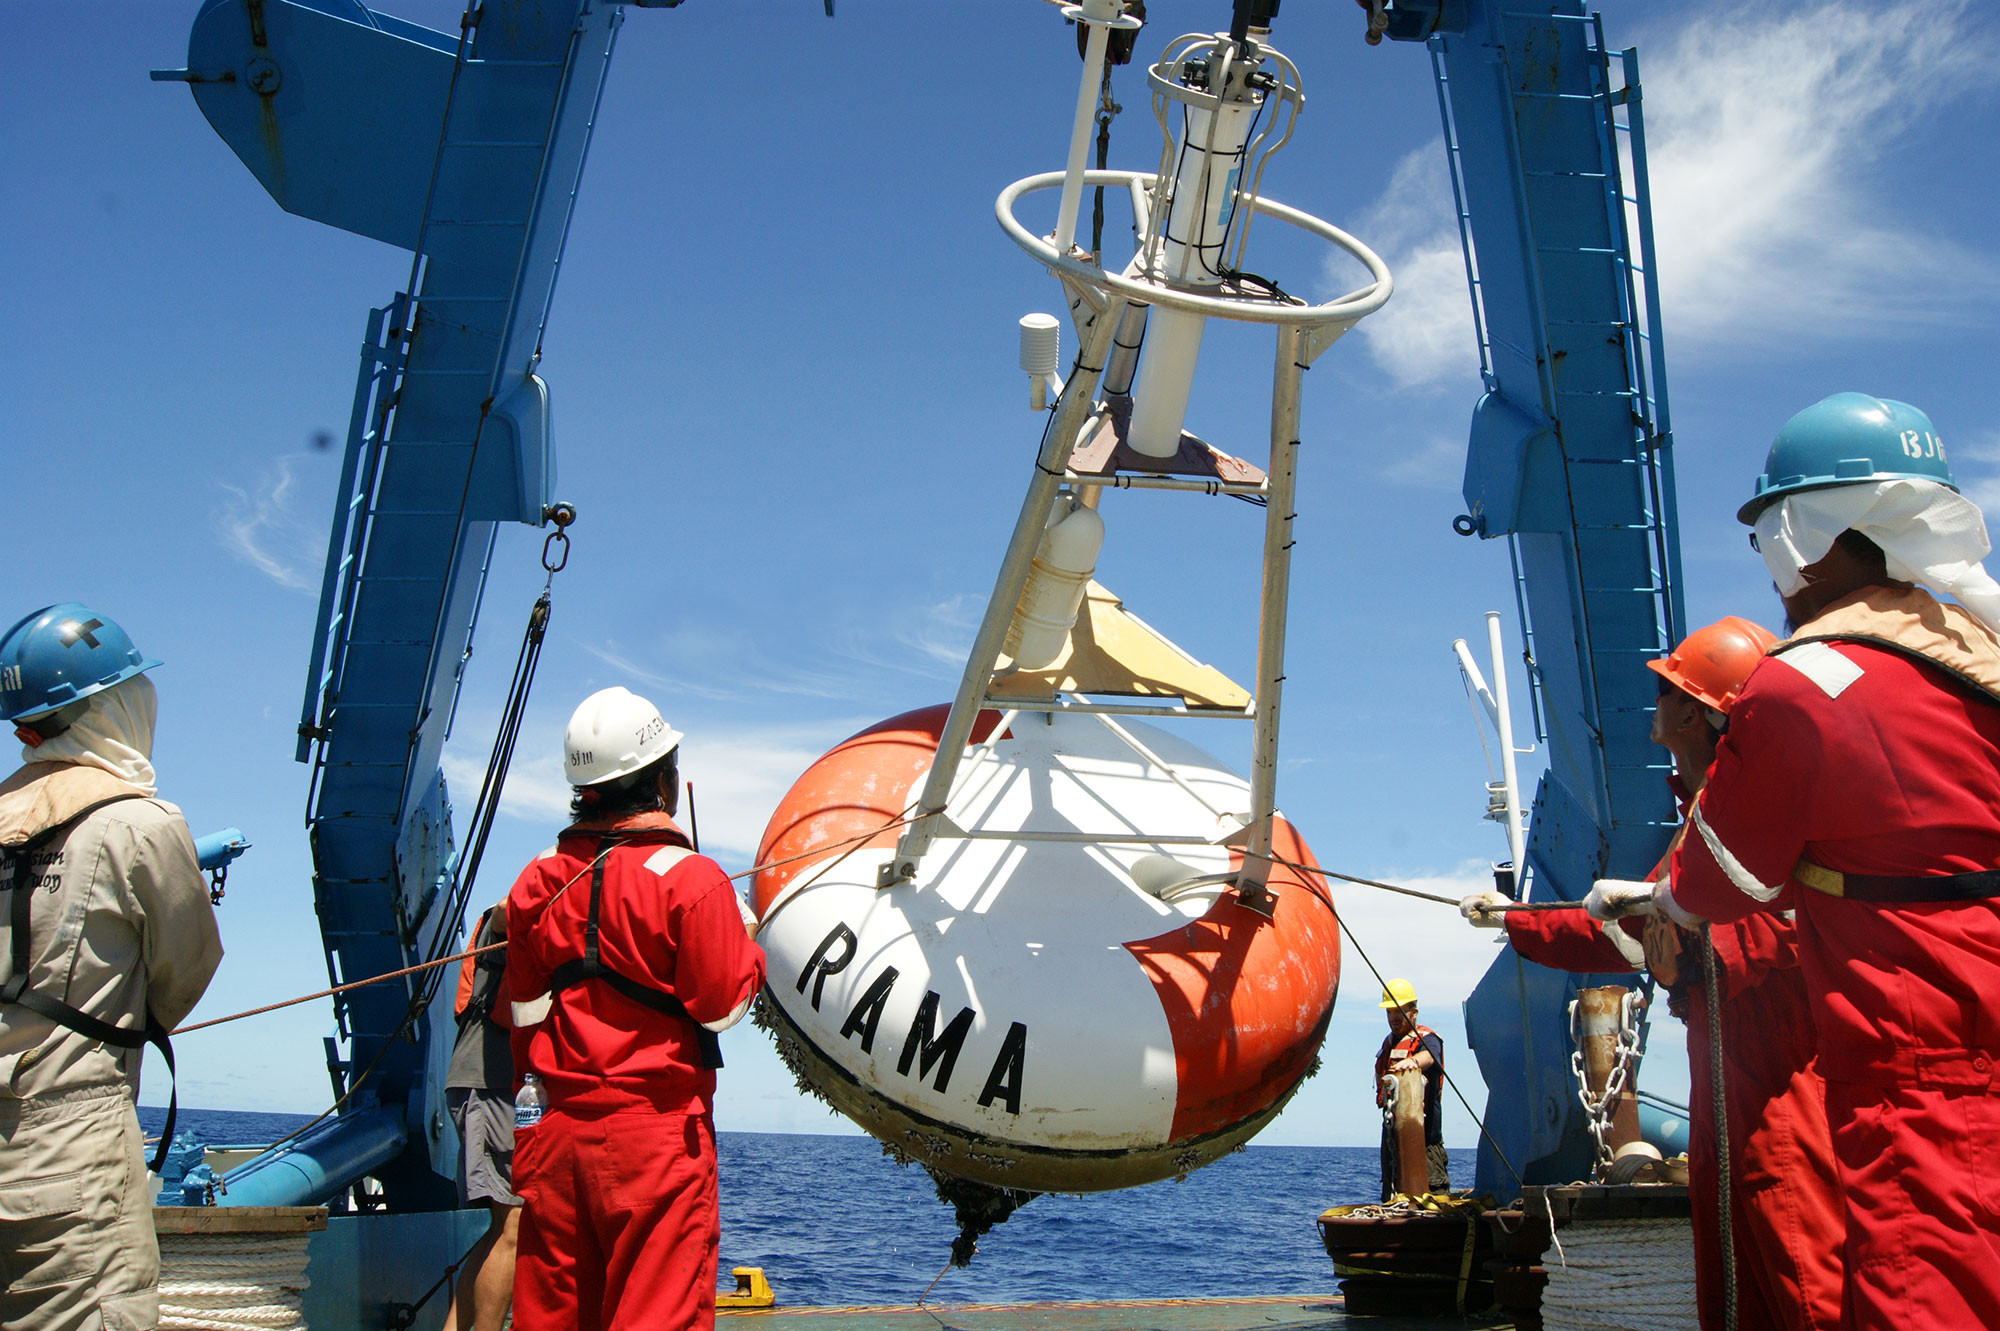
Building and sustaining GTMBA has been a monumental effort requiring an armada of research vessels. The one-year design lifetime of the moorings requires servicing cruises at approximately annual intervals to recover and redeploy new moored buoys at each site. Thus, since the first prototype GTMBA mooring was successfully deployed on the equator in 1976 until the end of 2022, 523 cruises were carried out on 55 ships from 17 countries spending 14,552 days at sea to deploy 2,947 GTMBA moorings.
GTMBA data are distributed in real time via the Global Telecommunications System to environmental forecasting centers worldwide. In addition, for the period covered by this overview (2010 to early 2023), over 1,400 refereed journal articles cited use of GTMBA data according to the Web of Science. These included 562 citations specific to TAO/TRITON, 363 for PIRATA, and 418 for RAMA, with additional publications citing use of data from more than one ocean basin. GTMBA data are used extensively in oceanic and atmospheric reanalysis products and for satellite and model validation. They are the primary data source for the International OceanSITES program of sustained Eulerian observatories (http://www.oceansites.org/) and are one of the most valuable data sources for constraining and validating surface flux data products in the global tropics (e.g., Praveen Kumar, 2012; Yu, 2019). They are also incorporated into many satellite/in situ blended data products and observational databases for SST, surface winds, surface currents, and subsurface temperature and salinity.
Significant change has occurred in GTMBA since the last comprehensive overview of the three-basin system was published (McPhaden et al., 2010b). In the following section, we describe the evolution of the observing system since 2010, highlighting a few scientific advances in each ocean basin. The sidebar by Connell et al. (2023, in this issue) describes how the extraordinary challenges of piracy and the COVID-19 pandemic affected GTMBA during this period. In the final section, we synthesize results from three recent comprehensive but largely uncoordinated reviews of the tropical Pacific, Atlantic, and Indian Ocean observing systems to highlight specific recommendations for the moored buoy arrays in each basin and to summarize commendations common to all three as a framework for advancing GTMBA development in the future.
Basin-by-Basin Developments Since 2010
TAO/TRITON
The TAO array has been a major observational component of ENSO research and operational weather and climate forecasting since its inception in 1984. The array was completed in 1994 and became known as TAO/TRITON in 2000 with the introduction of TRITON moorings in the western Pacific. Beginning in 2005, operations and management of the TAO portion of TAO/TRITON were transferred from PMEL to NDBC. As part of the five-year research-to-operations transition, NDBC developed the TAO Refresh mooring to update PMEL’s ATLAS design using commercially available sensors and Iridium satellite data telemetry for greater real-time data throughput.
Data from TAO/TRITON have proven to be valuable for describing and understanding processes involved in ocean-atmosphere interactions, ocean circulation, weather, and climate across a broad range of temporal and spatial scales. For example, Amaya et al. (2015) used moored velocity time series and other data to show how over two decades leading up to and including the recent hiatus in global warming (Fyfe et al., 2016), increased trade wind forcing accelerated the core of the Equatorial Undercurrent and intensified equatorial upwelling associated with the shallow meridional overturning circulation in the central Pacific. Farrar and Durland (2012) employed more than a decade of TAO/TRITON data to define in unprecedented detail the frequency-zonal wavenumber spectrum of baroclinic equatorial waves at periods of 3–15 days, verifying the theory for linear wind-forced equatorial inertia-gravity and mixed Rossby-gravity waves in the Pacific basin. Yan et al. (2021) used hourly TAO/TRITON and other GTMBA data to show how diurnal variability in sea surface skin temperature controls the remarkably strong diurnal cycle of latent heat flux in the tropics (exceeding at times 20 W m−2), noting that resolving these diurnal variations will lead to significantly improved estimates of climatological latent heat fluxes that are so central to ocean-atmosphere interactions.
The TAO measurement suite has changed over time to address evolving scientific priorities. The equatorial Pacific, for example, is a major source of carbon dioxide to the atmosphere through outgassing in the upwelling zone of the eastern Pacific’s equatorial cold tongue region. To estimate the flux of CO2 across the air-sea interface, the first pCO2 sensors were added in 2004 to two TAO equatorial moorings at 125°W and 140°W, then later expanded in 2010 to include more equatorial stations and a site located at 8°S, 165°E in the South Pacific Convergence Zone (Saint-Lu et al., 2015). These mooring observations confirmed that ENSO controls much of the interannual variability in surface seawater pCO2 and provided the first estimates of long-term pH trends to document the acidification of the equatorial Pacific (Sutton et al., 2014). Similarly, vertical turbulent mixing is a key process regulating the heat, mass, and momentum budgets in the equatorial ocean. In 2005, a new instrument for measuring time series of ocean turbulence microstructure developed by Oregon State University (OSU) was added to the 0°, 140°W mooring and then expanded to 0°, 110°W in 2009. Multi-year time series of these data collected at several depths near the surface demonstrated for the first time through direct measurements the controlling influence of turbulent mixing on the mean seasonal cycle of SST in the equatorial cold tongue (Moum et al., 2013).
In 2012, the TAO/TRITON array suffered a major setback with the decommissioning of NOAA Ship Ka’imimoana, which had serviced the array since 1996. Without mooring maintenance, data return sharply declined to a record low of 30%. At about the same time, JAMSTEC, NOAA’s principal partner in maintaining TAO since 2000, announced a phased withdrawal of TRITON moorings from the western Pacific. These events focused international attention on the need to sustain the Pacific array, and they were a key motivator for development of the Tropical Pacific Observing System (TPOS) 2020 project initiated to review the design of TAO/TRITON and to recommend changes in light of the satellite and in situ observing technologies that were unavailable when the array was originally conceived (Kessler et al., 2021).
TAO data return began to rebound in 2014, and they have provided a continuous record of the past decade’s extraordinary ENSO variability. For example, a major El Niño appeared to be underway in early 2014 and, to everyone’s surprise, suddenly died (McPhaden, 2015). This was followed by the first major El Niño of the twenty-first century in 2015–2016 (L’Heureux et al., 2017), with an amplitude may have been boosted by heat content lingering below the surface from the failed 2014 El Niño (Levine and McPhaden, 2016). Chiodi and Harrison (2017) showed how episodic wind forcing evident in TAO/TRITON data played a major role in the development of these events. Westerly wind bursts led to development of El Niño warming in early 2014 that was then arrested by subsequent easterly trade wind surges; in contrast, the major 2015–2016 El Niño featured an abundance of westerly wind bursts that contributed to rapid and sustained anomalous equatorial warming.
Most recently, the first “triple dip” La Niña of the twenty-first century occurred in the tropical Pacific, a rare situation where La Niña conditions persist for three successive years (McPhaden, 2023). A leading hypothesis for multi-year La Niñas is that they occur on the rebound from preceding extreme El Niños (DiNezio et al., 2017), which drain the equatorial band of upper ocean heat content through recharge oscillator dynamics (Jin, 1997), causing the thermocline to shoal and leaving a large heat deficit that takes multiple years to recover. The three strongest El Niños of the past 40 years illustrate this pattern (Figure 3). The 1982–1983 and 2015–2016 El Niños were both followed by La Niñas extending over two years, and the 1997–1998 event was followed by three successive years of unusually cold tropical Pacific SSTs. Each of these El Niños was associated with a significant discharge of upper ocean heat content from the equatorial band (e.g., Figure 4a). The recent multi-year La Niña did not have such precursors. Antecedent conditions in the tropical Pacific were characterized by a borderline 2019 El Niño followed by no significant upper ocean heat content discharge (Figure 4b).
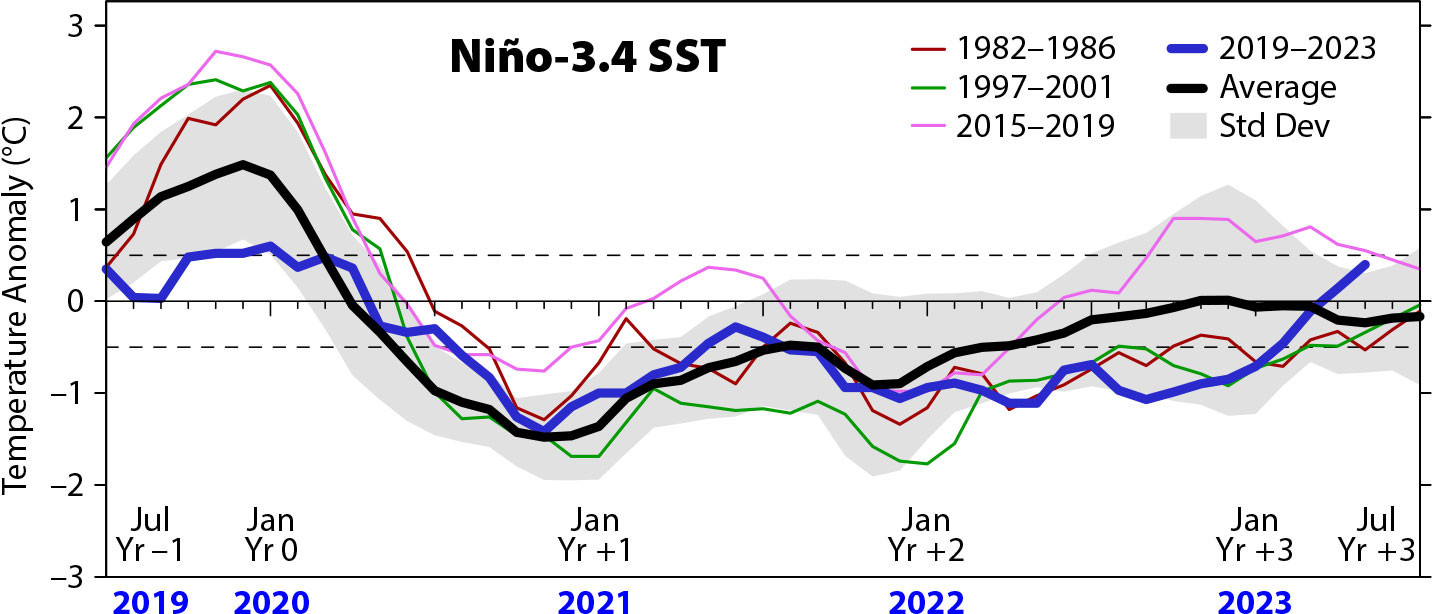
FIGURE 3. Monthly mean SST from July 2019 to May 2023 (blue line) in the Niño-3.4 index region (5°N–5°S, 120°–170°W). The black line plots monthly mean Niño-3.4 SST averaged over 10 La Niña events since the 1950s, beginning in July the year before (Yr –1) the first SST minimum (in Yr 0) and extending to the beginning of the third year (Yr +3) following La Niña onset. Shading indicates ±1 standard deviation. La Niñas following the three strongest El Niños of the last 40 years are also shown. Dashed horizontal lines indicate the threshold for El Niño (>0.5°C) and La Niña (<–0.5°C). Niño-3.4 SSTs are from the Extended Reconstructed Sea Surface Temperature version 5 (ERSSTv5). > High res figure
|
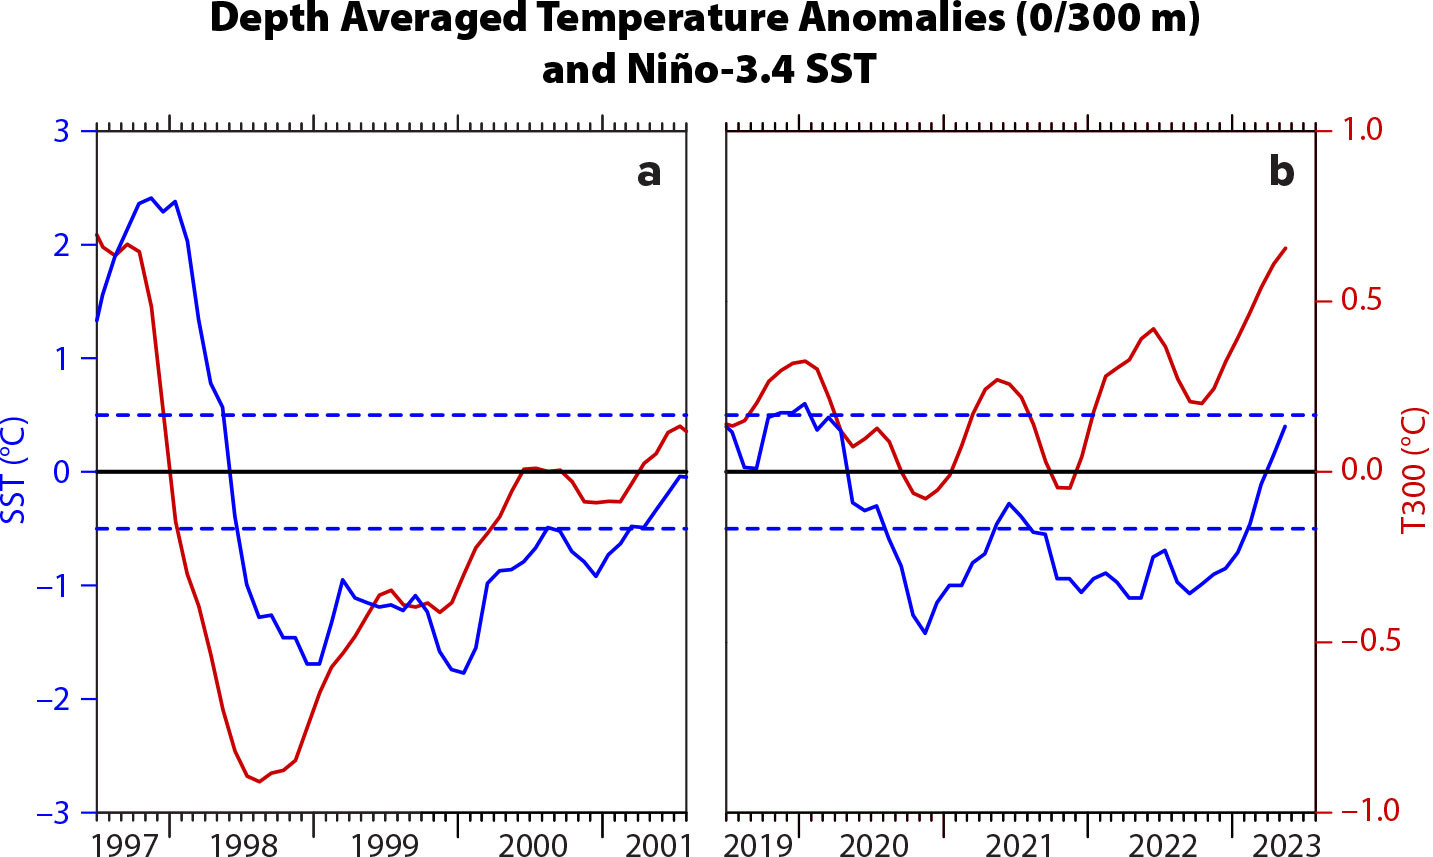
FIGURE 4. Relationship of Niño-3.4 SST (blue lines) to an index of upper ocean heat content (red lines) defined as temperature anomalies averaged in the upper 300 m between 5°N and 5°S across the entire Pacific basin (T300) for the period encompassing the triple dip La Niñas of (a) 1998–2001, and (b) 2020–2023. Note large deficit of heat that preceded development of the 1998–2001 La Niña in contrast to the generally positive heat content anomalies prior to and during the 2020–2023 La Niña. The blue dashed lines define the ±0.5°C Niño-3.4 SST neutral zone; SSTs above (below) indicate El Niño (La Niña) conditions. T300 is based on a blend of Tropical Atmosphere Ocean Array/Triangle Trans-Ocean Buoy Network (TAO/TRITON), expendable bathythermograph, and, after the early 2000s, Argo profiling float data. > High res figure
|
What caused the recent three-year La Niña is thus an open question. Hypotheses include tropical inter-basin interactions (Hasan et al., 2022), aerosols from the 2019–2020 Australian wildfires (Fasullo et al., 2023), and possible influences from higher latitudes of the North and South Pacific (e.g., Ding et al., 2022). Notably, these hypotheses involve sources of predictability for multi-year La Niñas originating outside the equatorial Pacific Ocean.
PIRATA
Partner institutions in the United States, France, and Brazil established PIRATA in 1997 as the first major building block of what is now called the Tropical Atlantic Observing System (TAOS; Johns et al., 2021). The principal partners are NOAA, the French Institut de Recherche pour le Développement (IRD), Météo-France, the Brazilian National Institute for Space Research (Instituto Nacional de Pesquisas Espaciais, INPE), and the Brazilian Navy (Diretoria de Hidrografia e Navegação, DHN). These partners have committed to support PIRATA since 2001 through a formal memorandum of understanding (MOU), renewed approximately every five years and most recently in February 2022. Under the terms of this MOU, NOAA provides surface mooring equipment for the entire array and ship time for the PIRATA Northeast Extension (PNE), while France and Brazil provide ship time for eastern and western portions of the array, respectively. GEOMAR’s Helmholtz Center in Germany provides equipment to maintain an acoustic Doppler current profiler mooring in the center of the array at 0°, 23°W, and France maintains two additional PIRATA ADCP moorings at 0°, 0°; and 0°, 10°W. A PIRATA Resource Board, made up of members from agencies supporting the program in each country, is charged with finding the resources required to meet the program’s scientific objectives as defined by the PIRATA Scientific Steering Group (SSG).
PIRATA’s configuration has been relatively stable since 2010 (Figure 1), with a few exceptions. For example, a mooring at 6°S, 8°E was first occupied on a one-year trial basis in 2007–2008, reestablished in 2013 with the intent of maintaining it permanently, and then suspended in 2019 after repeated mooring losses due to fishing vandalism. A new site in the historically data sparse tropical South Atlantic Ocean (20°S, 10°W) was then occupied in 2020.
The PIRATA moored measurement suite has become more multidisciplinary over time. Two sites (6°S, 10°W and 8°N, 38°W) have measured near-surface ocean pCO2 since 2008, and the 6°S, 8°E site was similarly instrumented from 2017 to 2019 with support from European Horizon2020 (https://research-and-innovation.ec.europa.eu/) and AtlantOS (http://www.atlantos-ocean.org/). Data from these moorings documented intraseasonal, seasonal, and interannual variations in air-sea CO2 fluxes and the processes responsible for them in key regions of the tropical Atlantic (Lefévre et al., 2016; Bruto et al., 2017). Since 2008, dissolved oxygen sensors have been deployed at three sites (4°N, 23°W; 11.5°N, 23°W; and 20.5°N, 23°W) at depths between 80 m and 500 m to monitor variability in the oxygen minimum zone with support from GEOMAR’s Helmholtz Center and AtlantOS. In addition, since 2014 all PIRATA moorings have been equipped with Ocean Tracking Network (OTN; https://oceantrackingnetwork.org/) acoustic instruments to track marine animals.
The cruises that service PIRATA moorings support numerous measurement and research efforts. NOAA’s Atlantic Oceanographic and Meteorological Laboratory (AOML) annually samples along 23°W to monitor temperature, salinity, currents, and dissolved oxygen between the surface and 1,500 m depth (e.g., Brandt et al., 2015). Since the 2006 inception of the PNE, the Aerosols and Ocean Science Expeditions (AEROSE) Project—a collaboration between NOAA, Howard University, and Arizona State University—has joined most of the cruises to obtain measurements of African dust and anthropogenic aerosols, clouds, atmospheric chemistry, and full-column profiles of pressure, temperature, humidity, winds, and ozone from radiosondes and ozonesondes (e.g., Nalli et al., 2016). Since 2021, research partners have collected Sargassum and nutrient samples during PNE cruises with the goal of understanding interactions between Sargassum and the carbon cycle.
There is a strong focus on education and training during PNE-AEROSE cruises, with several students and early career scientists, the majority of whom are from underrepresented groups, participating in the fieldwork. The multidisciplinary Brazilian and French PIRATA servicing cruises also provide opportunities for training early career scientists. PIRATA Brazil has hosted summer schools, and PIRATA France supports a well-established physical oceanography graduate program in Benin, Africa, training the next generation of leaders in Atlantic oceanography (Bourlès et al., 2019).
PIRATA data have been widely used for studies of ocean-atmosphere interactions, ocean circulation, and climate variability in the tropical Atlantic. For example, Brandt et al. (2021) used PIRATA measurements to quantify variability associated with the equatorial zonal current systems, and Perez et al. (2014) used PIRATA data to describe meridional current variations associated with the Atlantic equatorial upwelling circulation. Embedded within PIRATA, the Tropical Atlantic Current Observations Study (TACOS) deployed 10 acoustic current meters on the 4°N, 23°W PIRATA mooring from 2017 to 2020 to improve understanding of upper ocean circulation and the processes that affect mixing (e.g., current shear and stratification). Analysis of these data revealed the vertical structure of currents during tropical instability waves (TIWs; Perez et al., 2019; Specht et al., 2021) and interannual changes in TIW intensity (Perez et al., 2012; Tuchen et al., 2022). Using enhanced measurements from the 0°, 23°W PIRATA mooring, Wenegrat and McPhaden (2015) showed the importance of TIWs in modulating the diurnal cycle of velocity shear and stratification, which affect vertical turbulent transfers of heat, mass, and momentum.
Understanding processes like TIWs that drive variability of SST and sea surface salinity (SSS) is important because of strong coupling between SST and the atmosphere in the tropical Atlantic. Data from PIRATA moorings, especially when combined with other elements of the observing system such as Argo, surface drifters, and satellites, have advanced understanding of the mixed layer heat and salinity balances that determine SST and SSS. However, until recently, the moorings traditionally did not collect routine measurements of ocean turbulent mixing, which is critical for bringing colder, saltier water into the surface mixed layer, because of the very small spatial and temporal scales on which mixing occurs. As a result, the vertical turbulent heat flux had to be estimated as the residual from the calculated terms in the heat balance. The implied mixing was often a major contributor to the heat balance, especially in the eastern equatorial Atlantic, but large error bars complicated its interpretation (Foltz et al., 2018; Figure 5a). During 2005–2010, direct measurements of mixing from microstructure sensors carried out during French PIRATA cruises provided the means to test the validity of mixing rates inferred from the heat budget residuals (Hummels et al., 2013). In the eastern equatorial Atlantic, remarkable agreement was found between directly calculated cooling rates and those calculated indirectly from the heat budget residual (Figure 5). Beginning in 2014, several OSU microstructure instruments were attached to the 0°, 10°W and 0°, 23°W mooring lines to allow continuous measurements of turbulent dissipation in the upper 80 m (Moum et al., 2022). Consistent with ship-based measurements, data from the moored turbulence sensors show elevated turbulent dissipation above the core of the Equatorial Undercurrent (EUC).
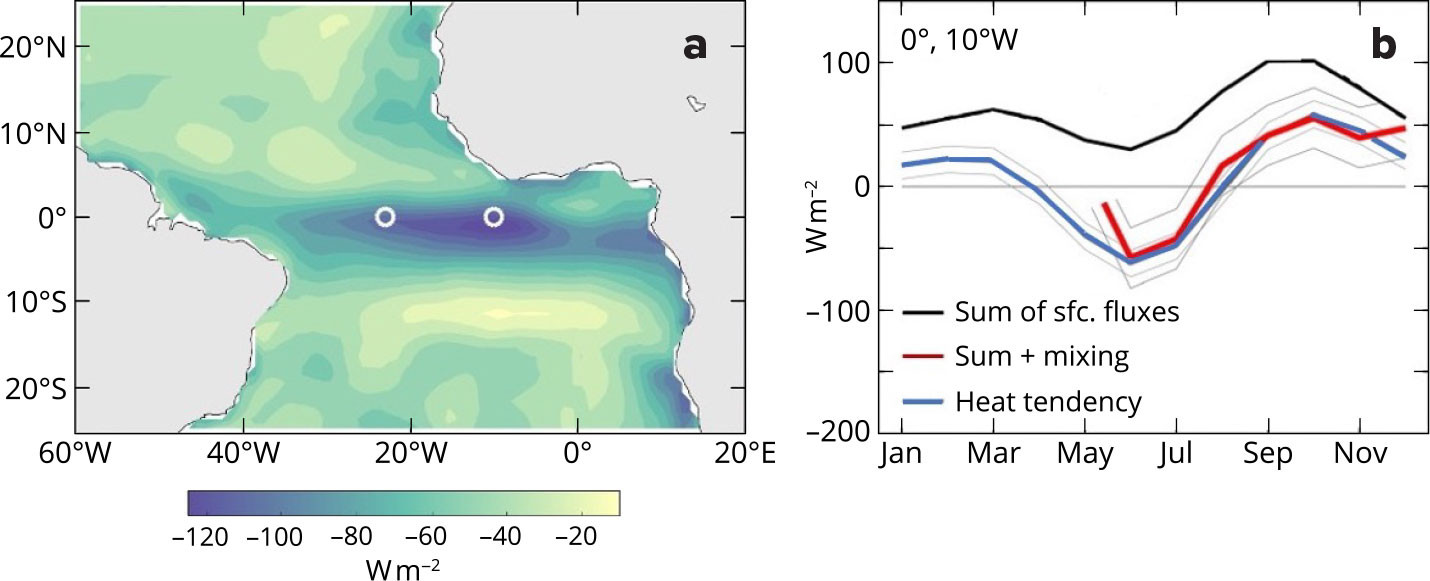
FIGURE 5. Mixed layer heat budget and vertical turbulent mixing at Prediction and Research Moored Array in the Tropical Atlantic (PIRATA) mooring sites. (a) Map shows mixed layer heat budget residual, calculated from gridded satellite and model reanalysis data as the rate of change of mixed layer heat content minus the sum of surface heat fluxes. White circles mark the locations of the PIRATA buoys equipped with ocean turbulence sensors. (b) Plots track 0°, 10°W sum of surface heat fluxes without (black) and with (red) vertical turbulent heat flux from microstructure measurements, based on Hummels et al. (2013). The blue line shows the observed rate of change of mixed layer heat content, and thin gray lines indicate error bars on the red and blue lines. > High res figure
|
RAMA
RAMA is a cornerstone of the regional GOOS network in the Indian Ocean known as the Indian Ocean Observing System (IndOOS). Since its inauguration in 2004, RAMA has been sustained by partnerships between PMEL and several key organizations that include India’s Ministry of Earth Sciences (MoES), the Indonesian Meteorology, Climatology, and Geophysical Agency (BMKG), China’s former State Oceanic Administration (SOA, recently subsumed into the Chinese Ministry of Natural Resources), and JAMSTEC. In some cases, such as with MoES and BMKG, the partnerships are underpinned by regularly renewed five-year MOUs. In 2017, PMEL established a new partnership with the Korean Institute of Ocean Science and Technology (KIOST) that focuses on a joint program to study physical and biogeochemical processes at work in the Seychelles Chagos Thermocline Ridge region of the southwestern tropical Indian Ocean. Similar to PIRATA, PMEL provides most of the mooring equipment while partners provide most of the ship time. India, Japan, and China also maintain moorings at selected locations around the basin that contribute to RAMA. Scientific oversight is provided by the Indian Ocean Regional Panel sponsored by CLIVAR (Climate and Ocean: Variability, Predictability, and Change) and GOOS, with financial support coordinated through the IndOOS Resource Forum.
CLIVAR and GOOS sponsored an international decadal review of IndOOS that took place from 2017 to 2019 (Beal et al., 2020). This review recommended reducing the original RAMA design of 46 mooring sites (McPhaden et al., 2009) to a smaller array of 31 sites based on evolving scientific imperatives and practical lessons learned since the array’s inception. The new design, referred to as RAMA-2.0 (Figure 1b) eliminated some mooring sites prone to repeated vandalism and others that were logistically difficult to service regularly.
The IndOOS review also recommended that there be a closer working relationship between RAMA and India’s Ocean Moored Buoy Network in the northern Indian Ocean (OMNI). A stumbling block, however, was that RAMA data were freely available through PMEL’s web-based user interface while OMNI data were behind a firewall. To resolve this problem, in July 2018, the Secretary of MoES announced a new open data policy for OMNI buoys in international waters. NOAA and MoES concretized this milestone by developing a RAMA-OMNI data delivery web portal that now serves both data sets freely and openly. This portal was launched in August 2021, coincident with the signing of the most recent five-year renewal of the NOAA-MoES partnership agreement.
Although RAMA-2.0 has fewer moorings, several of them have been enhanced with additional instrumentation for specific purposes. These include a mooring at 15°N, 90°E initially supported by the Bay of Bengal Large Marine Ecosystem program as part of the Global Ocean Acidification Observing Network (GOAN; http://goa-on.org/) to measure pCO2 and pH. Data from this site have contributed to our understanding of processes involved in air-sea CO2 exchange and have established a surface pCO2 and pH baseline for assessing future changes in the region (Sutton et al., 2019). An ocean color sensor deployed at 0°, 80.5°E for studies of marine primary productivity has shown that in an otherwise oligotrophic part of the equatorial Indian Ocean, sporadic blooms occur on intraseasonal timescales related to turbulent entrainment of nutrient-rich thermocline water into the mixed layer generated by the MJO and other short timescale phenomena (Strutton et al., 2015). As in PIRATA, OTN sound sensors have been deployed on most RAMA moorings since 2014 to track marine animals.
Many turbulence microstructure sensors have been deployed on RAMA moorings to document the temporal evolution of turbulent mixing in the upper ocean and how that mixing affects the vertical distribution of heat, salt, and momentum. These studies have identified for the first time how vertical turbulent mixing varies seasonally in response to monsoon wind and buoyancy forcing in the Bay of Bengal (Warner et al., 2016), how it varies with the phase of the MJO (Moum et al., 2014), and how it varies in response to the passage of convectively coupled atmospheric Kelvin waves along the equator (Pujiana and McPhaden, 2018).
RAMA data have provided fundamentally new insights into near-equatorial Indian Ocean circulation, including details of the three-dimensional mean westerly wind-driven downwelling circulation along the equator (Wang and McPhaden, 2017) and the structure of monsoon wind-driven seasonal cross equatorial flow consistent with Ekman dynamics (Horii et al., 2013; Wang and McPhaden, 2017). Nagura and McPhaden (2010) and McPhaden et al. (2015) described how Wyrtki jets (intense eastward flows along the equator that develop in the transition seasons between the northeast and southwest monsoons) contribute to the development of the Indian Ocean Dipole via shifting mass and heat east and west along the equator (Figure 6).
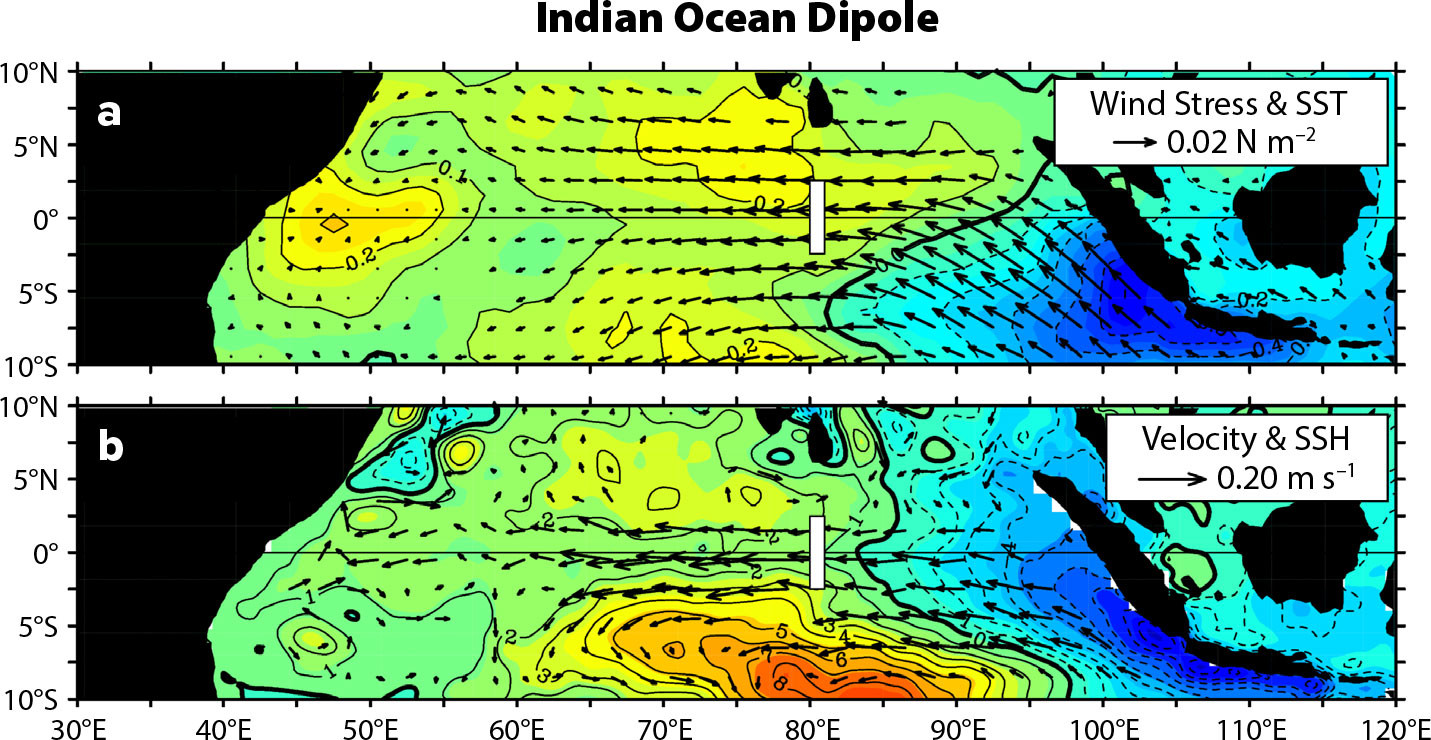
FIGURE 6. (a) SST and surface wind stress, and (b) satellite sea surface height and surface layer zonal currents regressed against zonal volume transport anomalies from an array of ADCP moorings deployed along 80.5°E (McPhaden et al., 2015). The pattern shown, which is for an anomalously weak Wyrtki jet, resembles the structure of a positive Indian Ocean Dipole at its September to November peak. Anomalies flip the sign for an anomalously strong Wyrtki jet, which would be associated with a negative Indian Ocean Dipole. The white strip indicates the location of the 80.5°E volume transport array used to compute the nine-year-long (2005–2013) index time series for the regression. > High res figure
|
The MJO, with periods nominally in the range of 30–60 days, is spawned over the Indian Ocean. It is implicated in a wide range of impacts on weather variations around the globe (Zhang, 2013) and is thus a prime target in the subseasonal-to-seasonal (S2S) forecasting initiative of the World Meteorological Organization (Brunet et al., 2010), which is intended to seamlessly bridge the gap between daily weather forecasts and seasonal climate forecasts. The signature of the MJO is evident in Indian Ocean SST, particularly in the Seychelles Chagos Thermocline Ridge where the mean thermocline is shallow. This shallow thermocline facilitates vertical turbulent entrainment into the mixed layer, which, because it is thin in this region, amplifies the response to surface heat flux forcing. The SST variations feed back to the atmosphere and play a role in organizing atmospheric convection and its eastward propagation on MJO timescales (Moum et al., 2014).
Aside from ocean-atmosphere feedbacks, the ocean’s dynamical response to MJO forcing affects ocean currents, sea level, thermocline depth, and barrier layer formation. Through their influence on equatorial wave generation and propagation, MJO signals are ubiquitous in the near equatorial band (e.g., Iskandar and McPhaden, 2011), can be traced into the interior of the Bay of Bengal (Girishkumar et al., 2013a), and penetrate the Indonesian Seas to affect the Indonesian Throughflow (Pujiana et al., 2019). A more complete summary of scientific advances enabled by RAMA can be found in McPhaden et al. (2023), including the ocean’s response to severe cyclonic storms (Cuypers et al., 2013; Jarugula and McPhaden, 2022), the importance of salt stratified barrier layers in trapping heat near the surface (Girishkumar et al., 2013b), and the prominence of northward-propagating monsoon intraseasonal oscillations (MISOs) that affect active-break (wetter and drier) cycles of the southwest monsoon (Girishkumar et al., 2017; Shroyer et al., 2021).
The Way Forward
Recent decadal reviews of TPOS, TAOS, and IndOOS have been carried out independently to evaluate how these observing systems perform in meeting the needs of a wide variety of stakeholders, including the research and forecasting communities (Beal et al., 2020; Johns et al., 2021; Kessler et al., 2021). These reviews make recommendations pertaining to basin-specific components of GTMBA in order to provide a roadmap for its future evolution. The TPOS review, for example, recommends fewer but more heavily instrumented moorings similar to existing Flux Reference Sites. Some meridional mooring lines are recommended for extension further north into the Intertropical Convergence Zone and south into the South Pacific Convergence Zone where, for example, higher latitude influences on ENSO may be evident (e.g., Amaya, 2019). TPOS has also encouraged China’s experimental mooring efforts in the western Pacific, referred to as the Ding Array, in the wake of TRITON’s withdrawal. For PIRATA, there are recommendations to extend the array westward along 53°W to provide real-time data relevant for tropical cyclone forecasting and to establish a new site at 20°S, 10°W in the historically data sparse tropical South Atlantic. For RAMA, it was recommended to reduce the number of moorings due to vandalism and ship time constraints, to prioritize completing the array in the western basin along 55°E, and to coordinate more closely with the Indian OMNI program.
“It is guaranteed that Mother Nature will continue to surprise us with more extreme and unexpected weather and climate events originating in the tropics, so it is essential to have robust observing systems providing a regular stream of real-time data to support both research into fundamental ocean-atmosphere processes and environmental forecasting.”
|
There is much in common among these reviews, despite the fact that different communities conducted them without much coordination. All emphasize the importance of maintaining long time-series records that in some cases span more than 40 years. These records become more valuable as they grow, increasing the range of timescales that can be examined, sampling a greater variety of natural variations, and providing a baseline for assessing the impacts of future climate change on the tropical ocean and overlying atmosphere.
To improve our understanding of ocean-atmosphere interactions, the three reviews emphasize the need for higher vertical resolution temperature and salinity measurements in the ocean mixed layer, more stations instrumented for full surface flux estimates, more direct velocity measurements near the surface for studies of ocean circulation and its effects on SST, more upper ocean turbulence measurements for mixing studies, and more atmospheric pressure measurements to improve weather forecasts. All three reviews emphasize the importance of the diurnal cycle for modulating air-sea interactions and underscore the need for better observations of it to improve model physical parameterizations in support of fully coupled forecast systems.
Targeted process studies are recognized as vital for both improving models and testing of potential new observing system technologies. More model-based assessment studies of how mooring data impact operational analysis and forecasts are likewise needed. All three reviews stressed the need for greater integration of interdisciplinary measurements into the observing system to advance studies of the ocean carbon cycle and biogeochemical processes affecting ecosystem dynamics and fisheries.
Progress has already been made on implementing some of these recommendations. Others await resourcing and additional planning. Moreover, the variability and predictability of phenomena such as ENSO, Atlantic Niños, and the IOD are influenced by two-way tropical inter-basin interactions (e.g., Cai et al., 2019), so further evolution of GTMBA sampling strategies should take these dynamical linkages between basins into account.
Also noteworthy are two coordinated technology development efforts that are underway for next generation GTMBA mooring designs: the NDBC TAO Recapitalization and the PMEL TELOS (Telemetry, Electronics, & Logging of Oceanographic Sensors) projects. They have similar objectives and complementary design principles but somewhat different applications. Both will modernize aging and obsolete technology, allow for higher vertical resolution sampling in the mixed layer, enable additional sensor enhancements based on scientific needs, and increase real-time data throughput.
The next decade promises to be exciting as GTMBA evolves to address today’s societal challenges in the context of the GOOS 2030 observational strategy and the UN Decade of Ocean Science for Sustainable Development (Ryabinin et al., 2019). It is guaranteed that Mother Nature will continue to surprise us with more extreme and unexpected weather and climate events originating in the tropics, so it is essential to have robust observing systems providing a regular stream of real-time data to support both research into fundamental ocean-atmosphere processes and environmental forecasting. Thanks to its track record of innovation, the unique high-quality data it provides, and the multi-national partnerships that underpin it, GTMBA looks to a future of continued service to the scientific community and society as a key part of the value chain in weather and climate services.
Acknowledgments
We appreciate the constructive comments by Diane Stanitski and two anonymous reviewers on an earlier version of this manuscript. Special thanks to Dai McClurg and Sarah Battle of PMEL for their help with the graphics in this article. The success of GTMBA is a tribute to the many individuals who contributed to its development over a period of nearly 50 years. We grateful for the talent and dedication that GTMBA staff, past and present, brought to their work at PMEL, AOML, and NDBC. Thanks also to NOAA leadership and program managers who have enthusiastically supported GTMBA over the years. We acknowledge the many partner institutions, scientists, technicians, and administrators in the United States, France, Brazil, Germany, Japan, India, Indonesia, China, and Korea for their essential contributions to GTMBA. Finally, we wish to recognize the extraordinary efforts of the captains, crews, and scientific parties who conducted the hundreds of cruises necessary to build and sustain GTMBA. This is PMEL contribution no. 5945.