Full Text
Environmental DNA (eDNA)-based ecological co-occurrence networks can provide a valuable tool for fisheries and conservation management. In the past, it was nearly impossible to explore the microscopic world of larval fishes in one sampling event. Now, eDNA data and ecological co-occurrence network modeling provide windows into ecosystems that support larval fishes and upon which subsequent fisheries rely. Thus, there is great potential for eDNA methods coupled with ecological network analyses to provide a holistic understanding of community composition and species interactions and to develop indicators for fisheries and ecosystem-based management.
Marine larvae are important to marine ecosystems and fisheries, but predicting recruitment remains a fundamental challenge in fisheries science.
Most marine fishes and invertebrates produce many larvae that reside in the pelagic ocean for weeks to months, depending on the species. Mortality is high for most fishes during the larval stage, often upward of 99%, but because most species are highly fecund, small changes in larval survival can significantly alter survival to adult stages (i.e., recruitment; Houde, 1987). For this reason, elucidating the mechanisms that affect larval survival is an integral component of fisheries management. Despite over a century of recruitment research, accurately estimating the parameters that control larval survival has been difficult, and predicting conditions that facilitate recruitment remains a fundamental challenge in fisheries management (Hare, 2014).
In recent years, populations of the northern anchovy Engraulis mordax have undergone unprecedented recruitment variability. E. mordax is a major forage species in the California Current Ecosystem (CCE), serving as key prey for birds, marine mammals, and fishes, including commercially important fisheries species. Adult E. mordax abundance changed dramatically from 2014 to 2022 in the CCE. In 2014, adult anchovy abundance was among the lowest on record. Large recruitment classes, beginning in 2015, fueled a rapid rise in abundance, and by 2022 adult anchovy abundance approached a record high throughout the CCE. Surprisingly, this unparalleled population expansion occurred during the largest marine heatwave on record (Thompson et al., 2022), the opposite of the cool water conditions conventionally believed to favor anchovy (Chavez et al., 2003). Clearly, understanding the drivers of anchovy recruitment variability remains one of the greatest challenges in their assessment and management.
Ecological aspects of the larval habitat can be examined through biomolecular techniques.
Environmental conditions hypothesized to influence larval fish have been extensively studied and used to predict fish stocks. Examples include temperature and large-scale climate modes such as the Pacific Decadal Oscillation and the North Pacific Gyre Oscillation (Chavez et al., 2003). Nonetheless, these basin-scale parameters have been insufficient to predict observed variability in recruitment, likely because biophysical mechanisms are the primary drivers of recruitment. Therefore, the species that the larvae interact with in vivo (e.g., predators, prey, commensals, parasites) are likely key to understanding recruitment success or failure (Robert et al., 2014). However, understanding the ecosystem at this level has been difficult because plankton are patchily distributed, microscopic, often poorly characterized, and require extensive expertise and time to sort and identify. In addition, because larval predators can be numerous, it is difficult to quantify ecological interactions, and studying them requires extensive and diverse sampling and quantification techniques.
Fortunately, modern genetic tools provide a robust, rapid, and cost-effective way to characterize marine ecosystems more holistically and to help assess the biological factors that drive larval fish growth and survival. DNA-based approaches applied to individual tissues, filtered water, or sample preservatives can augment traditional sampling methods (e.g., visual enumeration from samples or flow-through systems) to provide enhanced spatial, temporal, or taxonomic resolution, especially for microscopic species that may be important for larval fishes but that cannot be easily sampled with conventional methods (e.g., nets, submersibles) or identified by morphological examination (e.g., cryptic species). The resulting data can be examined using ecological co-occurrence network analysis, which can provide insight into potentially important species interactions for larval fish.
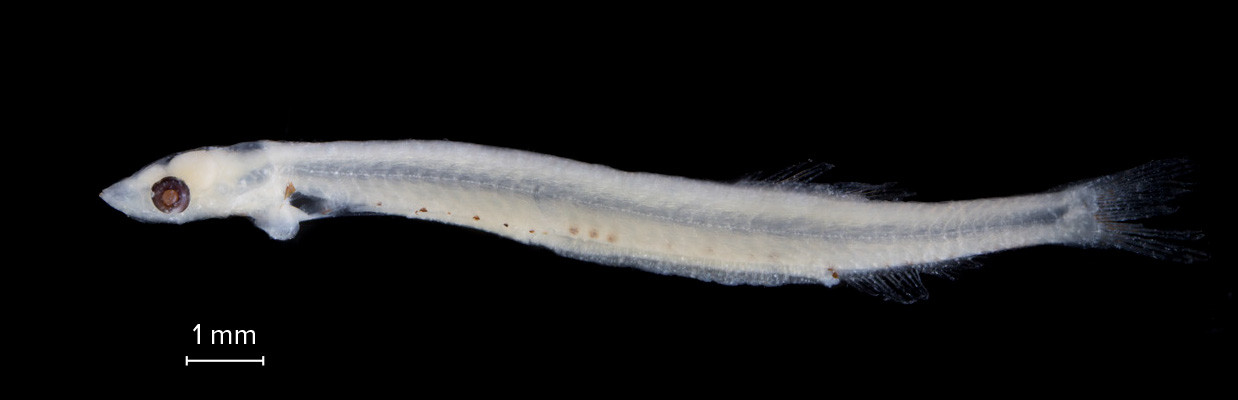
Previous work has characterized the set of physical conditions associated with the critical oceanic habitats for important fisheries as well as individual prey items, but the complex network of ecological associations that define the larval habitat are still largely unexplored (Thompson et al., 2022). Using E. mordax larvae as a case study (Figure 1), the goal of this paper is to examine how eDNA data can be coupled with traditionally sampled larval fish abundance data to develop ecological co-occurrence networks that provide insight into the microscopic world of larvae and work toward elucidating communities, species, and mechanisms that control larval dynamics.
|
|
eDNA in the Southern California Current Ecosystem reveals potentially important ecological interactions for E. mordax.
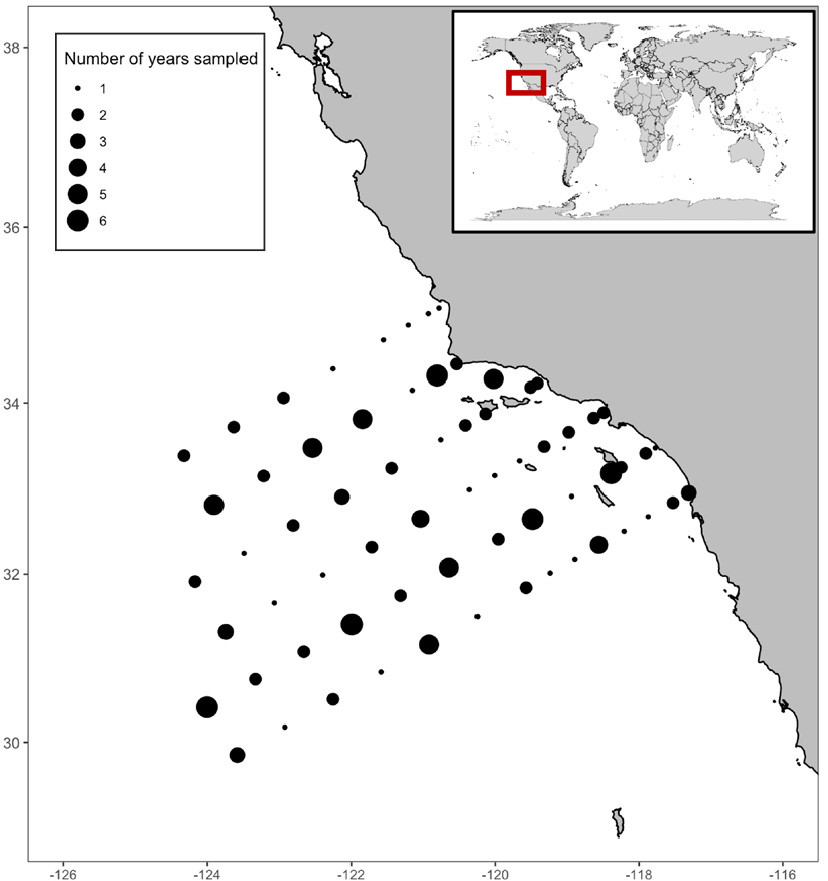
We examine this subject within the Southern California Bight region, which is situated in the southern portion of the CCE, a productive upwelling system that supports important fisheries. In addition, the CCE is home to one of the longest running integrated marine ecosystem monitoring programs in the world, the California Cooperative Oceanic Fisheries Investigations (CalCOFI), which has systematically sampled the physics, chemistry, and biology of the system since 1951.
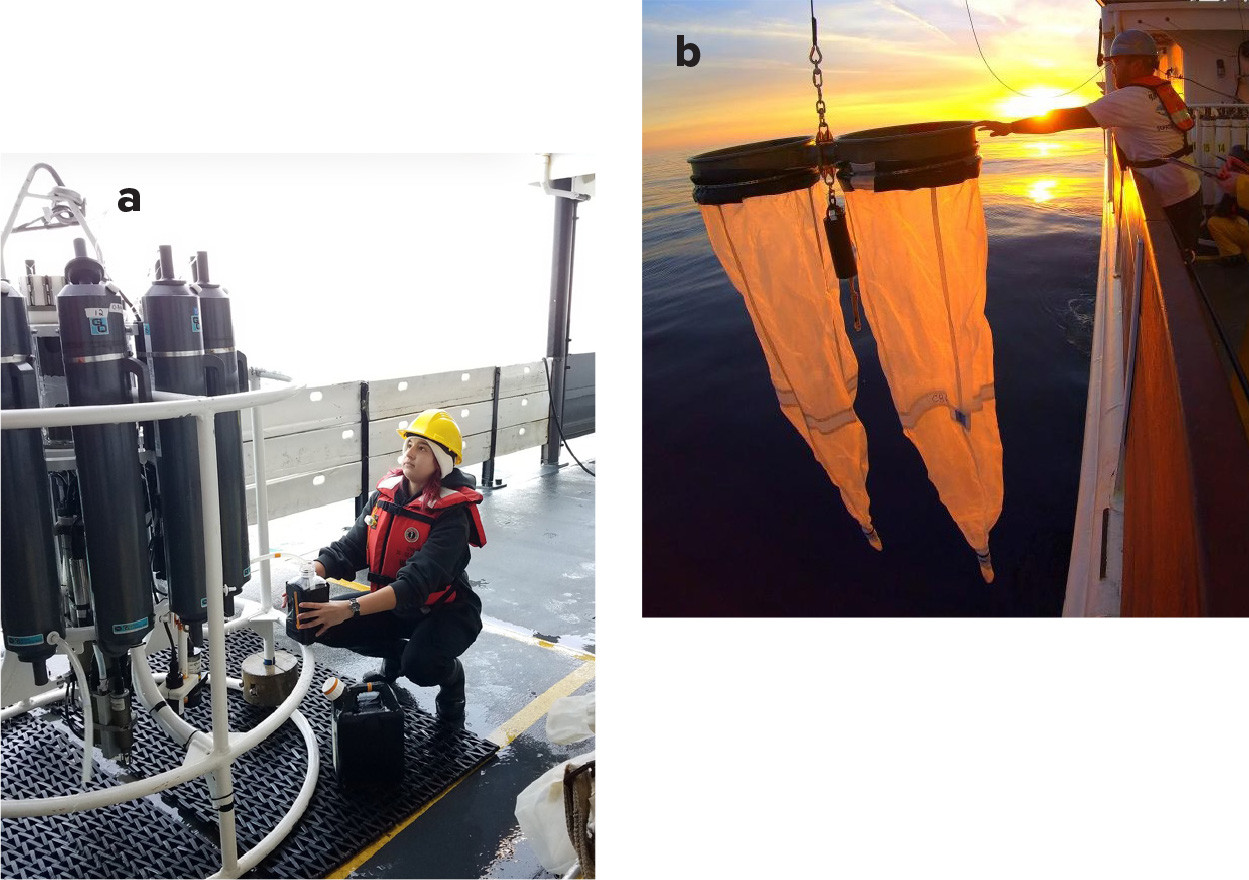
In 2014, the NOAA-CalCOFI Ocean Genomics (NCOG) program began collecting DNA samples to molecularly identify bacterioplankton, phytoplankton, and zooplankton (Figures 2 and 3a). NCOG has sequenced nearly 1,000 DNA samples from two depths (~10 m and the subsurface chlorophyll a maximum) across 2014–2020, enumerating over ~80,000 amplicon sequence variants (ASVs), unique DNA sequences, from 16S and 18S (James et al., 2022). ASVs from the domains Bacteria, Archaea, and Eukarya were taxonomically annotated with the SILVA and PR2 databases. Additionally, ichthyoplankton have been visually identified from net tow samples throughout CalCOFI’s history (Figure 3b). These rich data sets provide an avenue for exploring the ecological networks that potentially control the dynamics of the early life stages of marine fishes.
|
|
|
|
Here, we integrated larval fish and eDNA data from the core CalCOFI grid (Figure 2) over seven years (2014–2020) to generate an ecological co-occurrence network using methods adapted from Steinhauser et al. (2008). Ecological co-occurrence network analyses were used because they provide information on potential interactions between taxa in large, complex data sets, which may be more challenging to detect using diversity metrics or other types of multivariate community analyses (Barberán et al., 2012).
We correlated the presence/absence (P/A) of ASVs from biomolecular 16S and 18S data with visually enumerated counts of larval fishes. P/A data (reads > 0) were used for the ASVs because it is challenging to interpret metabarcoding data quantitatively. P/A analyses can provide more accurate estimates of taxon correlations in the absence of robust abundance estimates or when abundance data are uncertain (Mainali et al., 2017), but they can introduce error in cases where there are spurious, low read assignments.
All analyses were conducted using the statistical software R (R Core Team, 2021). Taxa with little to no variance were removed from analyses and positive Pearson’s product moment correlations (ρ >0.237) with strongly significant p-values (Benjamini and Hochberg adjusted p-values < 3.3 × 10⁻⁶) were identified among all remaining taxa. This resulted in a correlation matrix that was then visualized and explored using a network visualization package (igraph; Csardi and Nepusz, 2006). This analysis revealed a complex “hairball” network of correlations that were mined to reveal potential ecological interactions among plankton taxa, including larvae of important fisheries species (Figure 4a).
|
|

Given the complexity of the network, we focused on a sub-network of taxa that had significant positive associations with larval E. mordax abundance. This could be used to characterize the potential ecological habitat of larval anchovies (the “anchovy water”; Alvariño, 1980) and could lend insight into drivers of anchovy recruitment dynamics from 2014 to 2020. The larval anchovy sub-network revealed 45 ASVs that clustered into 24 distinct taxa (Figure 4b). Taxa co-occurrence could be due to direct interactions (e.g., predation, parasitism, mutualism, or commensalism) or to indirect relationships via associations with similar water masses or environmental characteristics. Although co-occurrences do not prove ecological interactions, they identify hypotheses for future testing (Faust, 2021).
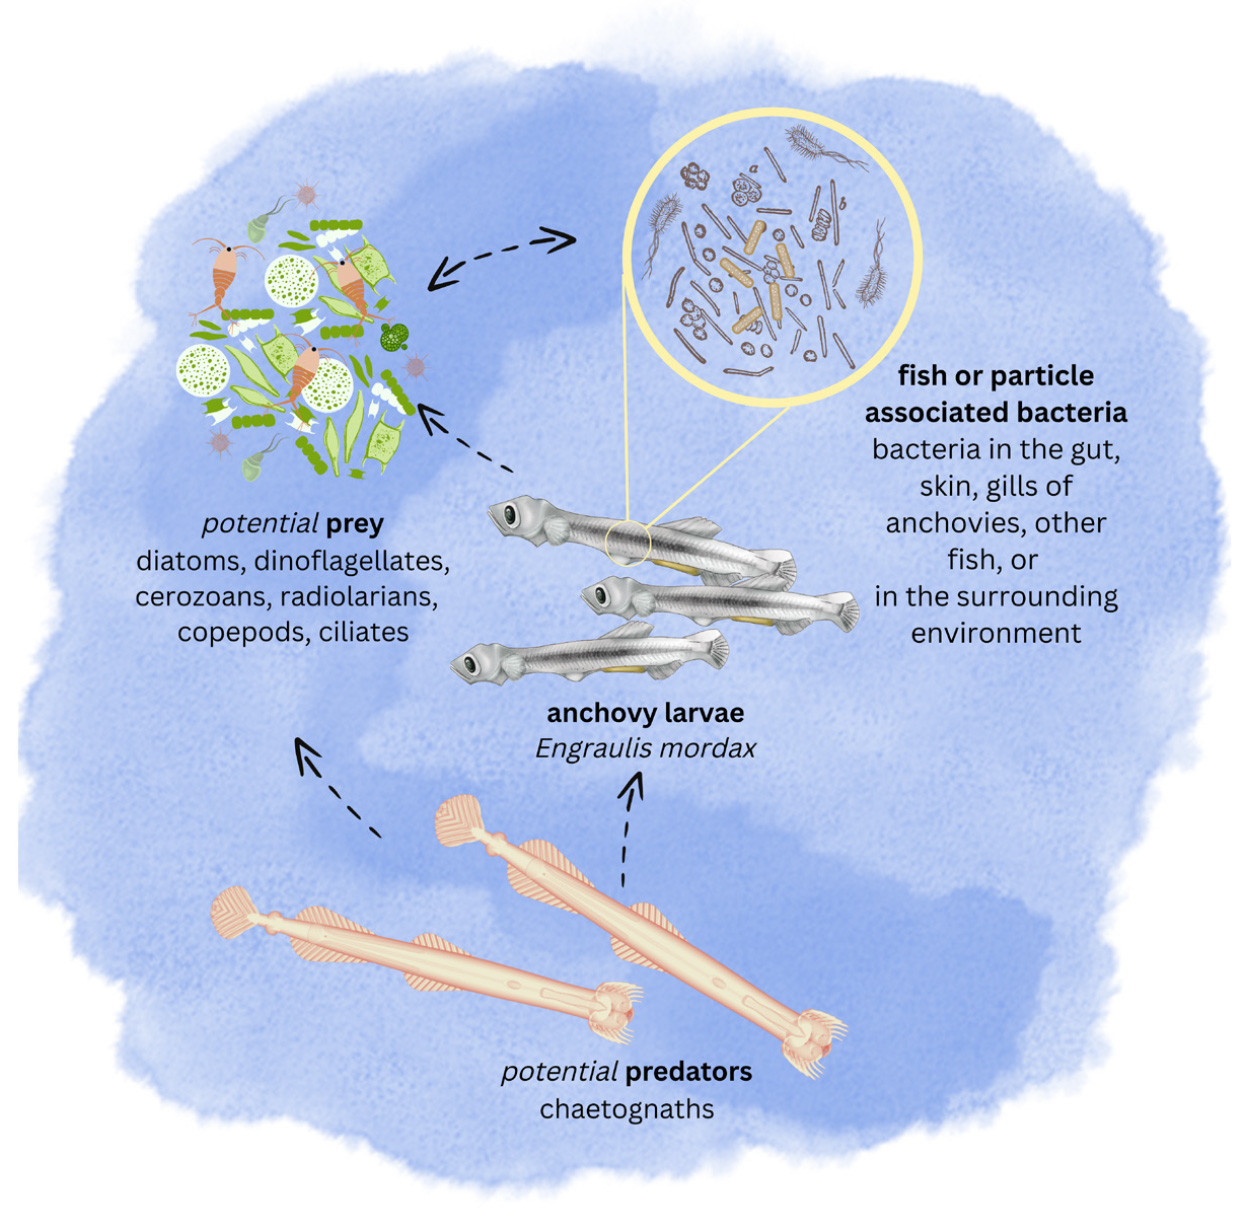
Anchovy water can be characterized by eDNA analysis to reveal potential prey field, predators, and microbiome associates.
This analysis of 18S amplicons revealed a potential prey field for larval anchovy that included ciliates (Pelagostrobilidium neptuni), cercozoans (Cryothecomonas sp., Protocystis thomsoni), radiolarians (Lithomelissa setosa), maxillopods (likely copepods), and phytoplankton that included diatoms (Bacillariophyceae) and dinoflagellates (e.g., Syndiniales and Gyrodinium rubrum). Most of these broader taxa groups have been identified as important food sources for larval anchovies (Arthur, 1976), although Syndiniales is an order of parasitic dinoflagellates, so could be parasitic to either the fish larvae or potential prey. The network analysis identified chaetognaths (Aphragmophora) as potential predators or competitors (Alvarino, 1980). Five 18S ASVs (19%) were classified as eukaryotic with no lower taxonomic classification, four 18S ASVs (15%) were classified only to the level of Archaeplastida, and one 18S ASV (4%) to the level of Metazoa, suggesting that more research is needed to uncover the “dark matter” of larval fish habitats.
Several uncultured bacterial taxa showed co-occurrence with E. mordax larvae in this analysis (Figure 4b). The majority of 16S amplicons (72%) were assigned to the order Flavobacteriales with representatives from Flavobacteriaceae (marine group NS5, Formosa, and Pseudofulvibacter), Cryomorphaceae, and marine groups NS7 and NS9. Rhodobacteraceae, Saprospiraceae, and Oligoflexales were among the other taxonomic assignments. Many of the ASVs represented taxa that have been found in association with fish intestines/feces, gills, or skin (Senhal et al., 2021).
Biomolecular approaches provide insight into the larval habitats of important fisheries species and provide working hypotheses to explore through future research.
Overall, the taxa found here provide candidate indicators to help understand the complex ecosystem of interactions that make up larval anchovy habitat (Figure 5). Co-occurrence networks, from coupled molecular and abundance data, provide tools for identifying the key ecological characteristics of larval fish habitats more extensively, and could be used to identify species interactions that have the potential to influence larval dynamics and perhaps recruitment success. Integrating biomolecular data with traditional survey tools represents an important advancement in applying eDNA analysis for fisheries management by informing the essential mechanisms operating on larval fish and thus on the resulting fisheries.
|
|
Moving forward, observational data are needed to verify important interactions and the taxa involved to better constrain eDNA-based indicators for important fisheries. Specifically, future studies could: (1) validate the results of this study with additional surveys concurrently sampling eDNA and fish, (2) examine the broad suite of planktonic taxa that co-occur with other important individual fisheries species (e.g., sardines, Pacific halibut) or suites of species (e.g., coastal pelagic species), (3) leverage the taxonomic richness of eDNA-based monitoring products in efforts to improve fisheries prediction models (e.g., recruitment forecasting), (4) “fingerprint” quality larval habitats and provide indices of their spatial extents, (5) explore the potential to use broad network metrics in ecosystem-based fisheries management approaches, such as ecosystem status reports and as triggers for decision-making, (6) conduct targeted studies to test the connections found through these types of ecological co-occurrence studies, such as gut contents studies, and (7) develop more detailed reference databases to better resolve ASV taxonomy and inform essential mechanisms.