Oceanography The Official Magazine of
The Oceanography Society
Volume 32 Issue 02

View Issue TOC
Volume 32, No. 2
Pages 142 - 149

OpenAccess

The SPURS-2 Eastern Tropical Pacific Field Campaign Data Collection

By Frederick M. Bingham , Vardis Tsontos, Annette deCharon, Carla Jean Lauter, and Lisa Taylor 
Jump to
Article Abstract Full text Citation References Copyright & Usage
Article Abstract

This paper describes the large, diverse set of in situ data collected during the Salinity Processes in the Upper-ocean Regional Study 2 (SPURS-2) field campaign. The data set includes measurements of the ocean, atmosphere, and fluxes between atmosphere and ocean; measurements of the skin surface layer, bulk mixed layer, and deeper water; (mostly) physical, chemical, and biological measurements; and ship-based, mobile drifting/floating, and moored observations. We include references detailing the methods for collection of each data set, provide DOIs for accessing the data, and note some papers in this special issue that use them. To facilitate broader access to SPURS-2 data and information, we created an online tool that allows users to explore data sets organized by various categories (e.g., instrument type, mobility, depth). This tool will complement content available from the Physical Oceanography Distributed Active Archive Center (PO.DAAC) and will be highly engaging for visual learners.


ABOVE. All photos, except as noted, courtesy of Eric Lindstrom. Abbreviations are defined in Box 1. Middle set of photos, starting at the top left, proceeding clockwise and spiraling inward: (1) SEA-POL radome installed on R/V Revelle for cruise 2. Also visible are the laser for the CFT in front of radome and the radiometer for the ROSR to the right. (2) Janet Sprintall (pointing) and some members of her group watching a display during a CTD cast on Revelle cruise 1. (3) Two yellow Seagliders in the foreground and a neutrally buoyant float in the background before deployment on Revelle cruise 1. (4) Two gray and white PICO moorings on the aft deck of Revelle, one about to be deployed. (5) A radiosonde about to be launched. (6) A front view of the SSP secured on deck. (7) The LA. (8) A Wave Glider being deployed from Revelle. (9) Flotation for the central mooring being prepared for deployment on the aft deck of Revelle. (10) A nighttime view of some of the meteorological instrumentation on the bow of Revelle (photo courtesy of Julian Schanze). (11) The central mooring. > High res figure
Full Text

Introduction

The Salinity Processes in the Upper-ocean Regional Study 2 (SPURS-2) field campaign was an international, multi-investigator project that took place in the eastern tropical Pacific Ocean during 2016–2017 (Figure 1a). It was designed as a complement and follow-on to SPURS-1, which was conducted in the subtropical North Atlantic in 2012–2013. Results from SPURS-1 can be found in the March 2015 issue of Oceanography (Lindstrom et al., 2015). The purpose of SPURS-2 was to study the dynamics of the rainfall-​dominated surface ocean at the western edge of the Eastern Pacific Fresh Pool (Alory et al., 2012), a region characterized by high seasonal variability (Fiedler and Talley, 2006; Guimbard et al., 2017) and subject to strong zonal flows associated with the North Equatorial Current and Counter Current (Kessler, 2006). The campaign sought to address the questions: How does the ocean integrate the freshwater forcing and destroy variance created at the surface? What are the local and non-local effects of freshwater flux on the ocean? More detailed information about SPURS-2 can be found in SPURS-2 Planning Group (2015), Lindstrom et al. (2017), and in articles in this special issue of Oceanography.


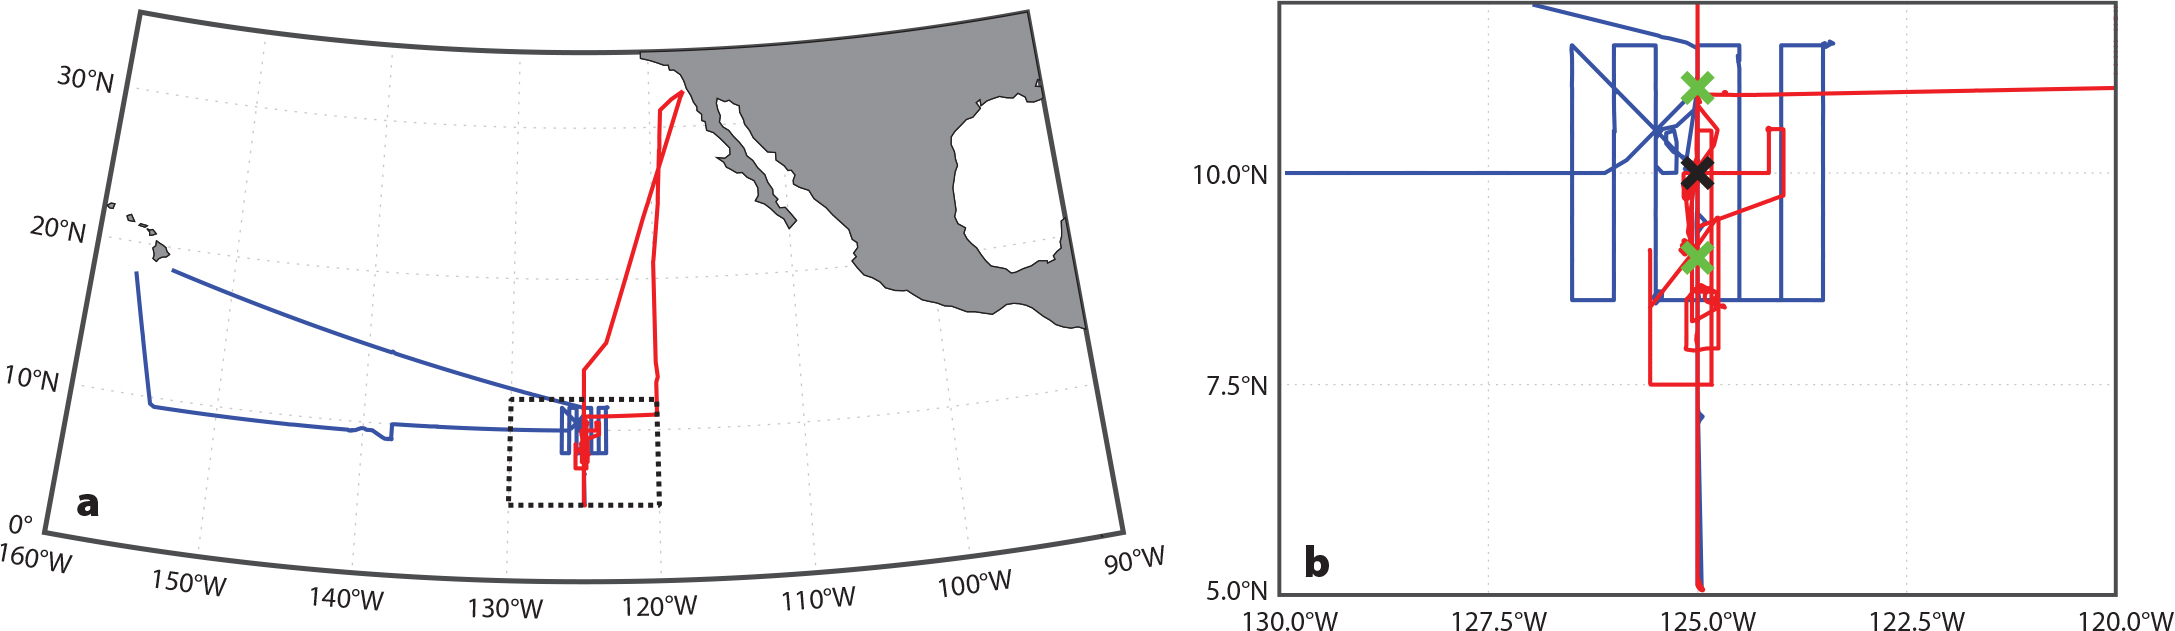
Figure 1. Tracks of R/V Revelle for cruise 1 (blue) and cruise 2 (red). See Table 1 for cruise dates. Boundaries for panel b are shown in panel a by a dotted line. The black “X” marker in panel b is the nominal location of the central mooring (Table 2, #s 27–30) and green “X”s are the locations of the north and south PICO (Platform Instrumentation for Continuous Observations) moorings (Table 2, #s 23–26). > High res figure


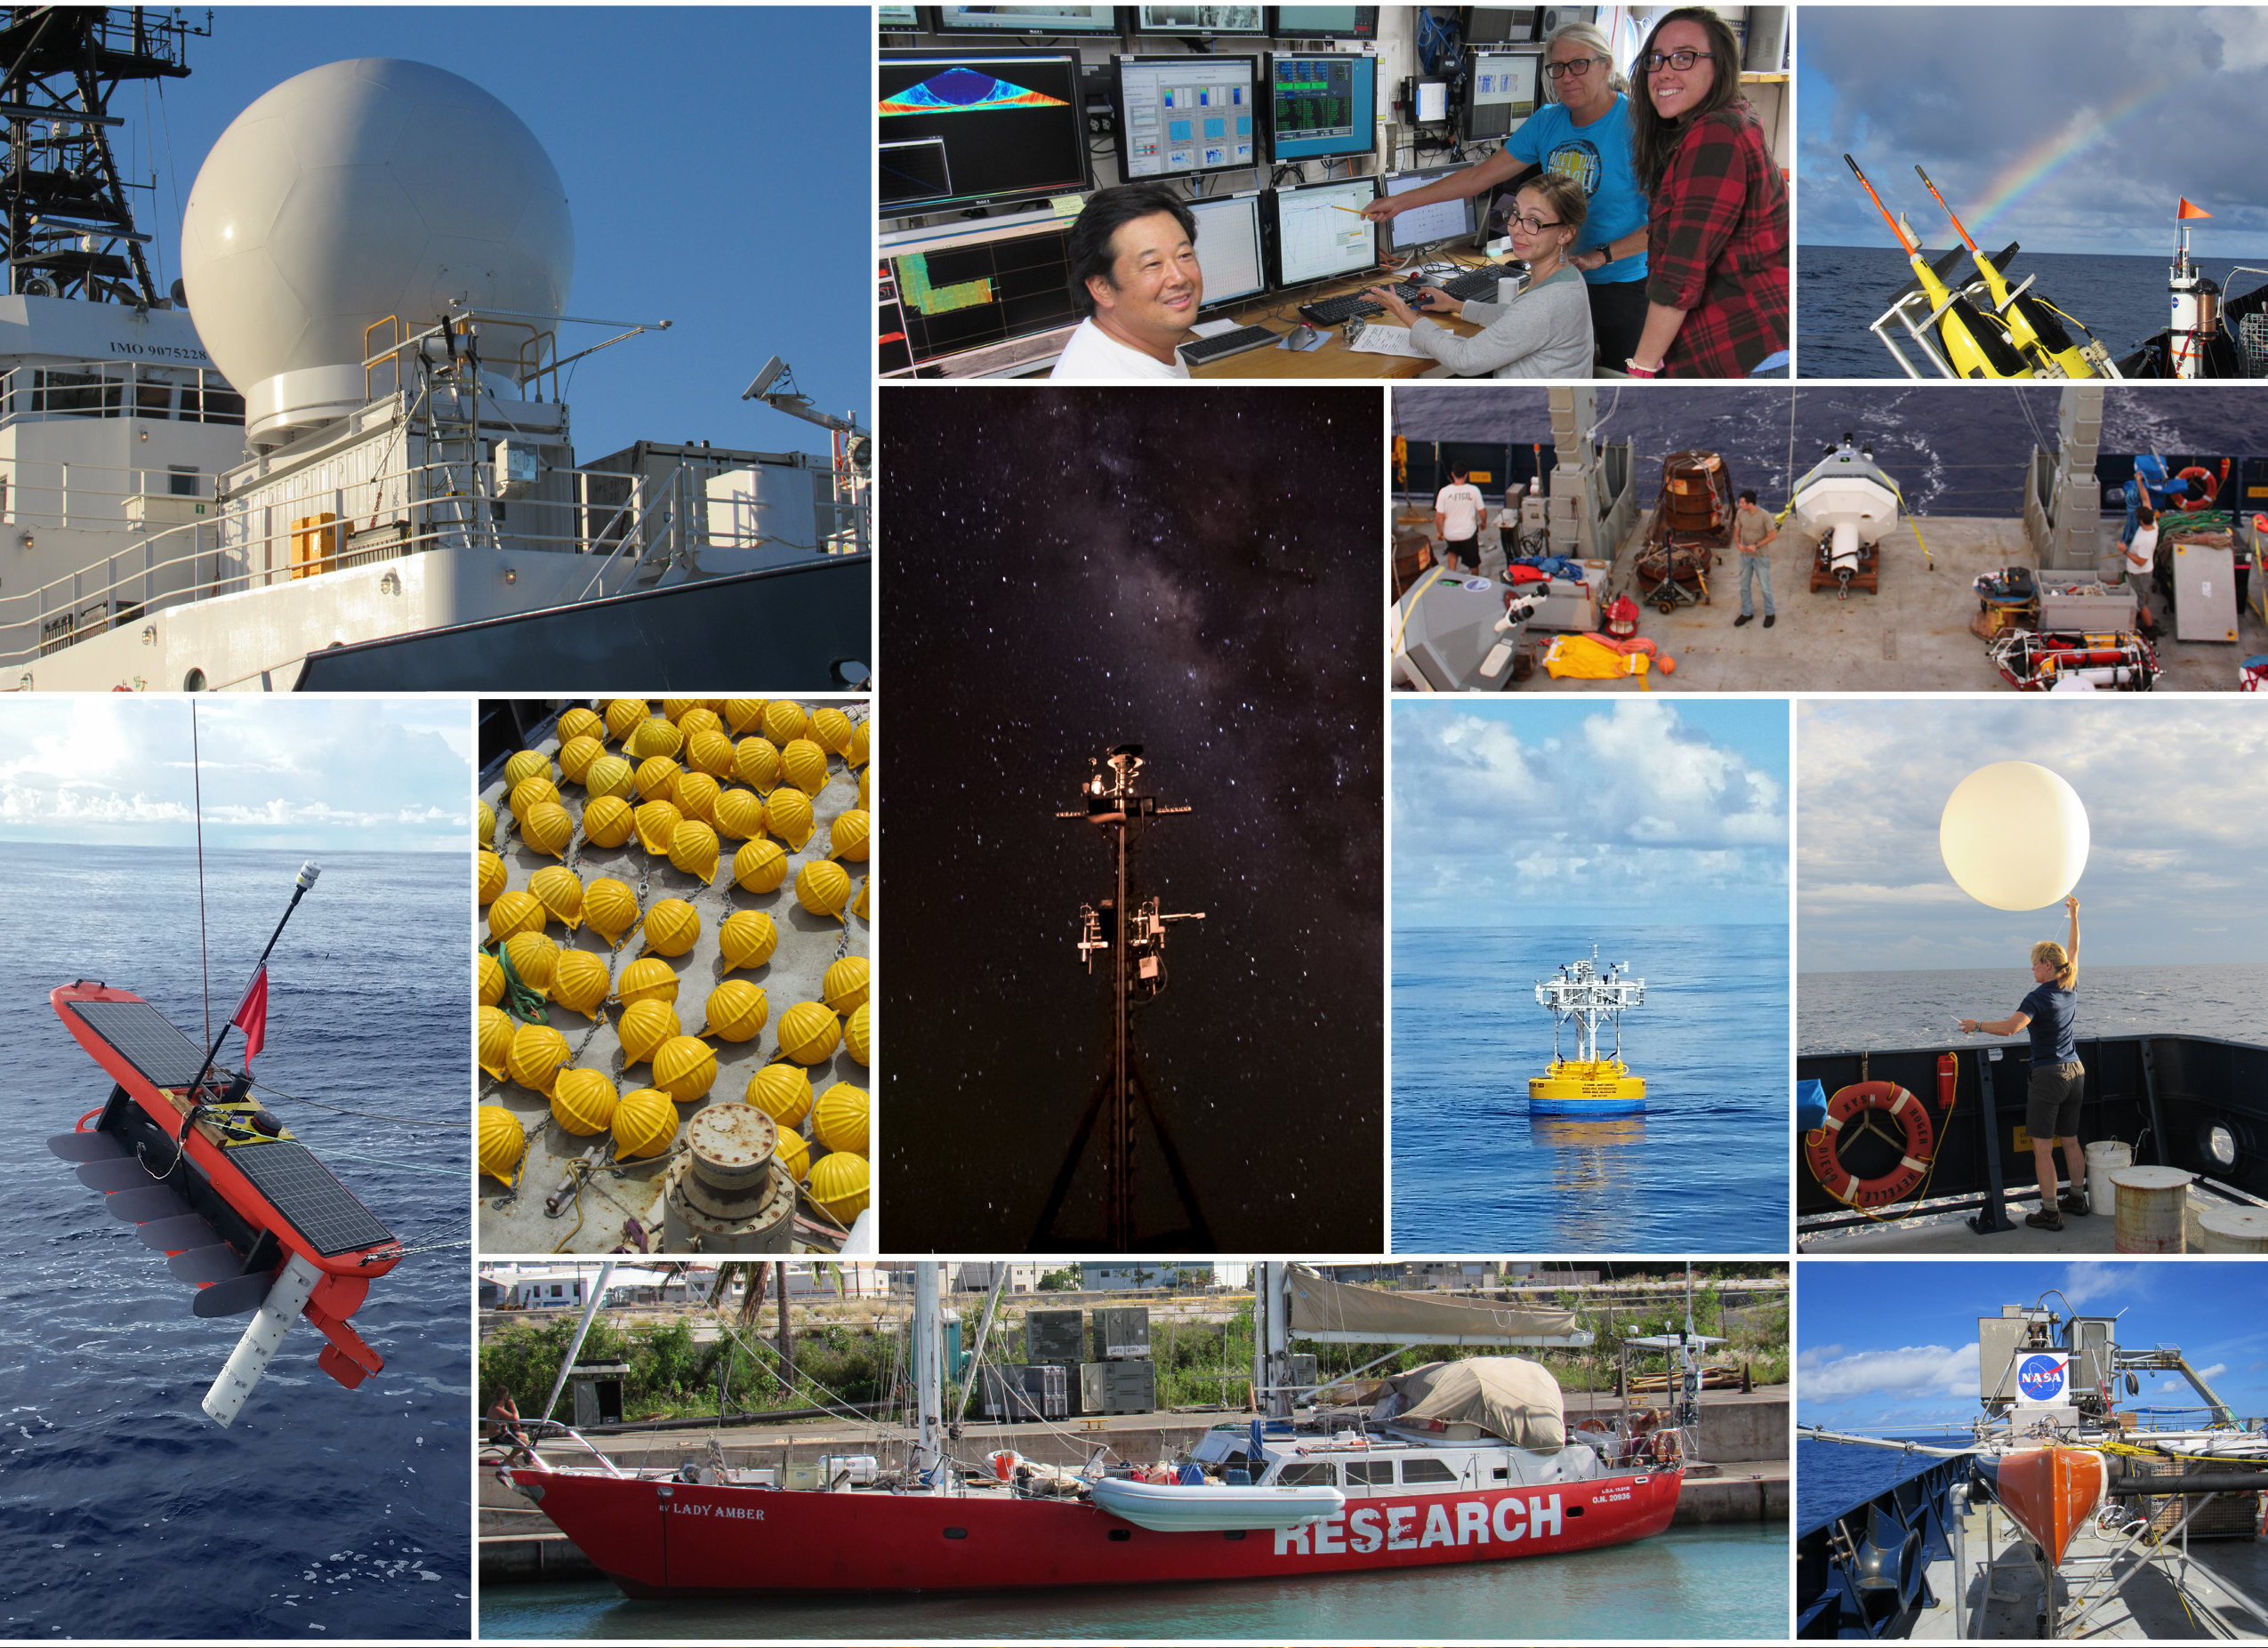
The SPURS-2 field campaign consisted of a large variety of autonomous, drifting, ship-based, and moored in situ instrumentation. Some of the instruments were standard (e.g., CTDs) and others very unusual or innovative (e.g., SEA-POL radar and saildrones). The activity was centered at a main mooring located near 10°N, 125°W, and two other moorings were deployed to the north and south (Figure 1b).

Two ships visited the SPURS-2 site, R/V Roger Revelle (Table 1) operated by Scripps Institution of Oceanography, and the schooner Lady Amber. There were two cruises on Revelle in August–September 2016 and October–November 2017 (Table 1 and Figure 1a,b).


Table 1. Information about R/V Revelle cruises. > High res table


Lady Amber is a 20 m long twin-masted schooner, outfitted with a thermosalinograph and meteorological instrumentation (Rainville et al., 2019, in this issue). It represents a proof-of-concept for the NASA Physical Oceanography Program’s exploration of new avenues for conducting oceanographic research in an environment constrained by cost and high demand for major research vessel time. Perhaps it could be considered a throwback to an earlier era of oceanographic research. Lady Amber visited the SPURS-2 site several times during the yearlong field campaign, (see Rainville et al., 2019, in this issue), whereas Revelle was only able to visit the site at the beginning and end. Lady Amber was used for light deployment and recovery of instrument platforms as well as coordinated scientific activities with the larger and more mobile and capable Revelle.

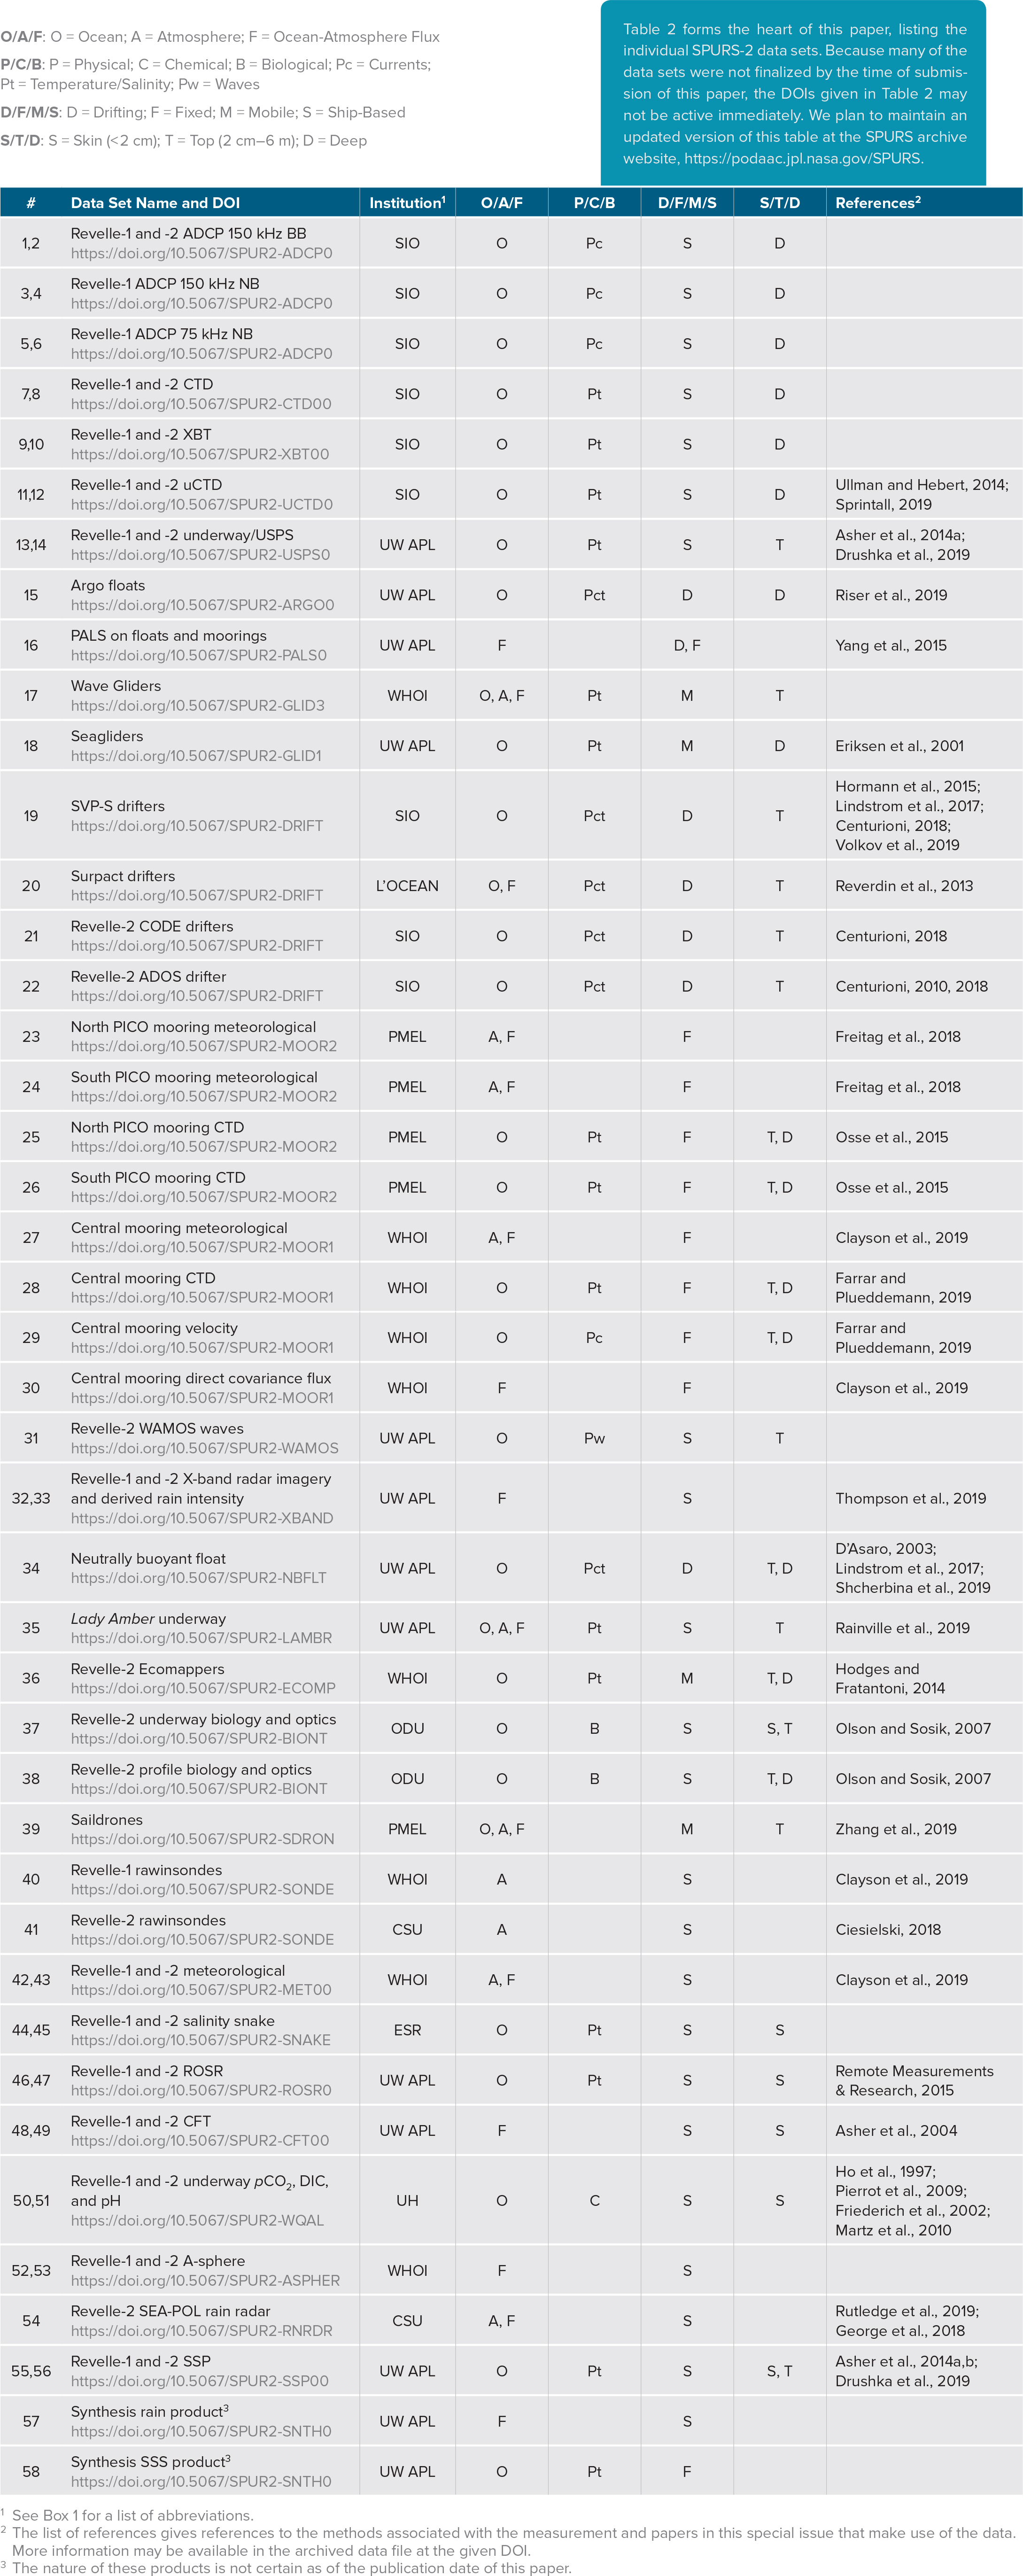
The SPURS-2 field campaign was extensive in its scope, innovative in its approach, diverse in its participation, and heterogeneous in its methods. The purpose of this paper is to give an overview of the various component data sets that were collected during the program. Many of these data sets are described more fully elsewhere, but it is useful to put all of this information into one place to emphasize the degree of unity and coordination that went into the field program. In addition, we gathered all of the data set DOIs into one table (Table 2) to allow readers access to the full suite of data. Lastly, we describe an interactive online tool that is designed to actively explore the relationships among SPURS-2 data sets. This tool also includes links to additional contextual information such as posts from the cruise blog.


Table 2. Information about individual SPURS-2 data sets. “Revelle-1”/”Revelle-2” refers to data sets associated with the first/second R/V Revelle cruise (Table 1).  > High res table


Data Elements

The full list of SPURS-2 data sets (Table 2) shows the collection’s heterogeneity. SPURS-2 was unique in the use of innovative sensors and platforms coordinated with more traditional ones. The innovative sensors and platforms included saildrones (Zhang et al., 2019, in this issue), Lady Amber (Rainville et al., 2019, in this issue), the salinity snake, the surface salinity profiler (Drushka et al., 2019, in this issue), and the SEA-POL radar (Rutledge et al., 2019, in this issue), plus a dedicated regional modeling system (Li et al., 2019, in this issue). The tropical Pacific, particularly in this region, is a difficult place to sample. Currents are strong and highly variable, both on seasonal and shorter timescales (Guimbard et al., 2017; Melnichenko et al., 2019, in this issue). This fact renders traditional Lagrangian methods less effective, as drifters placed into the region have very short residence times. The Lagrangian frame experiment, making use of Seagliders and Wave Gliders to follow the motion of a neutrally buoyant float (Shcherbina et al., 2019, in this issue), was set up to finesse this issue. Heavy rainfall, the principal reason for conducting SPURS-2 in this region, is patchy and difficult to sample, necessitating the use of sophisticated rain radar (Rutledge et al., 2019, in this issue). Surface-intensified fresh­water lenses are the principal mechanism by which this heavy rainfall gets incorporated into the bulk mixed layer and spread across the Pacific basin (SPURS-2 Planning Group, 2015). These layers, generally not more than a couple of meters thick and transient, last on the of order hours or less and are small in horizontal scale, no more than a few kilometers (Drushka et al., 2019, and Schanze et al., 2019, both in this issue). This motivated the use of rain radar, along with high vertical resolution sampling of surface layers in the wakes of rain events. These observations could then be related back to satellite measurements of sea surface salinity (SSS) made by Soil Moisture and Ocean Salinity (SMOS) and Soil Moisture Active Passive (SMAP) satellites (Supply et al., 2018). This gives us an improved understanding of the surface signature being resolved by these satellite missions and provides a better sense of what satellite data can tell us about this and other similar rainfall-​dominated regions.

Scientists wishing to use the data collected during SPURS-2 are urged, if possible, to cite directly the individual data sets they use (e.g., Drushka, 2018). This issue is undergoing a spirited debate in the world of science publishing (http://www.copdess.org/enabling-fair-data-project/enabling-fair-project-overview/). We believe that in the future data sets will be acknowledged by such citations. If a particular journal does not allow this kind of data set citation, those using these data should endeavor to find and cite the most appropriate reference. Table 2 gives a place to start that search.

For the sake of organization, the elements of Table 2 are divided loosely into categories as to how deep they measure; whether they are drifting, fixed (moored), mobile, or ship-based; and whether they are physical, chemical, or biological. Several papers in this special issue of Oceanography have made extensive use of these data as can be seen in the References column.


Data Set Exploration Tool

The information in Table 2 has also been organized into an ontology, which is a collection of encoded terms and relationships used in computer sciences (Antoniou and van Harmelen, 2004). Ontologies can be visualized to illustrate complex conceptual relationships, for example, between oceanographic instruments, data types, and underlying scientific concepts (deCharon et al., 2015). Information about SPURS-2 data sets has been categorized into a set of terms. Relationships between these terms have been mapped using five mathematical symbols (>, <, =, ~, ≈). In turn, the meaning of each symbol has been translated to phrases. These terms and their relationships are visualized via a customized data exploration tool developed for SPURS-2 that can be accessed at https://salinity.​oceansciences.org/​science-​spurs-​datatool.htm.

Within this online tool, the ontology is viewed as interactive objects whose relationships are depicted as labeled arrows (Figure 2). As a result, the tool has flexible starting points and no “dead ends,” enabling self-directed exploration of the SPURS-2 data collection. Figure 3 shows an expanded view of the term “surface salinity profiler,” as presented by the data exploration tool. This visualization allows users to quickly grasp how this particular instrument fits into the bigger picture of the SPURS-2 campaign. In the live tool, clicking on any of the peripheral terms will re-center and update the display; for example, “Ship-Based” would be encircled by all the data sets marked as “S” in the sixth column of Table 2.


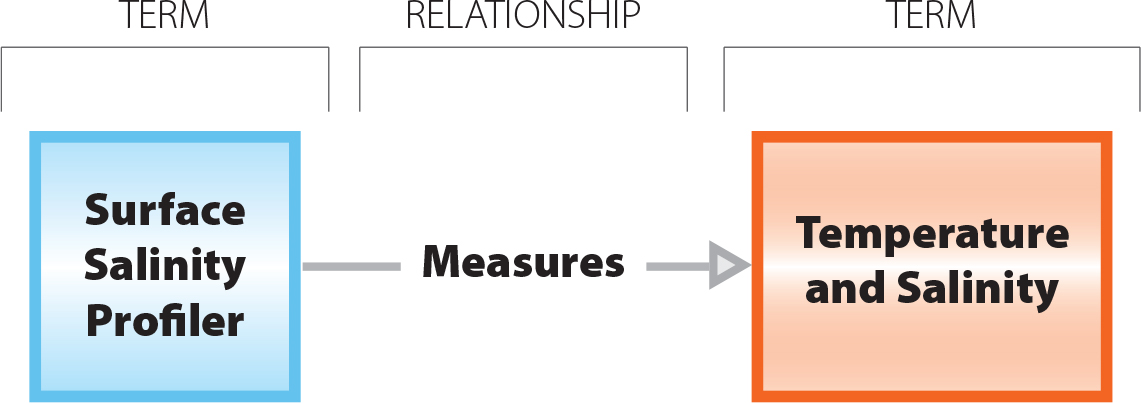
Figure 2. An example of a link between terms in the SPURS-2 ontology. When viewed in the data exploration tool, the relationship between terms is described by a linking phrase (“measures”). > High res figure


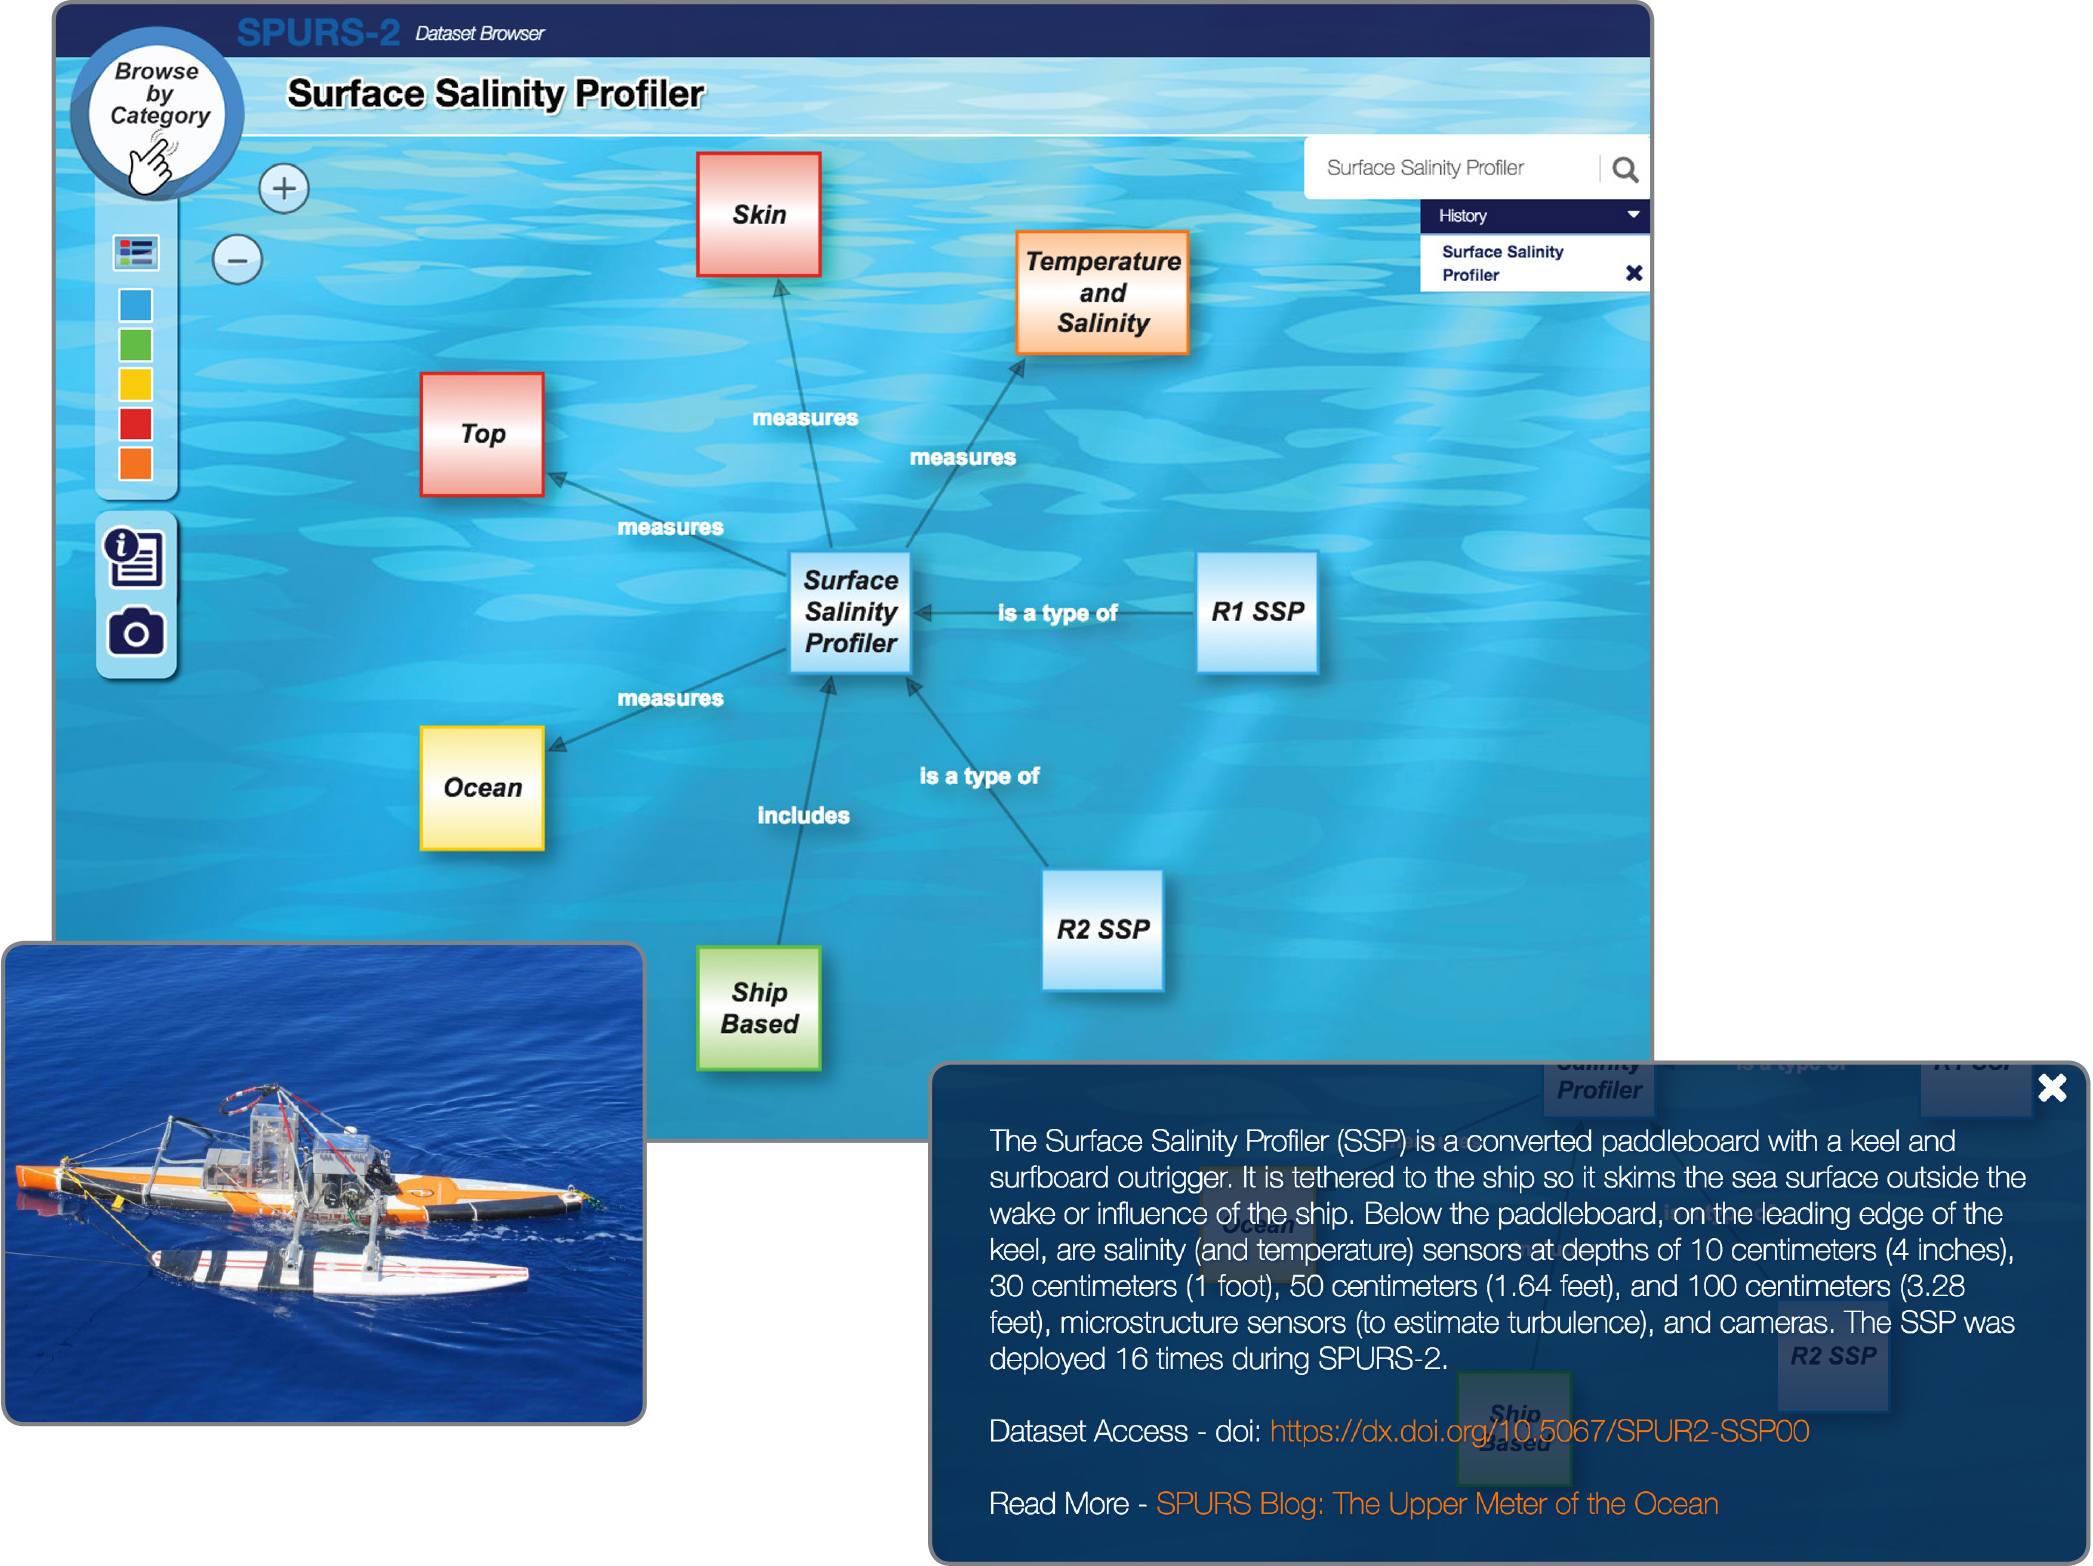
Figure 3. An expanded view of the visualized ontology based on a user click of the term “Surface Salinity Profiler.” Properties measured by the central term (e.g., “Top,” “Skin,” “Ocean,”) are placed at the ends of arrows. Conversely, arrows associated with broader categories (“Ship-Based”) lead to the central term. An image (lower left), a description of a data set, and a blog post link (lower right) provide context to enhance the user’s understanding. > High res figure


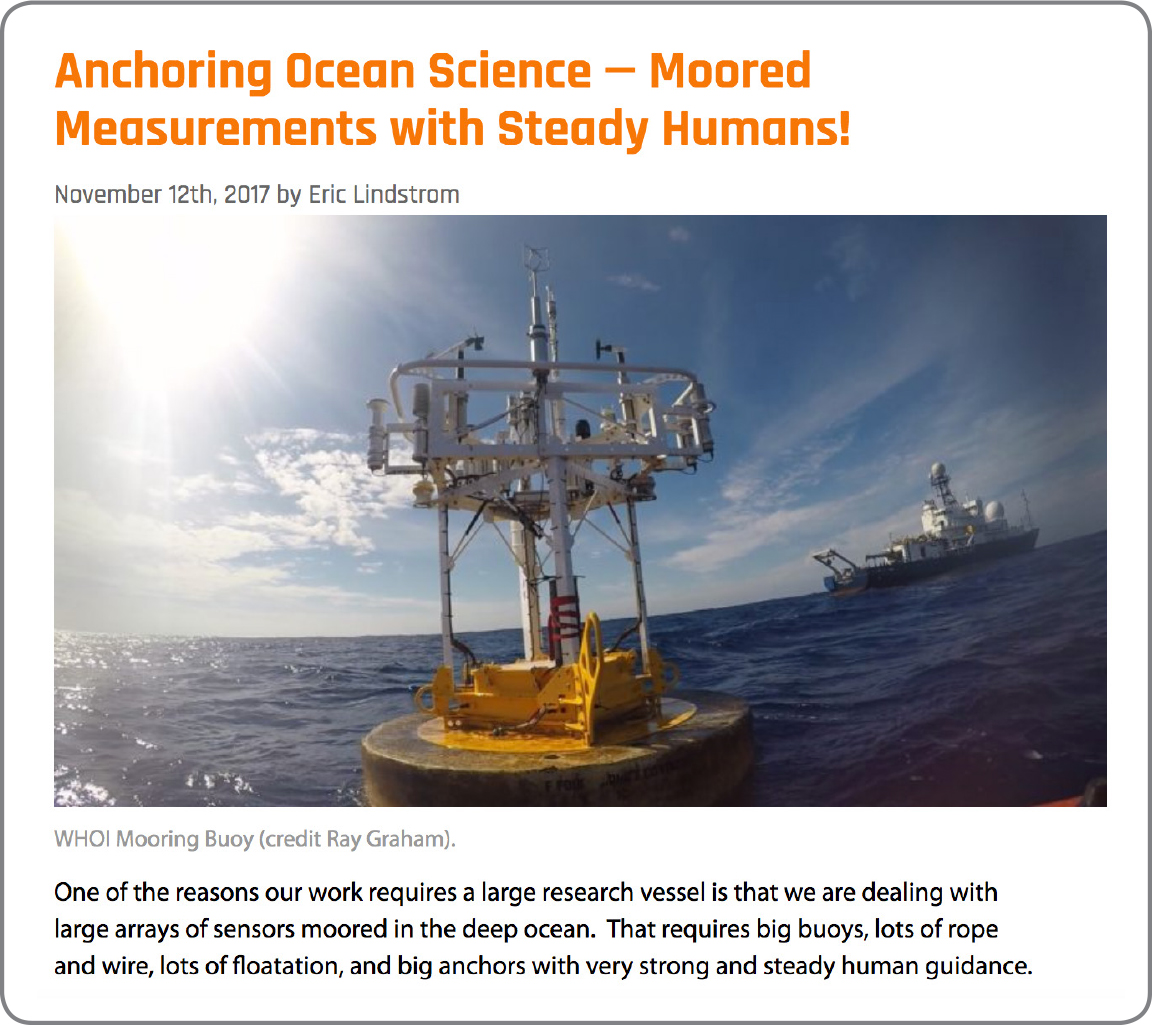
The data exploration tool also connects to additional SPURS-2 content, including data sources and detailed descriptions of instruments. This technical information is augmented by links to pertinent content on the SPURS-2 blog, hosted by the NASA Earth Observatory (Figure 4). Informative and entertaining, this extensive blog captures not only the stories behind SPURS-2 data acquisition but also provides insights into the individuals, teams, and skills needed to investigate salinity-related processes at the ocean surface.


Figure 4. The data exploration tool links to many posts in the SPURS-2 blog, maintained by the NASA Earth Observatory (http://earthobservatory.nasa.gov/blogs/fromthefield/category/spurs/). This example post focuses on the central mooring from the Woods Hole Oceanographic Institution. > High res figure


Archiving and Distribution

Efforts are ongoing among SPURS-2 PIs to complete the production of finalized data sets. Once these data sets are produced, they will be packaged with appropriate metadata and placed into a permanent archive at PO.DAAC at the Jet Propulsion Laboratory. The available files will be in netCDF format and CF-compliant consistent with the NOAA National Centers for Environmental Information in situ standard templates (https://www.nodc.noaa.gov/data/formats/netcdf/v2.0/). The URL for SPURS-1 and -2 at PO.DAAC is https://podaac.jpl.nasa.gov/SPURS. In addition to the data that are searchable and accessible via a range of tools and services, there is a list of available SPURS-related publications, reports, and artifacts for these field campaigns.


BOX 1. Abbreviations


INSTITUTIONS
CSU – Colorado State University
ESR – Earth and Space Research
L’OCEAN – Laboratoire d’Océanographie et du Climat: Expérimentation et Approches Numériques
ODU – Old Dominion University
PMEL – NOAA Pacific Marine Environmental Laboratory
SIO – Scripps Institution of Oceanography, University of California San Diego
UH – University of Hawaii
UW APL – University of Washington Applied Physics Laboratory
WHOI – Woods Hole Oceanographic Institution
 
OTHER
ADCP – Acoustic Doppler Current Profiler
ADOS – Autonomous Drifting Ocean Station
BB – Broadband
CFT – Controlled Flux Technique
CODE – Coastal Ocean Dynamics Experiment
DOI – Digital Object Identifier
LA – Schooner Lady Amber
NB – Narrowband
NCEI – NOAA National Centers for Environmental Information
PALS – Passive Acoustic Listening System
PICO – Platform Instrumentation for Continuous Observations
PO.DAAC – Physical Oceanography Distributed Active Archive Center
ROSR – Remote Ocean Surface Radiometer
SEA-POL – SEAgoing–POLarimetric
SMOS – Soil Moisture and Ocean Salinity Satellite
SMAP – Soil Moisture Active Passive Satellite
SPURS – Salinity Processes in the Upper-ocean Regional Study
SSP – Surface Salinity Profiler
SSS – Sea Surface Salinity
SVP-S – Surface Velocity Program–Salinity
uCTD – underway CTD
URL – Uniform Resource Locator
USPS – Underway Salinity Profiling System
Citation

Bingham, F.M., V. Tsontos, A. deCharon, C.J. Lauter, and L. Taylor. 2019. The SPURS-2 eastern tropical Pacific field campaign data collection. Oceanography 32(2):142–149, https://doi.org/10.5670/oceanog.2019.222.

References

Alory, G., C. Maes, T. Delcroix, N. Reul, and S. Illig. 2012. Seasonal dynamics of sea surface salinity off Panama: The far Eastern Pacific Fresh Pool. Journal of Geophysical Research 117, C04028, https://doi.org/10.1029/2011JC007802.

Antoniou, G., and F. van Harmelen. 2004. A Semantic Web Primer. MIT Press, Cambridge, MA, 272 pp.

Asher, W.E., A.T. Jessup, and M.A. Atmane. 2004. Oceanic application of the active controlled flux technique for measuring air-sea transfer velocities of heat and gases, Journal of Geophysical Research 109, C08S12, https://doi.org/​10.1029/​2003JC001862.

Asher, W.E., A.T. Jessup, R. Branch, and D. Clark. 2014a. Observations of rain-induced near-​surface salinity anomalies. Journal of Geophysical Research 119:5,483–5,500, https://doi.org/​10.1002/​2014JC009954.

Asher, W.E., A.T. Jessup, and D. Clark. 2014b. Stable near-surface ocean salinity stratifications due to evaporation observed during STRASSE. Journal of Geophysical Research 119:3,219–3,233, https://doi.org/​10.1002/2014JC009808.

Centurioni, L.R. 2010. Observations of large-​amplitude nonlinear internal waves from a drifting array: Instruments and methods. Journal of Atmospheric and Oceanic Technology 27:1,711–1,731, https://doi.org/​10.1175/​2010JTECHO774.1.

Centurioni, L.R. 2018. Drifter technology and impacts for sea surface temperature, sea-level pressure, and ocean circulation studies. Pp. 37–58 in Observing the Oceans in Real Time. R. Venkatesan, A. Tandon, E. D’Asaro, and M.A. Atmanand, eds, Springer Oceanography, Springer International Publishing AG, Cham, Switzerland, https://doi.org/​10.1007/978-3-319-66493-4_3.

Ciesielski, P. 2018. Quality-Control of Upper-Air Soundings for SPURS-2. Report for the Department of Atmospheric Science, Colorado State University, Fort Collins, CO, 8 pp.

Clayson, C.A., J.B. Edson, A. Paget, R. Graham, and B. Greenwood. 2019. The effects of rainfall on the atmosphere and the ocean during SPURS-2. Oceanography 32(2):86–97, https://doi.org/​10.5670/oceanog.2019.216.

D’Asaro, E.A. 2003. Performance of autonomous Lagrangian floats. Journal of Atmospheric and Oceanic Technology 20(6):896–911, https://doi.org/10.1175/1520-0426(2003)020​<0896:POALF>2.0.CO;2.

deCharon, A., L. Smith, and C. Companion. 2015. Characterizing complex marine systems and technology using visualized vocabularies. Marine Technology Society Journal 49(4):53–63.

Drushka, K. 2018. SPURS-2 research vessel along track WAMOS wave radar data for the second R/V Revelle cruise in the E. Tropical Pacific, https://doi.org/10.5067/SPUR2-WAMOS.

Drushka, K., W.E. Asher, A.T. Jessup, E.J. Thompson, S. Iyer, and D. Clark. 2019. Capturing fresh layers with the surface salinity profiler. Oceanography 32(2):76–85, https://doi.org/​10.5670/oceanog.2019.215.

Eriksen, C., T. Osse, R. Light, T. Wen, T. Lehman, P. Sabin, J. Ballard, and A. Chiodi. 2001. Seaglider: A long-range autonomous underwater vehicle for oceanographic research. IEEE Journal of Oceanic Engineering 26(4):424–436, https://doi.org/​10.1109/​48.972073.

Farrar, J.T., and A.J. Plueddemann. 2019. On the factors driving upper-ocean salinity variability at the western edge of the Eastern Pacific Fresh Pool. Oceanography 32(2):30–39, https://doi.org/​10.5670/oceanog.2019.209.

Fiedler, P.C., and L.D. Talley. 2006. Hydrography of the eastern tropical Pacific: A review. Progress in Oceanography 69(2):143–180, https://doi.org/​10.1016/j.pocean.2006.03.008.

Freitag, H.P., M.J. McPhaden, and K.J. Connell. 2018. Comparison of ATLAS and T-FLEX Mooring Data. NOAA Technical Memorandum OAR PMEL-149, 68 pp., https://doi.org/10.25923/h4vn-a328.

Friederich, G.E., P.M. Walz, M.G. Burczynski, and F.P. Chavez. 2002. Inorganic carbon in the central California upwelling system during the 1997–1999 El Niño–La Niña event. Progress in Oceanography 54(1):185–203, https://doi.org/​10.1016/​S0079-6611(02)00049-6.

George, J., V. Chandrasekar, F. Junyent, S.A. Rutledge, A. Morin, R. Bowie, and P. Kennedy. 2018. Salient features of the CSU sea-pol radar. Pp. 1,307–1,310 in IEEE Radar Conference (RadarConf18), April 23–27, 2018, Oklahoma City, OK, https://doi.org/10.1109/RADAR.2018.8378752.

Guimbard, S., N. Reul, B. Chapron, M. Umbert, and C. Maes. 2017. Seasonal and interannual variability of the Eastern Tropical Pacific Fresh Pool. Journal of Geophysical Research 122(3):1,749–1,771, https://doi.org/​10.1002/2016JC012130.

Ho, D.T., R. Wanninkhof, J. Masters, R.A. Feely, and C.E. Cosca. 1997. Measurement of underway fCO2 in the Eastern Equatorial Pacific on NOAA Ships Malcolm Baldridge and Discoverer from February to September, 1994. NOAA data report ERL AOML-30, Miami, FL, 52 pp.

Hodges, B., and D. Fratantoni. 2014. AUV observations of the diurnal surface layer in the North Atlantic Salinity Maximum. Journal of Physical Oceanography 44:1,595–1,604, https://doi.org/​10.1175/JPO-D-13-0140.1.

Hormann, V., L.R. Centurioni, and G. Reverdin. 2015. Evaluation of drifter salinities in the subtropical North Atlantic. Journal of Atmospheric and Oceanic Technology 32:185–192, https://doi.org/​10.1175/JTECH-D-14-00179.1.

Kessler, W.S. 2006. The circulation of the eastern tropical Pacific: A review. Progress in Oceanography 69(2–4):181–217, https://doi.org/​10.1016/j.pocean.2006.03.009.

Li, Z., F.M. Bingham, and P.P. Li. 2019. Multiscale simulation, data assimilation, and forecasting in support of the SPURS-2 field campaign. Oceanography 32(2):134–141, https://doi.org/​10.5670/oceanog.2019.221.

Lindstrom, E., F. Bryan, and R. Schmitt. 2015. SPURS: Salinity Processes in the Upper-ocean Regional Study—The North Atlantic Experiment. Oceanography 28(1):14–19, https://doi.org/10.5670/oceanog.2015.01.

Lindstrom, E.J., A.Y. Shcherbina, L. Rainville, J.T. Farrar, L.R. Centurioni, S. Dong, E.A. D’Asaro, C. Eriksen, D.M. Fratantoni, B.A. Hodges, and others. 2017. Autonomous multi-platform observations during the Salinity Processes in the Upper-ocean Regional Study. Oceanography 30(2):38–48, https://doi.org/​10.5670/oceanog.2017.218.

Martz, T.R., J.G. Connery, and K. S. Johnson. 2010. Testing the Honeywell Durafet® for seawater pH applications. Limnology and Oceanography: Methods 8:172–184, https://doi.org/10.4319/Lom.2010.8.172.

Melnichenko, O., P. Hacker, F.M. Bingham, and T. Lee. 2019. Patterns of SSS variability in the eastern tropical Pacific: Intraseasonal to interannual timescales from seven years of NASA satellite data. Oceanography 32(2):20–29, https://doi.org/​10.5670/oceanog.2019.208.

Olson, R.J., and H.M. Sosik. 2007. A submersible imaging-in-flow instrument to analyze nano- and microplankton: Imaging FlowCytobot. Limnology and Oceanography: Methods 5(6):195–203, https://doi.org/10.4319/lom.2007.5.195.

Osse, J., S. Stalin, C. Meinig, and H. Milburn. 2015. The PRAWLER, a vertical profiler: Powered by wave energy. Abstract published in Oceans 2015 MTS/IEEE. Marine Technology Society and Institute of Electrical and Electronic Engineers, October 19–22, 2015, Washington, DC, https://doi.org/10.23919/OCEANS.2015.7404354.

Pierrot, D., C. Neill, K. Sullivan, R. Castle, R. Wanninkhof, H. Luger, T. Johannessen, A. Olsen, R.A. Feely, and C.E. Cosca. 2009. Recommendations for autonomous underway pCO2 measuring systems and data-reduction routines. Deep Sea Research Part II 56:512–522, https://doi.org/10.1016/j.dsr2.2008.12.005.

Rainville, L., L.R. Centurioni, W.E. Asher, C.A. Clayson, K. Drushka, J.B. Edson, B.A. Hodges, V. Hormann, J.T. Farrar, J.J. Schanze, and A.Y. Shcherbina. 2019. Novel and flexible approach to access the open ocean: Uses of Sailing Research Vessel Lady Amber During SPURS-2. Oceanography 32(2):116–121, https://doi.org/​10.5670/oceanog.2019.219.

Remote Measurements & Research. 2015. Handbook: ROSR (Remote Ocean Surface Radiometer), Version 6. 104 pp., http://www.rmrco.com/prod/rosr/rosr_handbook_v6.pdf.

Reverdin, G., S. Morisset, D. Bourras, N. Martin, A. Lourenço, J. Boutin, C. Caudoux, J. Font, and J. Salvador. 2013. Surpact: A SMOS surface wave rider for air-sea interaction. Oceanography 26(1):48–57, https://doi.org/​10.5670/​oceanog.2013.04.

Riser, S.C., J. Yang, and R. Drucker. 2019. Observations of large-scale rainfall, wind, and sea surface salinity variability in the eastern tropical Pacific. Oceanography 32(2):42–49, https://doi.org/​10.5670/oceanog.2019.211.

Rutledge, S.A., V. Chandrasekar, B. Fuchs, J. George, F. Junyent, P. Kennedy, and B. Dolan. 2019. Deployment of the SEA-POL C-band polarimetric radar to SPURS-2. Oceanography 32(2):50–57, https://doi.org/10.5670/oceanog.2019.212.

Shcherbina, A.Y., E.A. D’Asaro, and R.R. Harcourt. 2019. Rain and sun create slippery layers in the Eastern Pacific Fresh Pool. Oceanography 32(2):98–107, https://doi.org/​10.5670/oceanog.2019.217.

Sprintall, J. 2019. Upper-ocean salinity stratification during SPURS-2. Oceanography 32(2):40–41, https://doi.org/10.5670/oceanog.2019.210.

SPURS-2 Planning Group. 2015. From salty to fresh—Salinity Processes in the Upper-ocean Regional Study-2 (SPURS-2): Diagnosing the physics of a rainfall-dominated salinity minimum. Oceanography 28(1):150–159, https://doi.org/​10.5670/oceanog.2015.15.

Supply, A., J. Boutin, G. Reverdin, J.L. Vergely, H. Bellenger, M. Katsumata, and N. Reul. 2018. Variability of satellite sea surface salinity under rainfall. 2018. Paper presented at Ocean Salinity Science Conference, November 6–9, 2018, Sorbonne University, Paris, France, https://salinity.oceansciences.org/​docs/ossc2018_d01_supply.pdf.

Thompson, E.J., W.E. Asher, A.T. Jessup, and K. Drushka. 2019. High-resolution rain maps from an X-band marine radar and their use in understanding ocean freshening. Oceanography 32(2):58–65, https://doi.org/​10.5670/oceanog.2019.213.

Ullman, D.S., and D. Hebert. 2014. Processing of underway CTD data. Journal of Atmospheric and Oceanic Technology 31(4):984–998, https://doi.org/​10.1175/​JTECH-D-13-00200.1.

Volkov, D.L., S. Dong, G.R. Foltz, G. Goni, and R. Lumpkin. 2019. Observations of near-​surface salinity and temperature structure with dual-​sensor Lagrangian drifters during SPURS-2. Oceanography 32(2):66–75, https://doi.org/​10.5670/oceanog.2019.214.

Yang, J., S.C. Riser, J.A. Nystuen, W.E. Asher, and A.T. Jessup. 2015. Regional rainfall measurements using the Passive Aquatic Listener during the SPURS field campaign. Oceanography 28(1):124–133, https://doi.org/​10.5670/oceanog.2015.10.

Zhang, D., M.F. Cronin, C. Meinig, J.T. Farrar, R. Jenkins, D. Peacock, J. Keene, A. Sutton, and Q. Yang. 2019. Comparing air-sea flux measurements from a new unmanned surface vehicle and proven platforms during the SPURS-2 field campaign. Oceanography 32(2):122–133, https://doi.org/​10.5670/oceanog.2019.220.

Copyright & Usage

This is an open access article made available under the terms of the Creative Commons Attribution 4.0 International License (https://creativecommons.org/licenses/by/4.0/), which permits use, sharing, adaptation, distribution, and reproduction in any medium or format as long as users cite the materials appropriately, provide a link to the Creative Commons license, and indicate the changes that were made to the original content. Images, animations, videos, or other third-party material used in articles are included in the Creative Commons license unless indicated otherwise in a credit line to the material. If the material is not included in the article’s Creative Commons license, users will need to obtain permission directly from the license holder to reproduce the material.