The Global Heat Budget
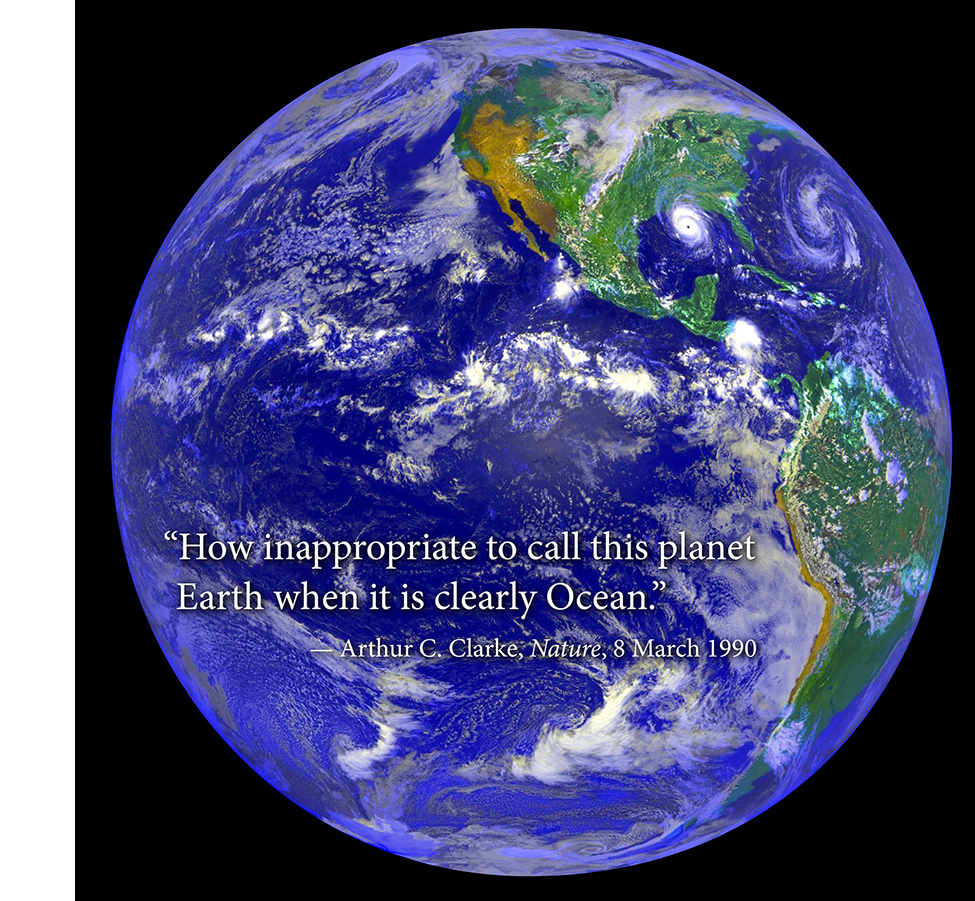
The large size of Earth’s ocean is the essential reason that humanity enjoys a stable, life-sustaining climate. Our planet is 71% covered in water to an average depth of 3.8 km. Water’s very high heat capacity and fluidity render it the central player in our climate system, able to absorb, store, and transport the heat supplied by the Sun. In contrast, the other fluid in our climate system, the atmosphere, has little intrinsic heat capacity, and relies on ocean-supplied moisture for a substantial fraction of its heat transport.
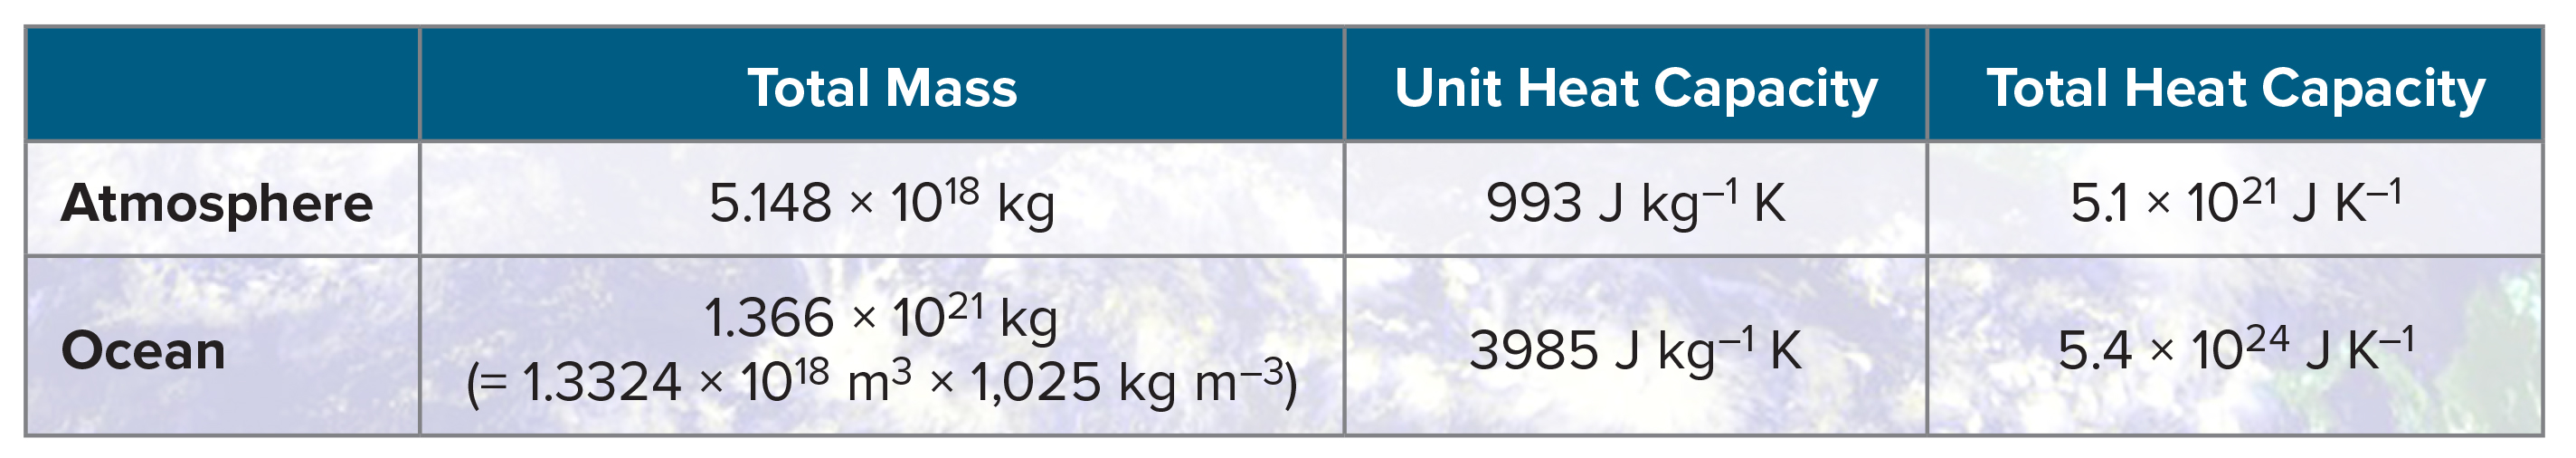
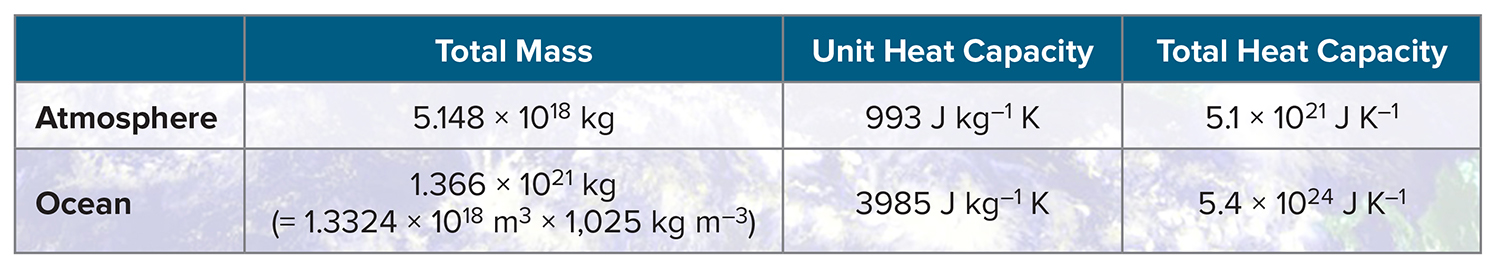
We can use updated estimates of the ocean’s volume (Charette and Smith, 2010), mean density, and heat capacity to estimate its total heat capacity for comparison with the atmosphere (Table 1). Estimates of the mass of the atmosphere are impacted by how much water vapor it contains, which varies seasonally and in response to El Niño and volcanic eruptions (Trenberth and Smith, 2005). We see that the ocean has over 1,000 times the heat capacity of the atmosphere. This large difference in heat capacity assures a dominant place for the global ocean in moderating the temperature of our planet on diurnal to centennial timescales. It assures the habitability of our planet. It accounts for the delay in realizing the global warming expected from our present CO2 concentrations. That is, with current estimates of the radiative energy imbalance of 0.5–1 W m–2 (Trenberth et al., 2014), it is readily calculated that if all of the extra heat due to the greenhouse change in the radiation balance is deposited over the whole ocean, it would take 340 to 680 years for the average ocean temperature to rise 1°C. Given the rate of rise in CO2 emissions, it is clear that Earth cannot realize an equilibrium climate state for many centuries, even after CO2 concentrations are stabilized. The rate of change of surface air temperatures is crucially dependent on the rates of ocean mixing and advection that presently serve to delay the greenhouse gas-imposed changes in global temperature. The storage of heat in the ocean can account for the so-called “hiatus” in rising air temperatures of recent years (W. Liu and Xie, 2018, in this issue), though other processes may contribute as well (Santer et al., 2014). Thus, ocean heat content has emerged as the most important aspect of heat storage on Earth, having absorbed over 90% of the CO2-induced global warming over the past several decades (Purkey and Johnson, 2010; Rhein et al., 2013; Trenberth et al., 2014; Riser et al., 2016; Wijffels et al., 2016).
Table 1. Mass and heat capacity of the ocean and atmosphere. > High res table
|
But another property of the ocean also contributes to its importance, and that is its remarkable ability to absorb solar radiation. That is, the dark blue ocean, covering most of the planet’s surface, has low albedo (or reflectivity) and thus readily soaks up solar heat over its upper tens of meters. In contrast, dry land generally reflects most solar energy and only warms by conduction to a few meters. The presence of water and vegetation permits greater terrestrial heat absorption, but the immobility of land means it cannot contribute to the meridional heat transports needed to balance the radiation budget. For the ocean, a very important climate feedback is found in the extent of sea ice at high latitudes. The bright white ice drastically changes the ocean albedo from highly absorbing to highly reflecting of the incoming solar energy. Thus, the extent of sea ice has important positive feedback effects on the climate system. That is, a reduction in ice cover leads to more heating of the ocean and further sea ice decline (NRC, 2011; IPCC, 2013), while expansion of sea ice leads to less ocean heat gain. Such ice-albedo feedback is an important factor in the “Snowball Earth” climates of the distant past (Schrag et al., 2002). There is much interest in the shorter-term consequences of variability in Arctic sea ice extent because the additional ocean heat leads to more heating of the atmosphere and to precipitation as snow in adjacent continental regions, leading to a rearrangement of the atmospheric circulation with impacts on mid-latitude climate (Francis et al., 2009; Vihma, 2014).
Earth is heated by shortwave radiation from the Sun and maintains its temperature by longwave radiation into space. The longwave radiation is rather uniform over the planet’s surface, because it depends on the fourth power of the absolute temperature, and surface temperature variations are small in absolute terms. However, the shortwave radiation comes more directly into the tropics than it does at higher latitudes, so there is a net energy imbalance that provides a tropical surplus and a polar deficit. The two moving components of the climate system, the atmosphere and the ocean, must transport heat from the tropics to higher latitudes by moving their respective fluids around. With its large heat capacity, the ocean can do this with relatively small water velocities; much higher velocities are required in the atmosphere. While it is popular to say that those wind velocities “drive” the ocean, we have to recognize that it is the extraction of heat from the ocean by latent and sensible heat fluxes that drives the atmosphere. A more accurate statement is that the Sun heats the ocean and the ocean supplies heat and moisture to the atmosphere, powering the winds responsible for part of the ocean’s motion.
Figure 1 shows the pattern of average net heat flux into and out of the global ocean. Heat is absorbed by the ocean in lower latitudes and the eastern sections of ocean basins; heat is lost to the atmosphere at higher latitudes and on the western side of basins. The east-west asymmetry is due to the ocean’s anticyclonic wind-driven circulation: western boundary currents carry tropical heat to higher latitudes where it is transferred to the atmosphere. Of course, there is also a mixing-driven overturning thermohaline circulation in the ocean, whereby energy from tides and wind cause downward mixing of heat and upwelling of cold water, as classically described by Munk (1966) and Munk and Wunsch (1998). With tides driving the mixing in the presence of the imposed meridional temperature gradients, the thermohaline circulation would carry heat poleward even if the winds ceased to blow. The thermohaline circulation also leads to anomalous ocean heat transport in the South Atlantic, where the strength of the North Atlantic overturning cell produces an equatorward heat transport. The ocean dominates meridional heat transport at low latitudes and transfers the heat to the atmosphere in mid-latitudes, primarily via the western boundary currents (e.g., Gulf Stream, Kuroshio). Much of this energy transfer is accomplished by latent heat flux from ocean to atmosphere. The atmosphere can either “cash in” the latent heat energy locally as rainfall that provides adiabatic heating of the atmosphere at height, or it can carry the moisture further poleward where precipitation exceeds evaporation. Here it is worth noting the basic energy transfers between the Sun, the ocean, and the atmosphere.
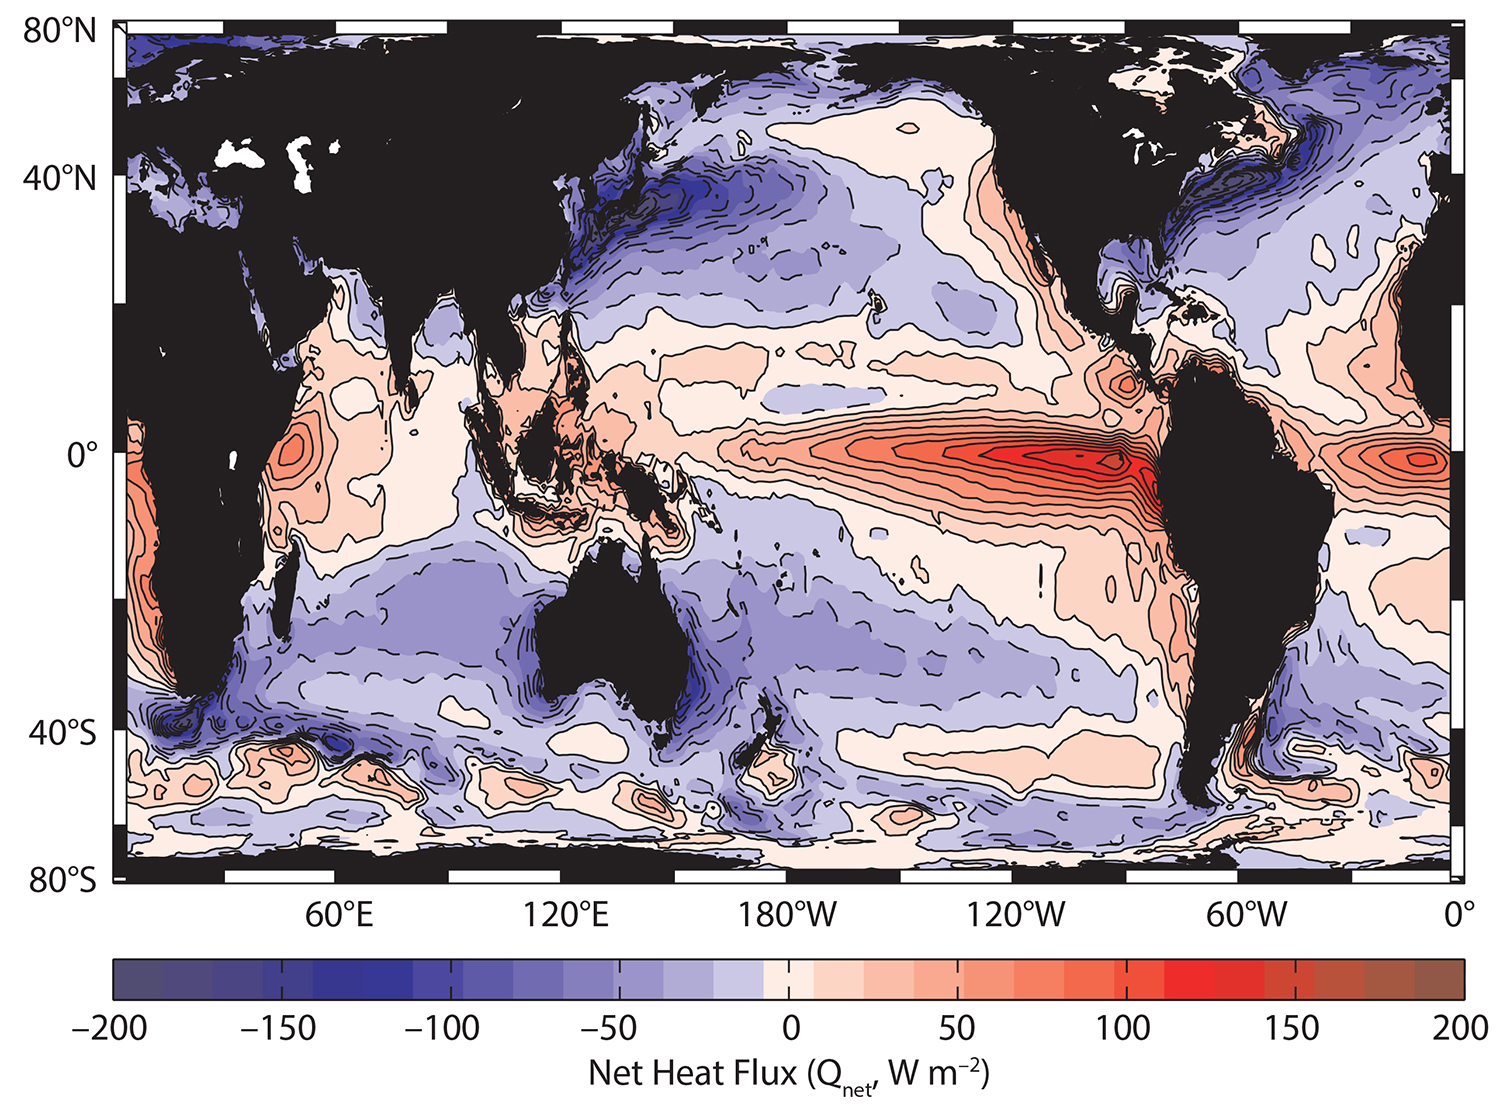
Figure 1. The net heat flux into (red) or out of (blue) the ocean. Data sources: Objectively Analyzed Air–Sea Fluxes (OAFlux) of Yu and Weller (2007) plus International Satellite Cloud Climatology Project radiation (https://isccp.giss.nasa.gov). > High res figure
|
The net energy exchanges between the Sun and surface elements of Earth, both land and sea, have been the subjects of a number of summaries (Trenberth et al., 2009; Stephens et al., 2012; Wild et al., 2015). Figure 2 focuses on the average fluxes for the ocean. We see that the solar input of energy is mostly balanced by latent heat loss due to evaporation. Longwave radiation is roughly half as large, and sensible heat flux is an order of magnitude less. In the subtropics, the sensible heat flux can be as little as 5% of the latent flux (Farrar et al., 2015). This dominance of the latent heat in ocean to atmosphere energy transfer shows the important connection between the water and energy cycles for planet Earth.
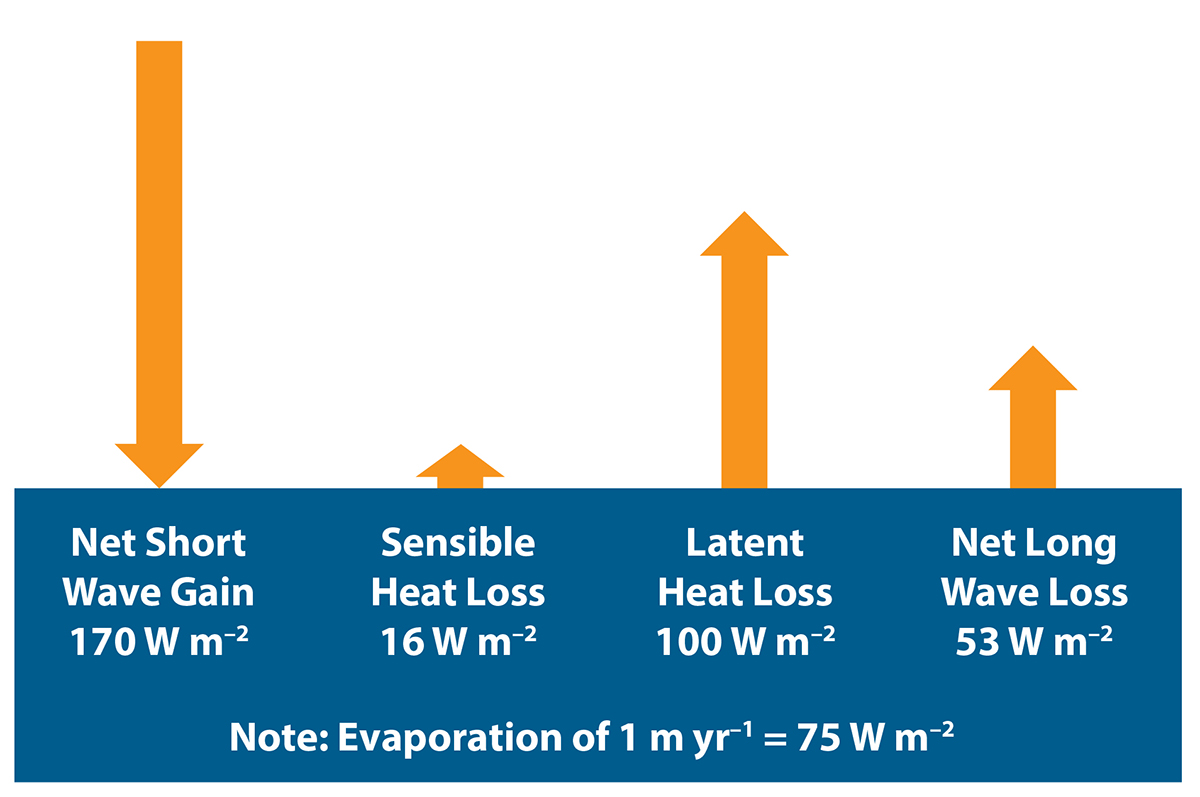
Figure 2. A diagram of the average energy fluxes from the Sun to the ocean and from the ocean to the atmosphere. Adapted from Wild et al. (2015) to show only the net heat fluxes into and out of the ocean. > High res figure
|
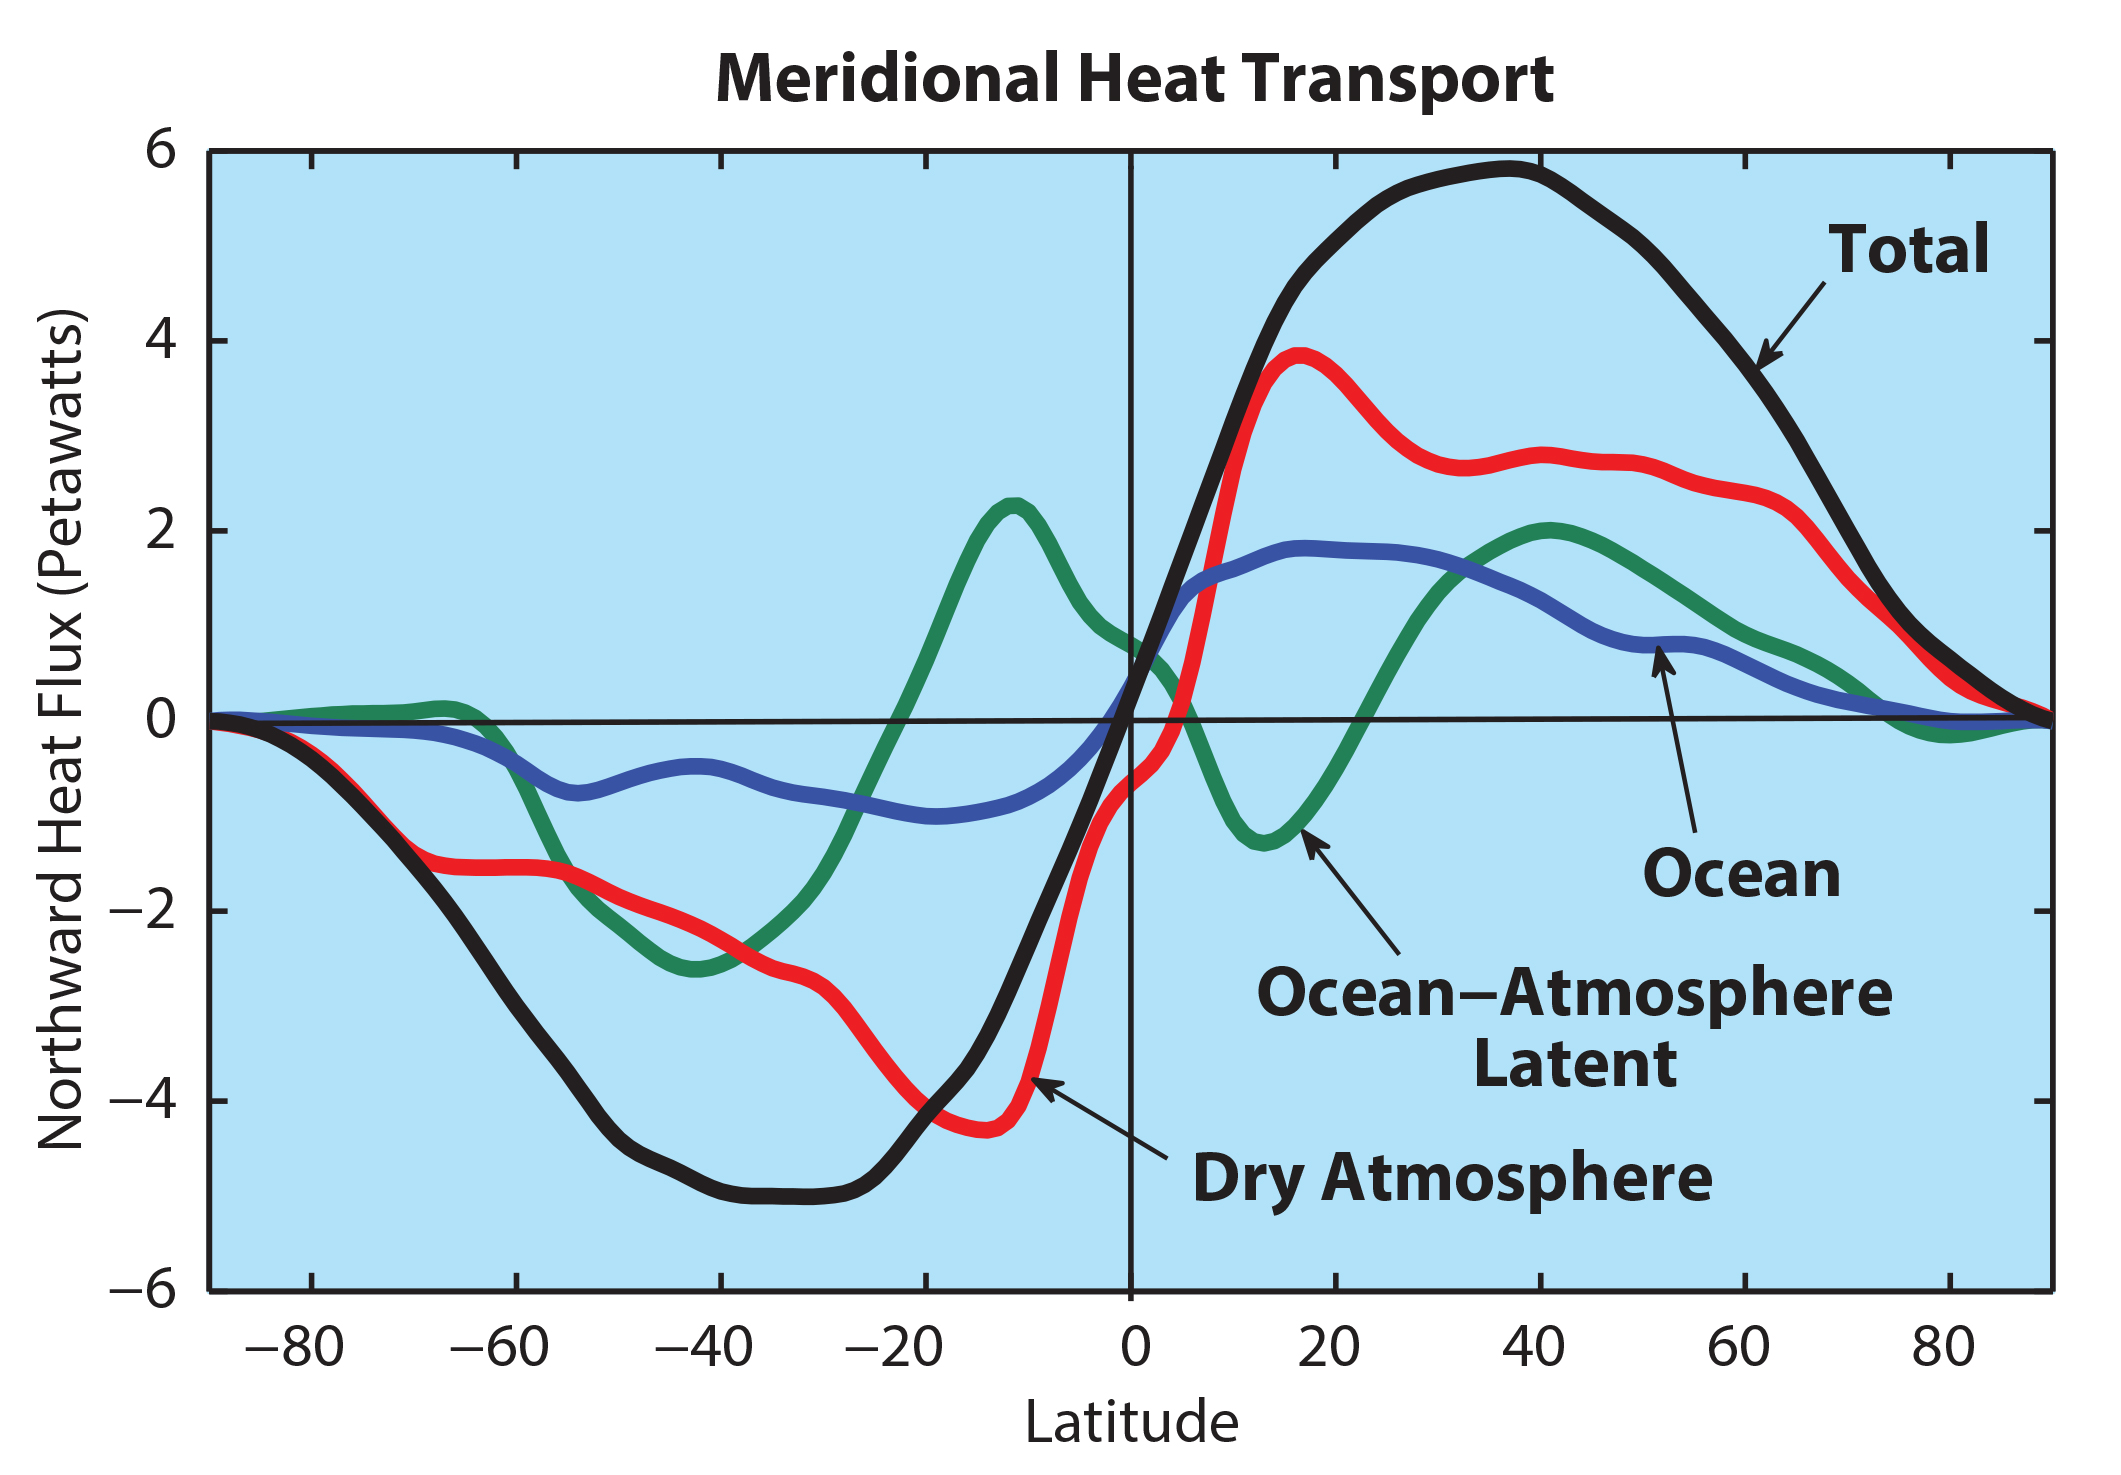
As noted earlier, the ocean and the atmosphere have to transport significant amounts of energy from the tropics toward the poles in order to satisfy the global radiation budget. It is possible to apportion this transport between ocean and atmosphere for comparison with estimates of the radiation to space (Wunsch, 2005). While there is still much to be done to refine the estimates using both observations and models, the general patterns can be discerned in Figure 3, derived from the model study of Yang et al. (2015). Here, we have chosen to separate the atmospheric flux into latent and sensible components, because the latent heat flux is dependent on the moisture supplied by the ocean, and the ocean serves to return the atmospheric water transport back to its place of origin. We see that the ocean-atmosphere latent heat transport due to the water cycle is a major component of the poleward heat transport on Earth. And of course, the water cycle is essential for all life as well.

Figure 3. The northward transport of heat as a function of latitude and its major components. The total heat flux is in black. It reaches nearly 6 PW in mid-latitudes to satisfy the required radiation to space as determined by satellites. The oceanic transport is in blue, the transport of the dry atmosphere is in red, and the ocean-atmosphere latent heat flux due to the water cycle is in green. Note that the latent heat flux is opposite the dry atmospheric flux at low latitudes. Thus, the ocean dominates the meridional flux in the tropics and hands off energy to the atmosphere for transport in mid-latitudes. Figure adapted from the modeling study of Yang et al. (2015). > High res figure
|
The Global Water Budget
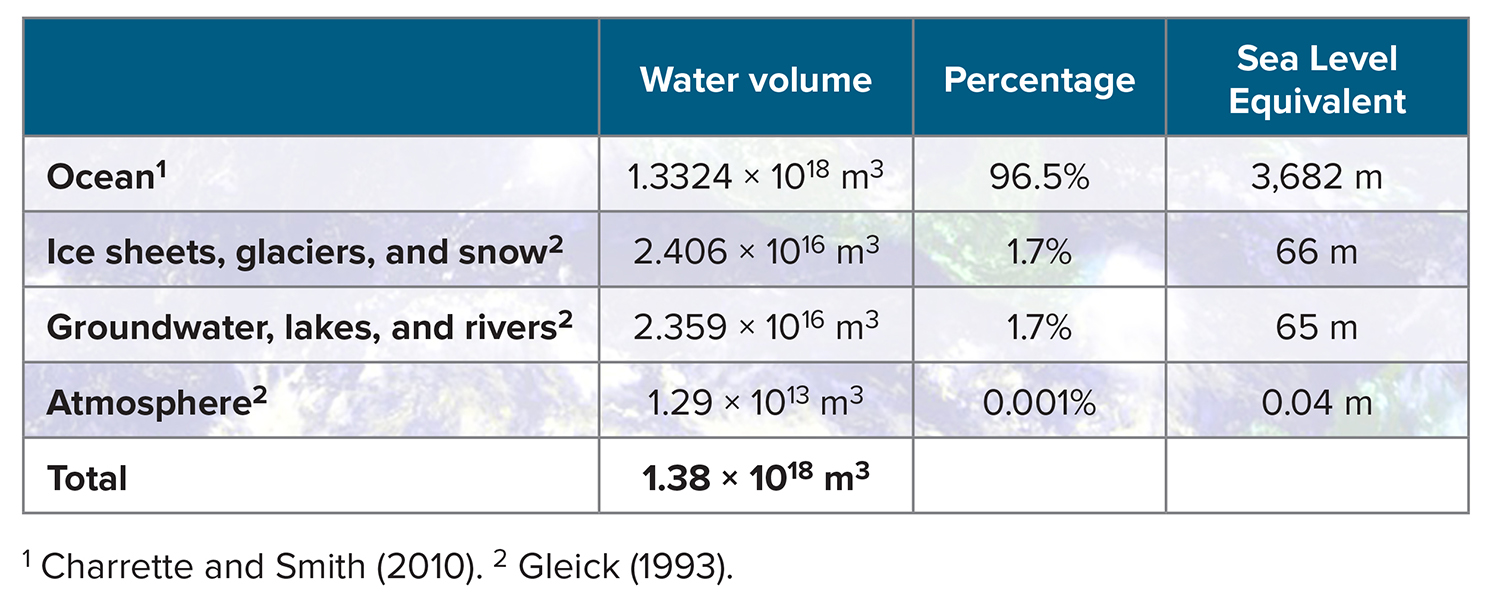
Recent estimates of the ocean’s volume (Charrette and Smith, 2010) allow us to assemble an updated partitioning of Earth’s water. Table 2 displays estimates of the major water reservoirs. Here, the dominance of the ocean over the atmosphere is even greater than for heat content, with a ratio of nearly 100,000 to one in water content. Of course, that small amount of water in the atmosphere is supplying all the freshwater that maintains civilization, having distilled it from the ocean surface with energy supplied by the Sun. That atmospheric water vapor is also the most important greenhouse gas that helps to maintain the equable temperatures on planet Earth.
Table 2. Water volumes (m3), their percentage of the total, and their sea level equivalents for the ocean, ice sheets, and glaciers; groundwater, lakes, and rivers; and the atmosphere. > High res table
|
The patterns of evaporation and precipitation over the ocean have been mapped by Schanze et al. (2010), among others (Figure 4). Of most interest is the net loss or gain of water by the ocean, or evaporation minus precipitation (E−P). This number lets us identify the regions where the ocean is exporting water and latent heat energy to other parts of the climate system and the regions where it is importing water. As Figure 4 shows, the subtropical high-pressure systems are the overall source regions for the global water cycle, supplying over 4 Sv (1 SV = 1 × 10⁶ m3 s–1) of moisture that rains out over the tropical ocean, the land, and the high latitude ocean, roughly apportioned as one-third each. It also happens that the ocean area with E>P is approximately equal to the area with P>E. Of course, land areas are a net water sink, with precipitation dominating to provide about 1.3 Sv of water flowing from land back to the ocean in rivers. This is only 10% of the evaporation over the global ocean, showing that the ocean truly dominates the global water cycle. This dominance also explains why the best evidence for intensification of the water cycle has emerged from trends in ocean salinities (Curry et al., 2003; Boyer et al., 2005; Hosoda et al., 2009; Durack and Wijffels, 2010; Helm et al., 2010; Durack et al., 2012; Rhein et al., 2013). In contrast, change in the terrestrial water cycle is harder to discern due to the construction of dams, deforestation, agriculture, irrigation, groundwater pumping, and cycling of river water through cities and power plants. In addition, the changes in the terrestrial water cycle are one-sided, providing only changes in precipitation (due to water availability: if there’s no water, there’s no signal), whereas the ocean integrates all incoming and outgoing water fluxes, capturing positive and negative anomalies (both sides of zero), with reduced or enhanced salinities, respectively. Nevertheless, the shorter record of terrestrial water storage as recorded by the Gravity Recovery and Climate Experiment (GRACE) satellites does show evidence for climate change in some regions (Rodell et al., 2018).
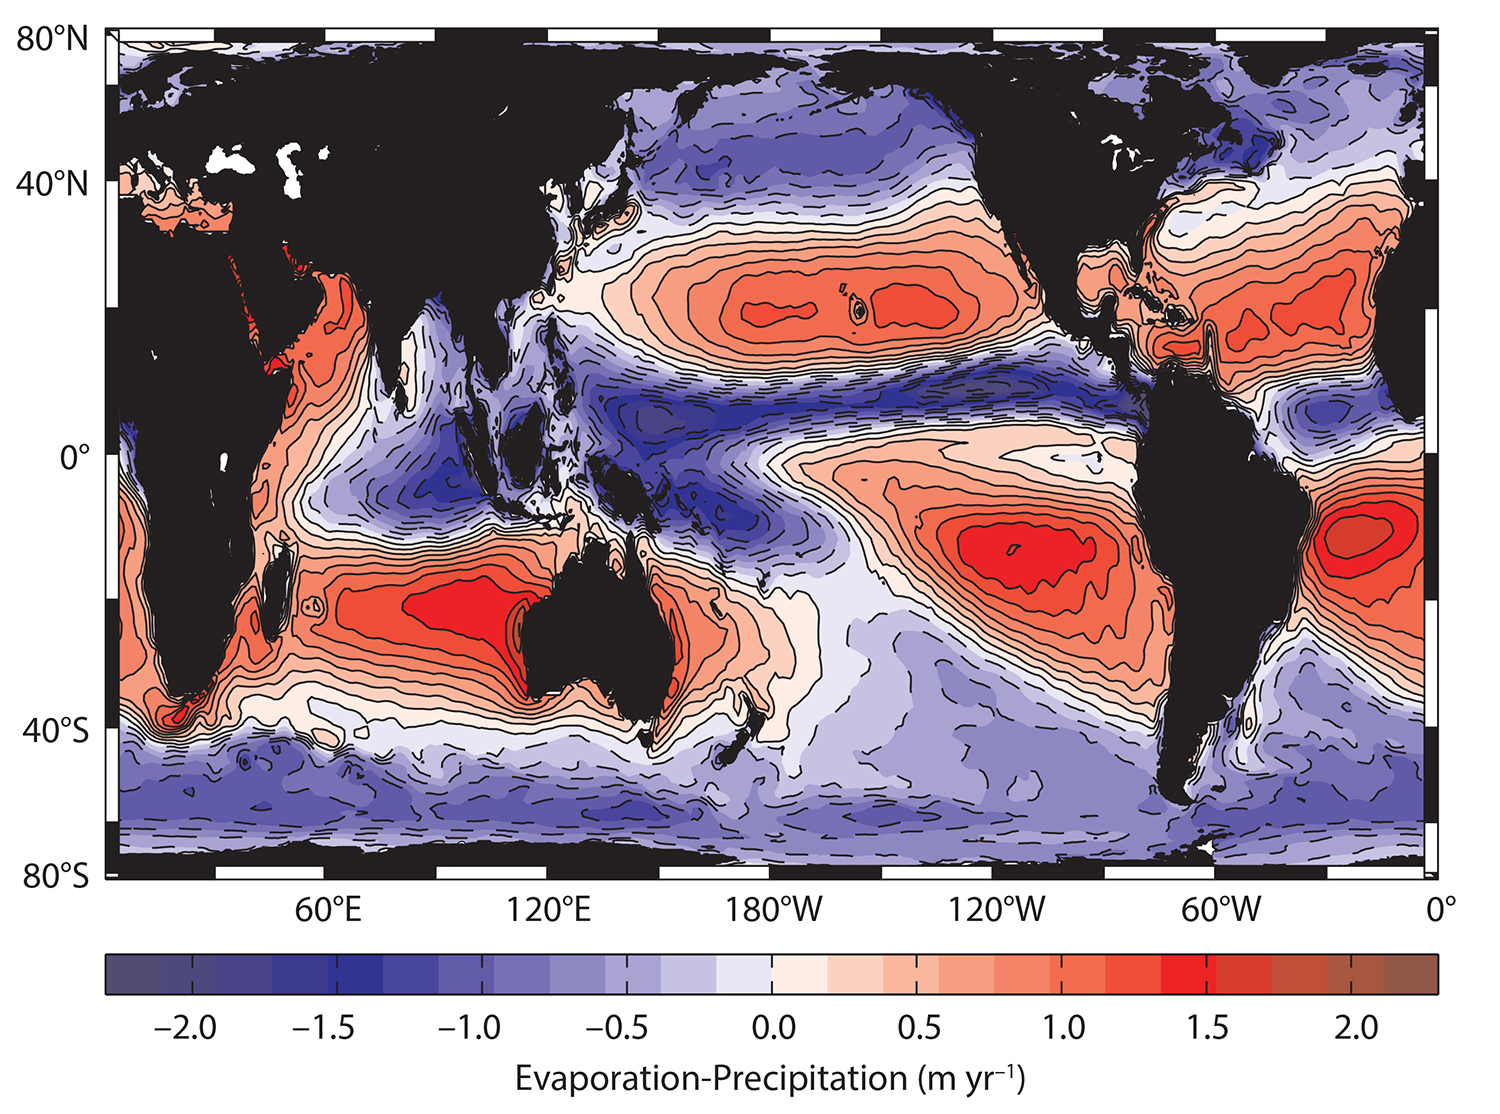
Figure 4. Net evaporation minus precipitation (E−P) over the global ocean. The subtropical high pressure systems have E>P (red) and export water to the rest of the climate system. The Intertropical Convergence Zone and high latitudes have P>E (blue). Land areas are dominated by precipitation as well and flux about 1.3 Sv of water back to the ocean via rivers. From Schanze et al. (2010). > High res figure
|
One aspect of the water cycle that is not well appreciated is that there is significant local recycling of water. That is, some of the precipitation falling at any one site has evaporated from only a short distance away. Curiously, isotopic data reveal that the major oceanic regions obey simple ratios between evaporation and precipitation (Benetti et al., 2017). That is, in the dry subtropical ocean, evaporation is about twice the local precipitation. The isotopes also show that in the tropical ocean rain zones, precipitation is about twice the local evaporation. The 2:1 ratio for P to E also holds for the total water balance in the high-latitude oceanic precipitation regions. This means that tropical and high-latitude ocean areas receive twice as much rain as is imported from the subtropical source regions. Interestingly, the total water balance on land behaves in a similar fashion, though with a somewhat higher P:E ratio. Baumgartner and Reichel (1975) estimate that overall precipitation on land is about 2.8 times the total water imported from the ocean. Of course, the recycling ratio would vary regionally such that in coastal areas nearly all of the rain comes from the ocean as exemplified by the “nor’easters” of New England and the “Pineapple Express” of the West Coast, while more recycling occurs farther inland due to evapo-transpiration and evaporation from soil moisture, lakes, and rivers. This stronger recycling rate shows that terrestrial precipitation is even more sensitive to the water imported from the ocean than is the ocean itself, in that a modest increase in transport from the ocean leads to an even greater increase in the volume of terrestrial rain. Soil moisture has emerged as a very important variable for rainfall on land and contributes to the “brown ocean” effect, whereby a sufficiently moist soil can convert more solar radiation into a latent heat flux that sustains tropical cyclones over land (Anderson and Shepherd, 2014, 2017). L-band radiometers on the Soil Moisture and Ocean Salinity (SMOS) and Soil Moisture Active Passive (SMAP) satellites promise to greatly improve the characterization of soil moisture while also helping to document sea surface salinity variability (Entekhabi et al., 2010; Lagerloef et al., 2010a; Kerr et al., 2012), two key variables for monitoring the global water cycle.
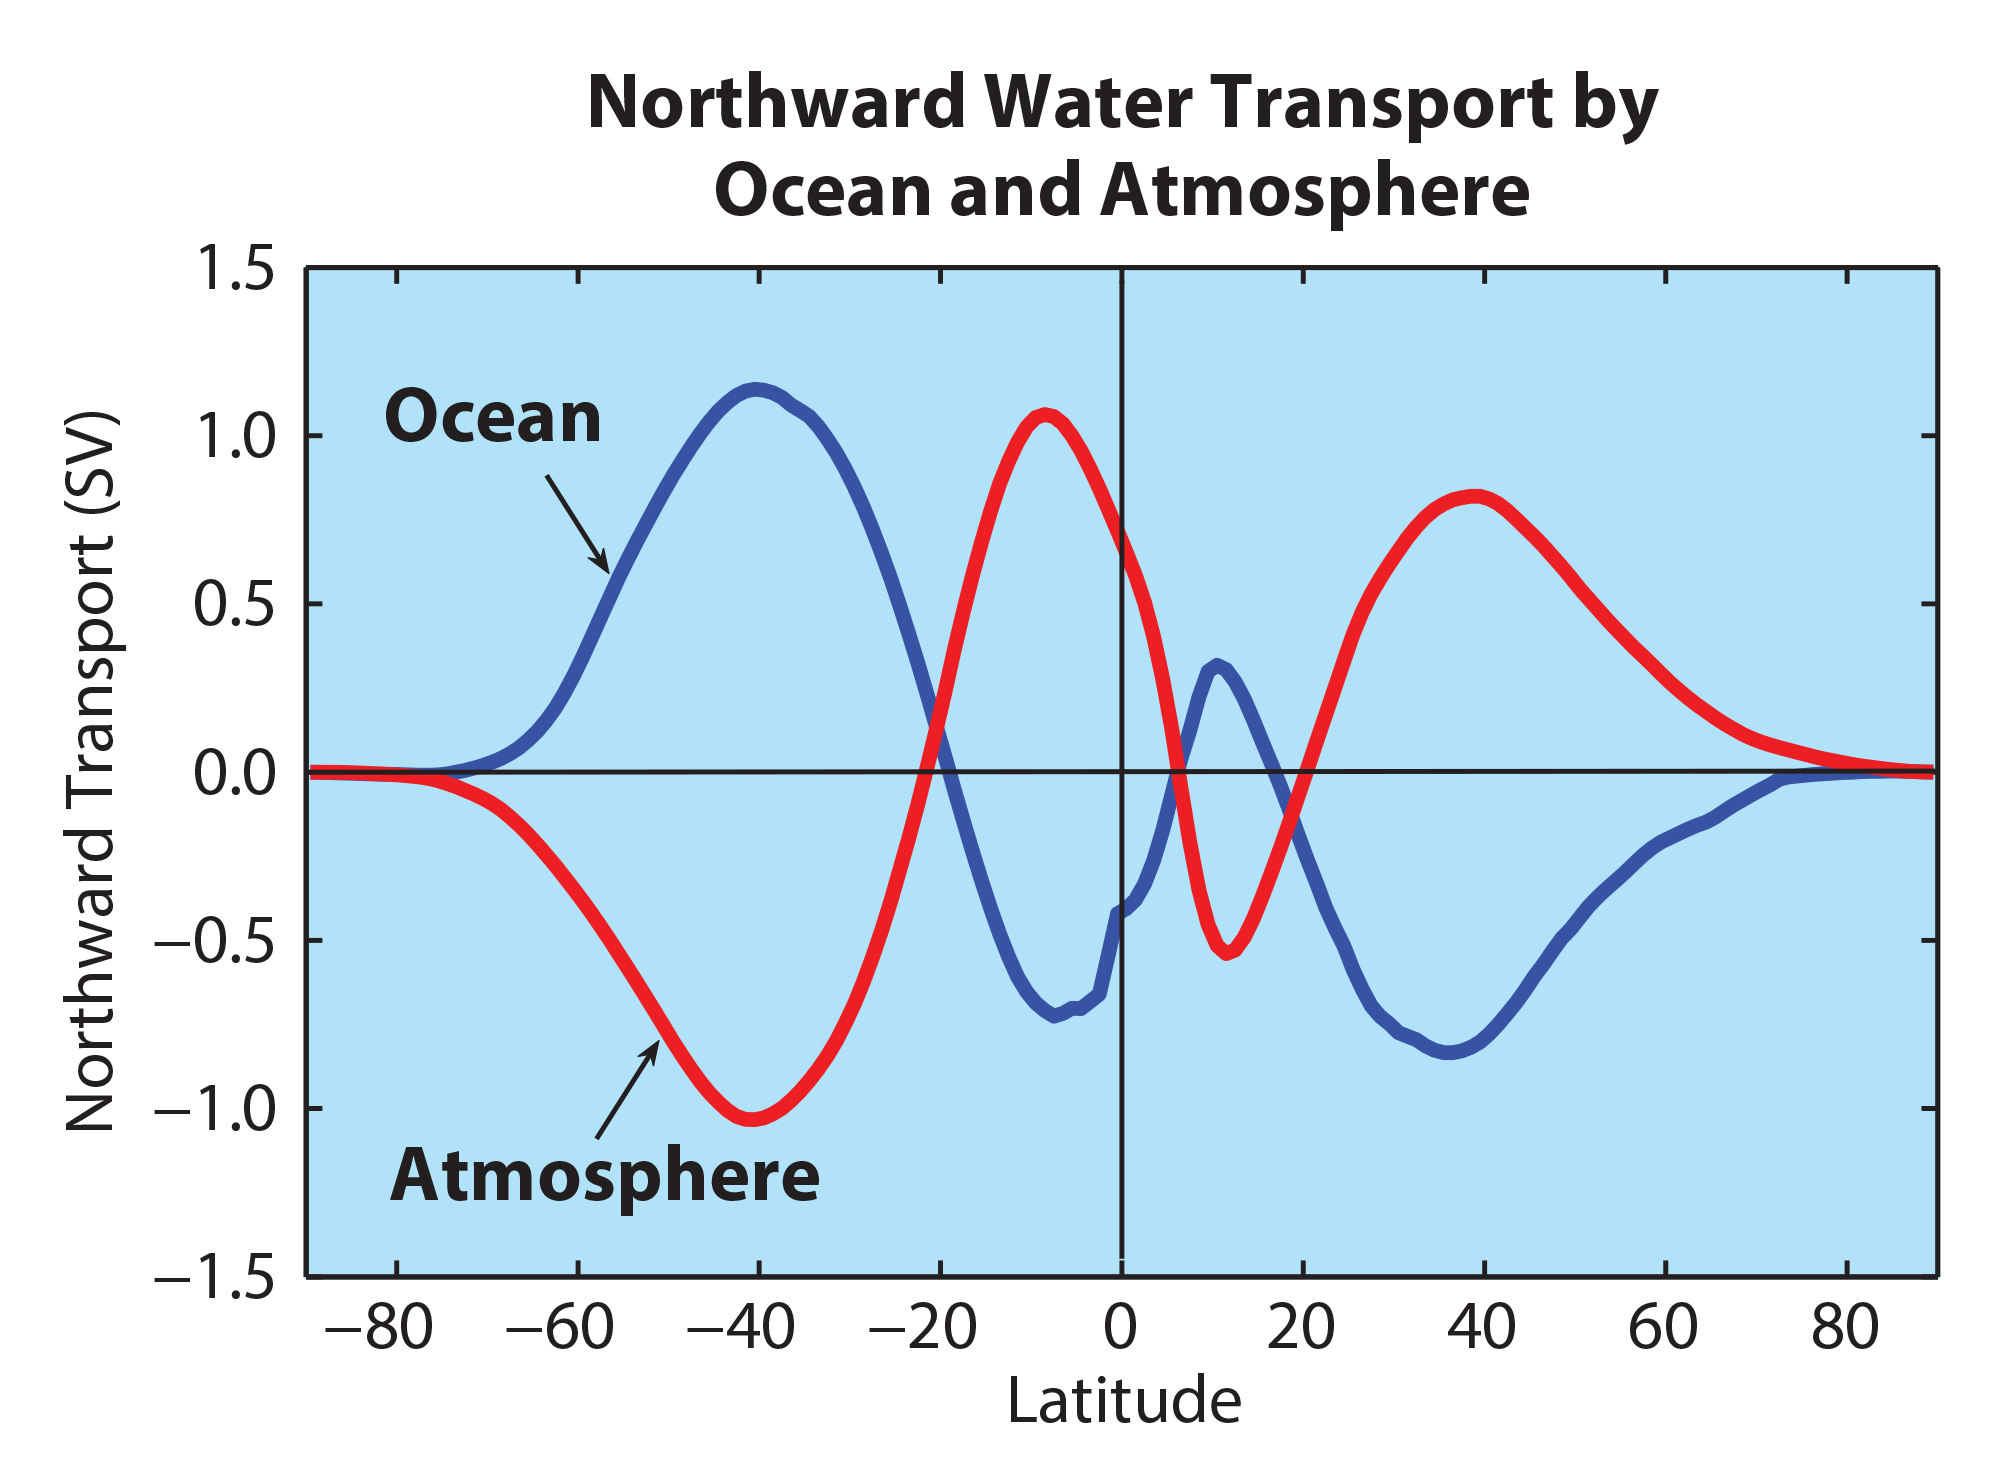
The pattern of mid-latitude net evaporation and net precipitation in both high and low latitudes leads to a more complex meridional flux profile than what we find for total heat transport. Figure 5 shows estimates of the meridional water flux by ocean and atmosphere for the present climate (Levang and Schmitt, 2015). The transport of water across the ocean’s interior mean salinity gradients is essentially equal in magnitude and opposite in sign to the transport in the atmosphere; meridional transport by rivers is negligible. Projections of future climate show increases in magnitude for these curves of ~20% by 2100, as can be seen in the analysis of the Coupled Model Intercomparison Project Phase 5 (CMIP-5) models by Levang and Schmitt (2015). An enhanced water cycle is expected because of the exponential dependence of water vapor pressure on temperature of about 7% per °C (Schmitt, 2008). An increase in the intensity of the global water cycle (as already documented by Durack and Wijffels, 2010, and Durack et al., 2012) has first-order implications for future storm risks. The ocean-to-land water transfer provides 3.2 PW of latent heat energy transport to land (Trenberth and Fasullo, 2013). This represents ~100% of the total ocean-to-land energy transport, because the dry static energy transport by land and sea breezes, when averaged over the seasonal cycle, are negligible. That ocean-sourced latent heat energy is an important energy supply for storms on land, and the enhanced soil moisture it supplies contributes to local conversion of solar energy into latent heat by the brown-ocean effect (Anderson and Shepherd, 2014, 2017), so we can expect an increase in the severity of wind storms, tornadoes, and hurricanes as the water cycle intensifies with global warming.
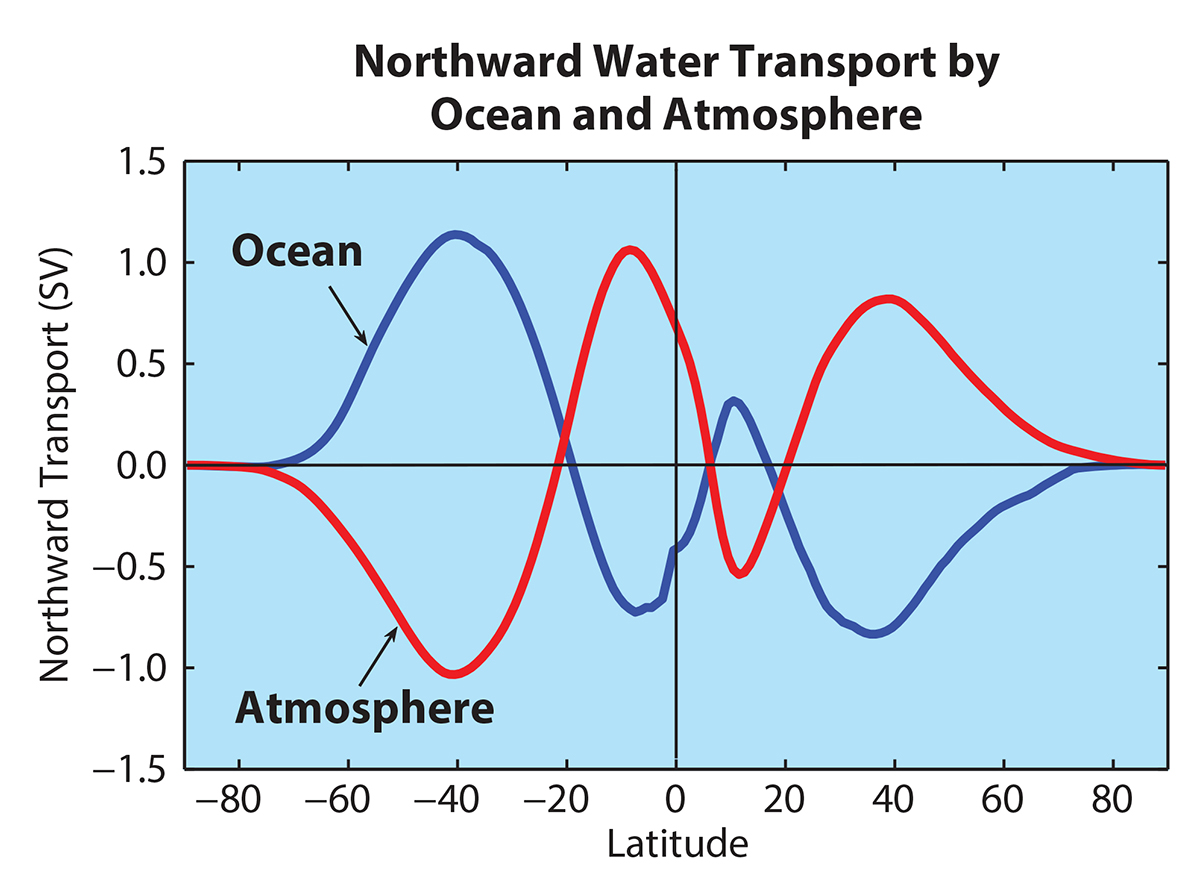
Figure 5. Estimates of zonally integrated meridional freshwater transport (1 Sv = 1 × 10⁶ m–3 s–1) in the atmosphere and the ocean. The atmospheric calculation uses the zonal integral of ERA-Interim moisture transport, and the ocean curve is produced from the surface integral of E−P and river runoff (Global Precipitation Climatology Project data, OAFlux plus runoff from Dai and Trenberth, 2002). The Southern Hemisphere has a larger water cycle than the Northern Hemisphere because of its greater expanse of ocean. In comparison, rivers have small meridional water transports, below the present uncertainties in the atmospheric and oceanic fluxes, though they do return the water rained out on land to the ocean. This amounts to about 10% of the evaporation from the global ocean. > High res figure
|
When water leaves the ocean through evaporation, it tends to make surface water saltier, and water rained on the ocean tends to make it fresher. We know that large-scale patterns of evaporation and precipitation lead to observed climatological patterns in sea surface salinity (SSS; Schmitt, 2008; Talley, 2008; Durack and Wijffels, 2010; Rhein et al., 2013), with the subtropical gyres having higher salinities than the tropics, high latitudes, and coastal regions that receive runoff from land. Long-term records of salinity exhibit distinct regional trends (Curry et al., 2003; Boyer et al., 2005; Durack and Wijffels, 2010). Durack et al. (2012) showed that the best evidence for a changing water cycle can be seen in the intensifying contrasts in ocean surface salinity; salty areas have been getting saltier and fresh areas have been getting fresher over the past 50 years. Recently, we have found that the variations in SSS can be used to forecast rainfall on land with surprisingly long lead times of several months (Li et al., 2016a, 2016b, 2017; T. Liu et al., 2018). That is, evaporation and precipitation are the sources of salinity variations. When a region of the ocean gets saltier than normal, there will be more rain somewhere else in the climate system and less rain elsewhere if it becomes fresher.
Distinct teleconnections between different regions of the North Atlantic to rainfall in the Sahel of Africa and to the US Midwest have been identified from SSS anomalies by Li et al. (2016a, 2016b, 2017). These authors find that the enhanced recycling of water on land and the role of soil moisture in changing the character of land-atmosphere interaction contribute to the long predictive lead time of SSS. Because SSS is an indicator of the net export of water and latent heat from the ocean, the largest component of energy supply to the atmosphere and land, it appears to have superior seasonal rainfall predictive power compared to sea surface temperature (SST) and conventional climate indices like NINO3.4, the North Atlantic Oscillation, and the Pacific Decadal Oscillation in some regions. In addition to the expected source-sink relations between SSS and terrestrial rainfall discovered by Li et al. (2016a, 2016b, 2017), some surprisingly remote teleconnections between fall SSS and winter precipitation in the US Southwest have been documented by T. Liu et al. (2018). These new results promise much improved rainfall forecasts on seasonal timescales if the oceanographic community maintains and strengthens its global ocean observing systems. In this regard, the success of the Argo float program (Roemmich et al., 2012; Riser et al., 2016) and Aquarius, SMOS, and SMAP salinity satellites have been particularly helpful for documenting the close connection of SSS to the global water cycle (Lagerloef et al., 2008, 2010b). Improving SSS monitoring to be comparable to SST in temporal and spatial resolution would enhance its utility for seasonal precipitation forecasts and make it useful for subseasonal forecasts as well.
The Global Carbon Budget
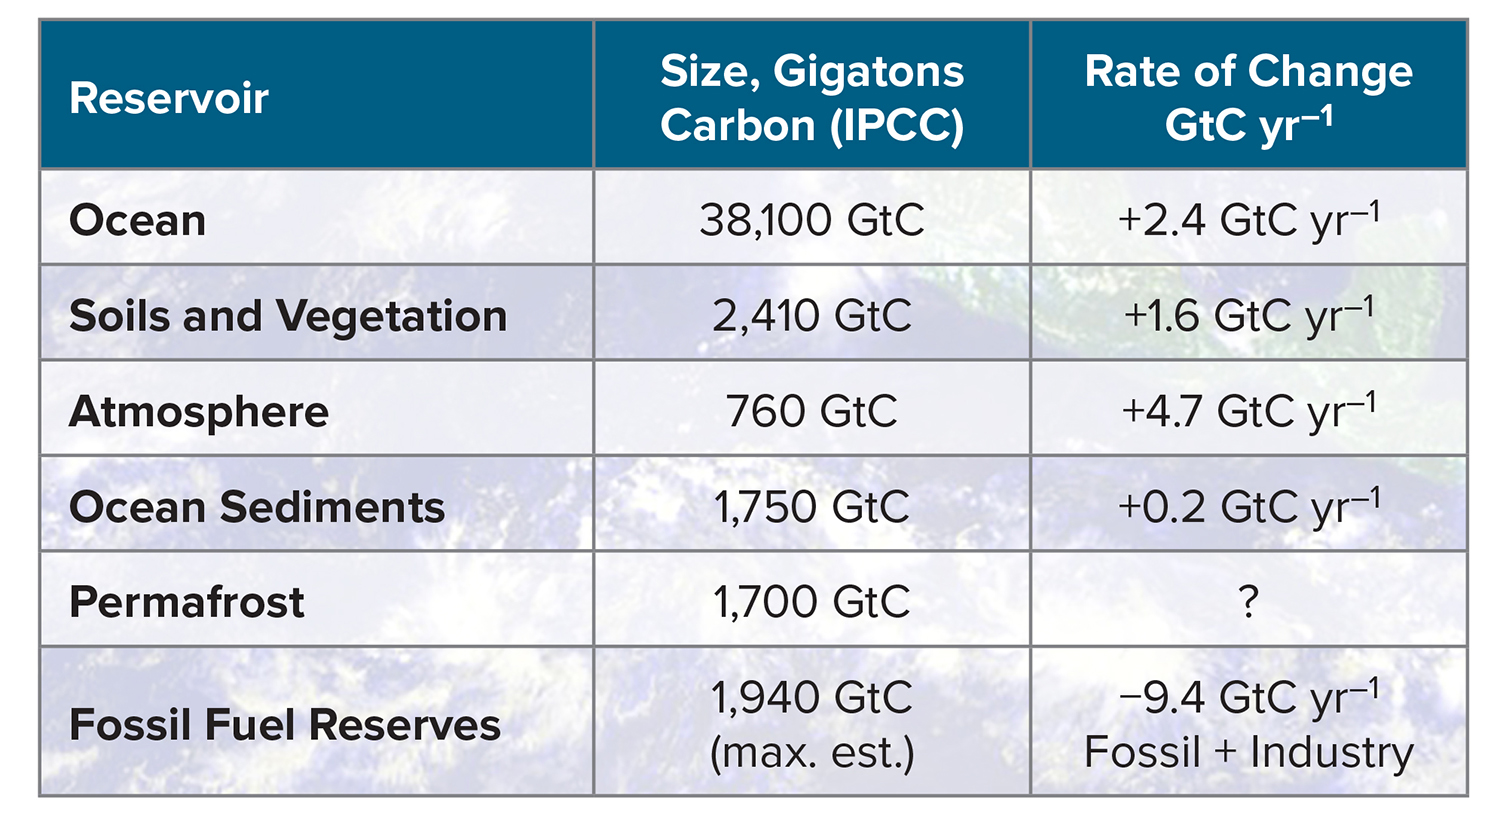
The ocean is by far the main reservoir of carbon in the climate system. It is also playing an important role in absorbing a significant fraction of the fossil carbon we are putting into the atmosphere. The ocean is thought to have played a major role in past climate variability due to the storage or release of its carbon to the atmosphere. Table 3 shows the major carbon reservoirs.
Table 3. Major carbon reservoirs on Earth and their rate of change (from Le Quéré et al., 2018). > High res table
|
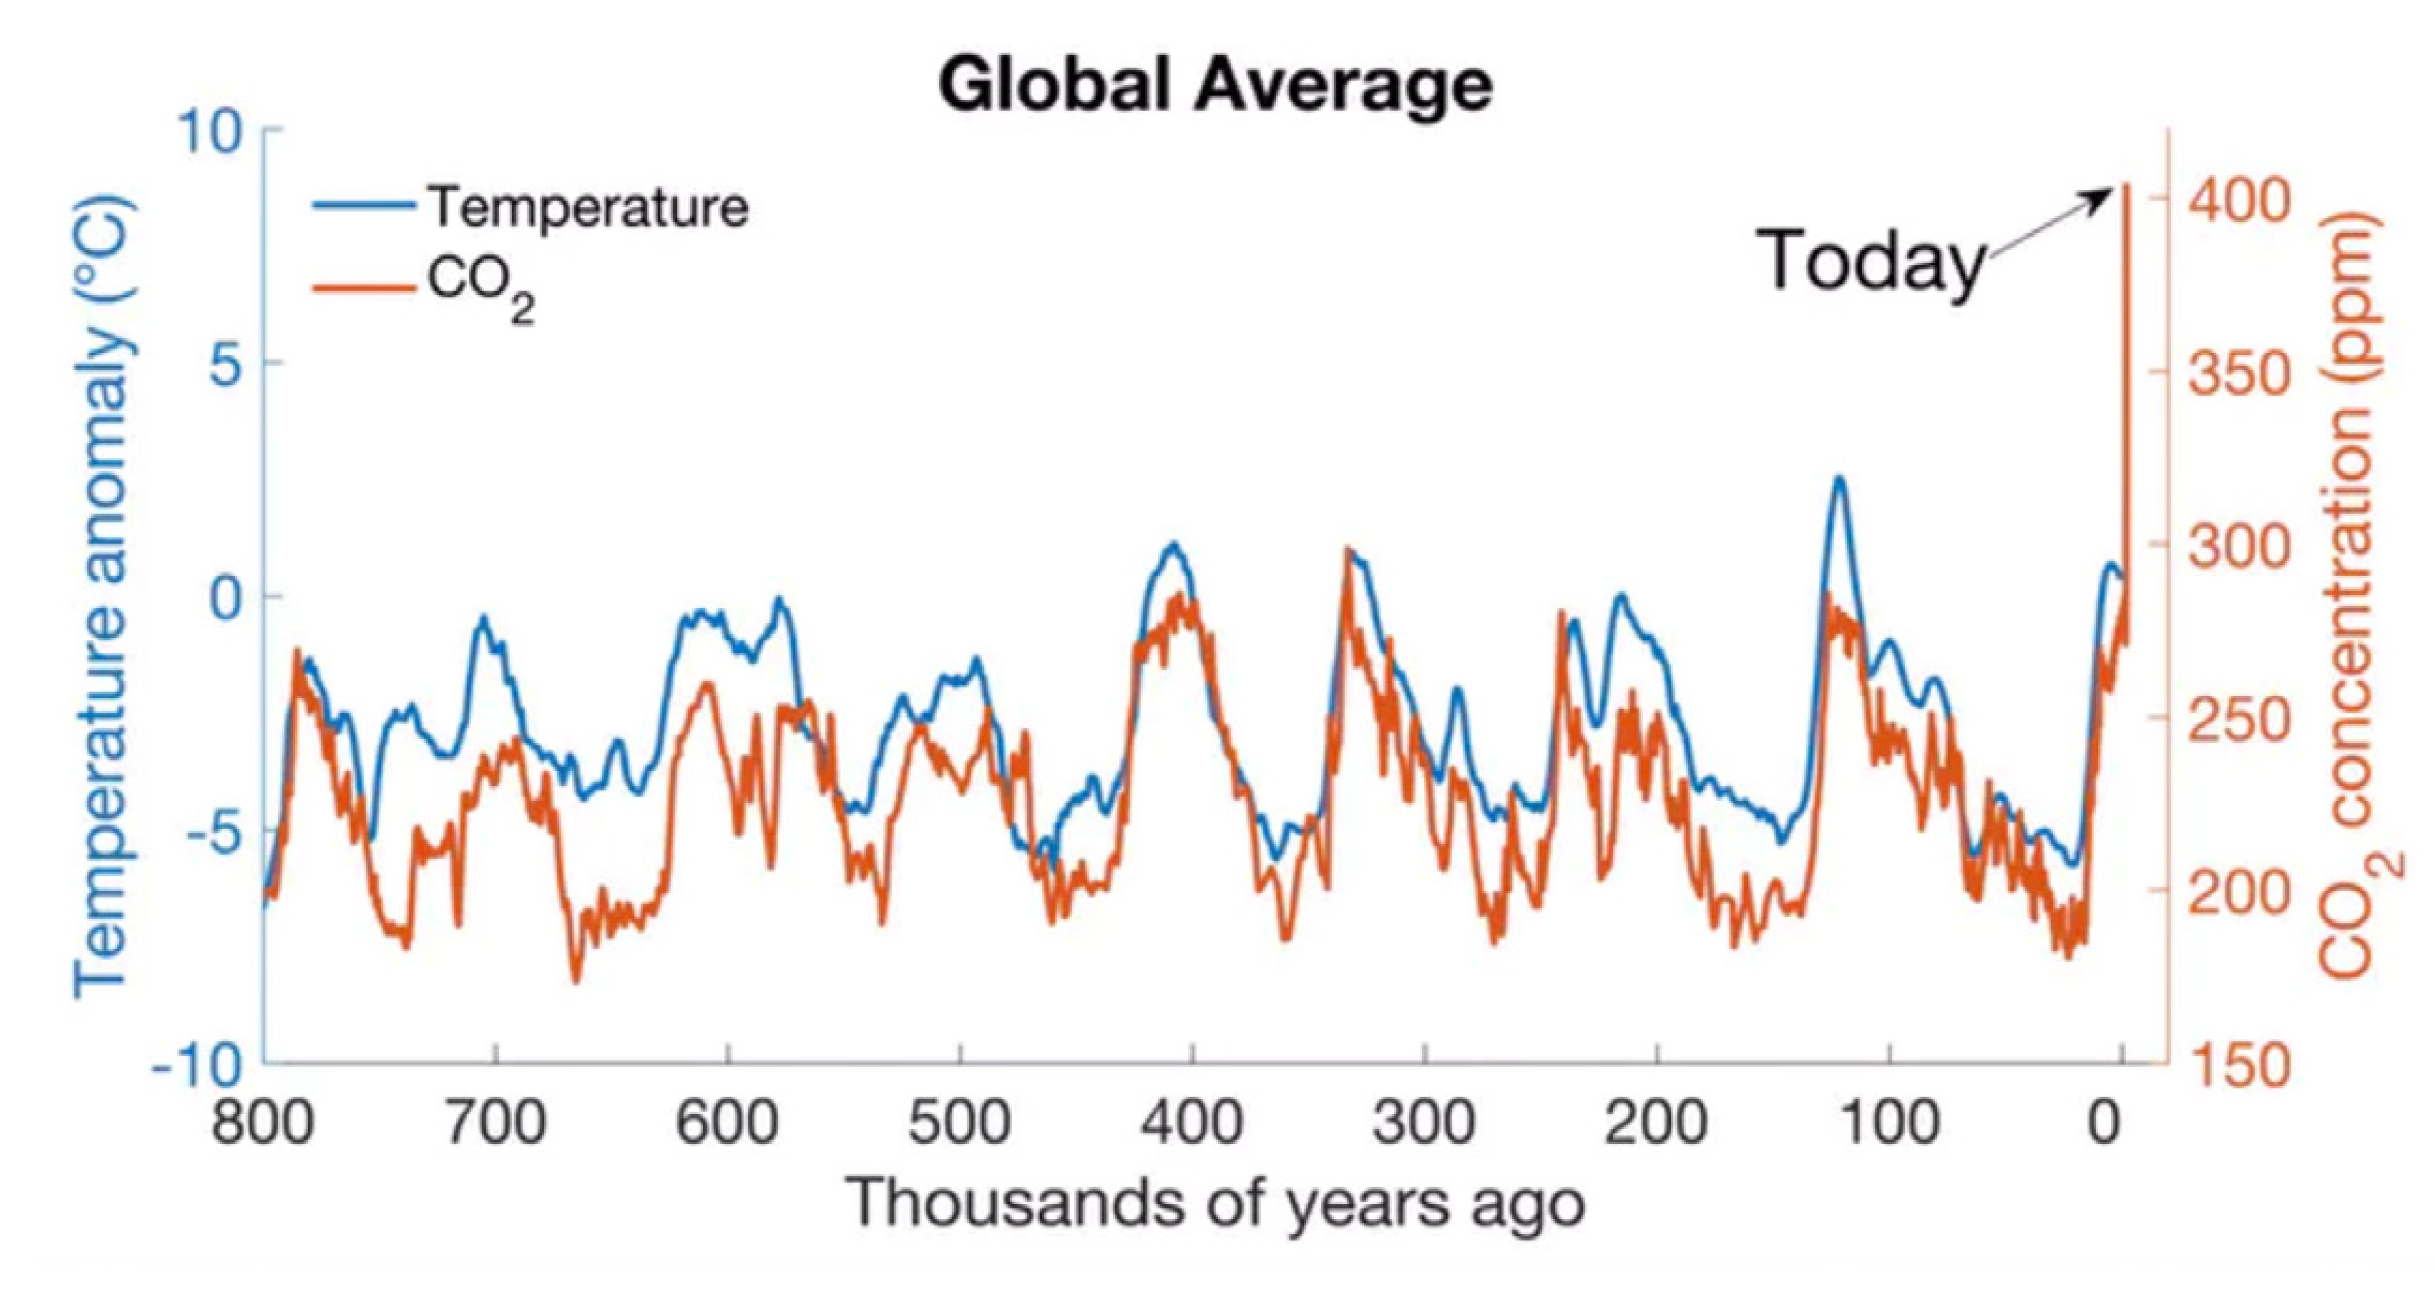
Clearly, the ocean dominates the carbon storage budget, as it does the water and energy budgets. While it is estimated to be absorbing about 30% of anthropogenic carbon at present, there is plenty of evidence that it was the main regulator of atmospheric CO2 in past climates (Fischer et al., 2010). Figure 6 shows the tight coupling between atmospheric CO2 and global temperatures during the last 800,000 years. The ice age cycles are the dominant signal, and only the oceanic reservoir could have absorbed and released these quantities of carbon in response to changing temperatures; the absorption of CO2 by the weathering of rocks is much too slow. The changes in global CO2 and temperature are thought to be roughly synchronous (Parrenin et al., 2013) though with complex phasing between the time series for Antarctic temperatures and global CO2 (Beeman et al., 2018). There is a positive feedback in operation between temperature and CO2; a warmer ocean puts more CO2 into the atmosphere because of the decrease in solubility with increasing temperature, and more CO2 in the atmosphere warms the ocean. The difference in gas carrying capacity with temperature is called the solubility pump. The general warming of the ocean and a slowing of the meridional overturning circulation will both cause less CO2 to be absorbed by this physical mechanism (Ito and Follows, 2003). Changes in ocean stratification related to expansion of Antarctic sea ice and greater production of saltier Antarctic Bottom Water may have served to trap greater amounts of CO2 in the deep ocean during glaciations (Keeling and Stephens, 2001; Ferrari et al., 2014). The expanded sea ice cover would have inhibited exchange with the atmosphere and thus prevented outgassing of CO2.
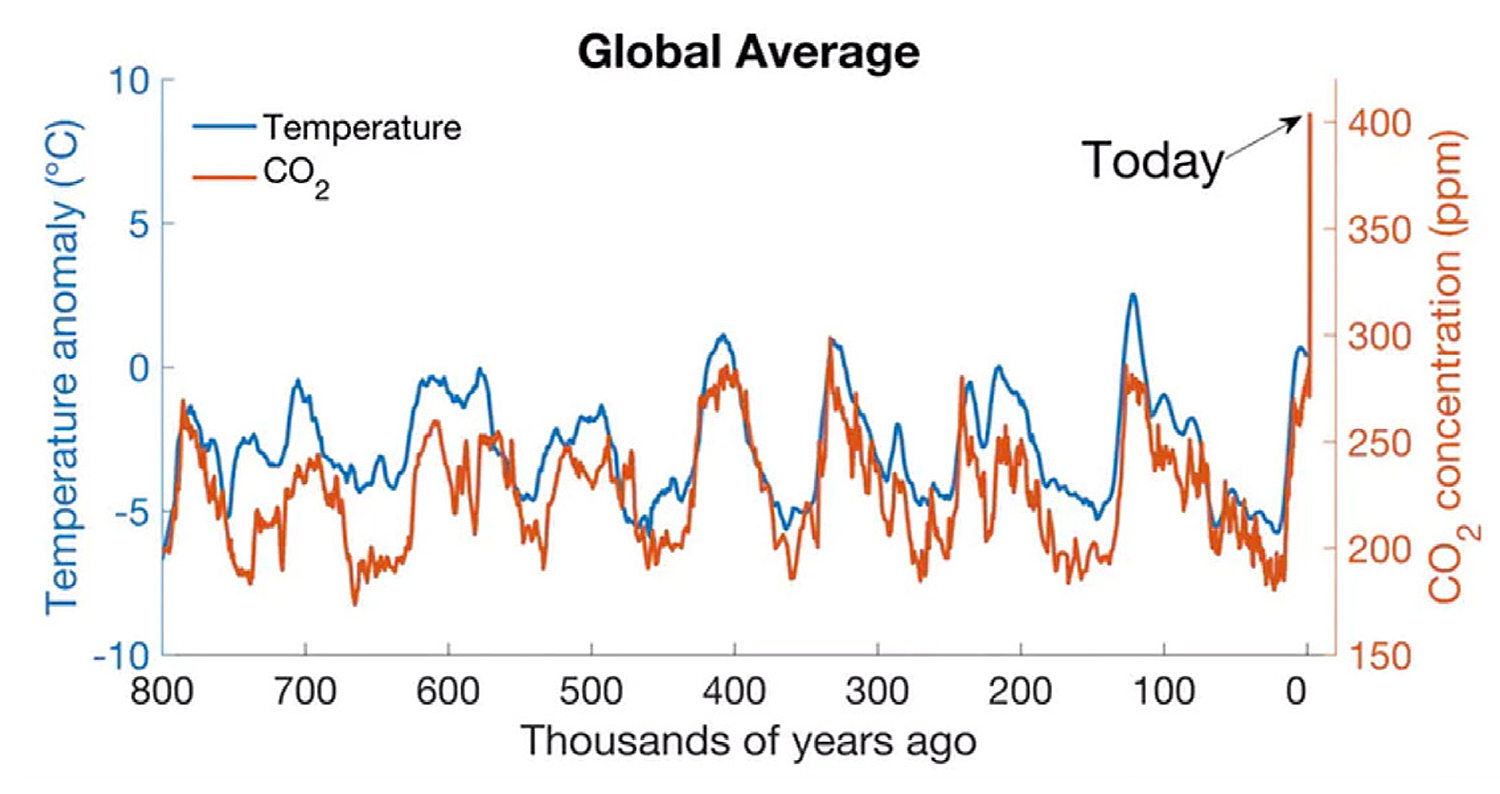
Figure 6. Time series of atmospheric temperature anomaly and CO2 concentration from Antarctic ice cores. Data from Parrenin et al., 2013; Snyder et al., 2016, and Bereiter et al., 2015; plotted by Benjamin Henley, University of Melbourne, and Nerilie Abram, Australian National University. > High res figure
|
The ocean’s biological pump also results in storage of CO2, whereby sinking fecal pellets carry carbon to the deep ocean where it may be sequestered for thousands of years. It has been suggested that enhancement of the biological pump due to the fertilization effect of iron in windblown continental dust caused part of the drawdown in atmospheric CO2 during glacial periods (Martin, 1990; Martínez-García, 2014). Evidence has been reported for a CO2 drawdown that led to glaciation 445 million years ago when eukaryotic algae became dominant and their large, faster-sinking cells improved the efficiency of the biological pump (Shen et al., 2018). A decrease in ocean productivity due to inhibition of vertical mixing by stronger upper-ocean stratification may slow the flux of carbon to the deep ocean (Behrenfield et al., 2006). Enhancing ocean productivity by fertilization (Martin, 1990; Sarmiento and Orr, 1991; Marinov et al., 2008) or mechanically generated upwelling of nutrients (Lovelock and Rapley, 2007) has been suggested as a way to sequester more CO2 in the deep ocean, but it is hard to determine how much carbon actually sinks to depth, and mechanically driven upwelling would release oceanic CO2 back to the atmosphere. Enhancing ocean productivity may be desirable independently to produce protein to feed an expanding human population, but it will take much more research to determine whether it is a viable method for reducing atmospheric CO2.
Of course, the other well-known effect of ocean absorption of a significant portion of the ever-increasing fossil CO2 will be a lowering of the pH, or acidification of the upper ocean (Doney et al., 2009; see Oceanography volume 28(2), 2015). While ocean acidification does not feed back on climate in any direct way, it does imperil many species, from pteropods at the base of the food chain (Manno et al., 2017) to shellfish and coral reef systems. Reefs are also impacted by warming waters so may be doubly endangered (Hughes et al., 2017; Colin, 2018, in this issue). Humankind depends on protein from the sea for sustenance, so this aspect of the ocean’s role in climate may impact our ability to feed an expanding population (Cheung et al., 2010).
We are all well aware of the higher surface temperatures being caused by the anthropogenic increase in CO2; the global mean temperature is over 1°C above the pre-industrial temperature (NRC, 2010; IPCC, 2013). This, of course, has implications for sea level rise (Bindoff et al., 2007; Church et al., 2013). As noted earlier, the ocean is absorbing much of the added heat, serving to delay the full impact of CO2 on surface temperatures for several centuries. But delaying the warming of the future atmosphere means that the extra heat being stored in the ocean will continue to contribute to sea level rise through thermal expansion. In a sense, the ocean is acting as a planetary thermometer, and sea level is one way to read its temperature. And the increasing ocean temperatures are contributing to the rapid retreat of glaciers in the fjords of Greenland (Straneo et al., 2010) and the retreat of grounding lines in Antarctic ice shelves (Konrad et al., 2018). Ocean thermal expansion and the melting of land-based ice have provided comparable amounts to the observed sea level rise over the past several decades (Church et al., 2013; Watson et al., 2015). Analysis of data and climate models indicates that the impact of anthropogenic greenhouse gases on Earth’s radiation balance contributed little to sea level rise prior to 1950 but explains 72% of sea level rise by 2000 (Slangen et al., 2016). The estimated rate of sea level rise is found to have accelerated during the satellite era, increasing from ~2 mm yr–1 in 1993 to ~3 mm yr–1 in the last few years (Chen et al., 2017; Dieng et al., 2017). Mass losses from the ice sheets and glaciers are providing an increasing fraction of the rise. While this rate is modest for those alive today, the implications for future generations of coastal populations are dire, especially if the rate continues to accelerate. Even if humankind manages to stabilize atmospheric CO2 concentrations, sea level will continue to rise for centuries as “anthropogenic” heat is slowly distributed throughout the ocean.
Summary: It’s the Ocean, Stupid!
This short review of Earth’s heat, water, and carbon budgets shows an overwhelming dominance by the ocean. Without a doubt, the ocean is truly the central player in our climate system. The problem of understanding and predicting climate change represents a significant challenge in observing and understanding the ocean. In the limited space available, all the complex interactions among ocean, atmosphere, cryosphere, and land that lead to variations in our climate on many timescales have not been discussed here, but they are expanded upon in the other articles in this issue of Oceanography.
In any case, a key to understanding any time variable process is adequacy of the data record. Data quality, continuity, sampling frequency, and longevity are all important aspects of understanding cyclic and evolving climate time series (Wunsch et al., 2013). While oceanographers have come late to the climate challenge, we certainly have a strong case for sustained research. The only way we will understand climate is by maintaining our records of continuous ocean observations, preserving the data for future generations, and thoroughly analyzing and modeling the operative processes. This is an intergenerational challenge; our institutions, career paths, and funding mechanisms are not well suited to supporting sustained time series. The pressure for novel results on short timescales often crowds out the careful and continuous observations that we need to understand climate (Baker et al., 2007; Wunsch et al., 2013). We must continue to fight this impulse and find ways to convince young scientists that starting a time series at age 30 will give them a climate record at age 60. This should be a priority of the oceanographic community; data not taken today is lost forever. A proper climate record of Earth’s largest reservoirs of heat, water, and carbon is the least we owe to future generations. The recent report by the National Academies of Sciences, Engineering, and Medicine (2017) recommends the formation of Ocean Climate Partnerships between academia, industry, and philanthropy to find a way to provide the continuity of observations that is absolutely essential to climate research. These could build on the success of ocean research efforts like the Geochemical Ocean Sections Study (GEOSECS), the World Ocean Circulation Experiment (WOCE), and Argo. Oceanographers of all disciplines have a good record of cooperative action to accomplish significant scientific advancements on both the national and international levels. The ocean provides vital services to humankind (Stocker, 2013, 2015) and it is the oceanographic community’s responsibility to increase our understanding of its role in a complex climate system as well as to ensure its proper stewardship for future generations.
With 50 times as much carbon, 1,000 times the heat capacity, and 100,000 times as much water as the atmosphere, the ocean clearly plays a central role in the climate of our planet. Yet the Paris Climate Agreement has only one mention of the word “ocean” in connection with ecosystems (United Nations Framework Convention on Climate Change, 2015). One might think that we live on an ocean-less planet for all the attention it gets. While oceanic records may be short compared to those on land, the need to understand the physics of the Earth system demands a concerted effort to expand and sustain ocean observations. Some years back, a political campaign used the slogan “It’s the economy, stupid!” to focus staff efforts. Progress in understanding our planet’s climate and its changes would be well served by the slogan “It’s the ocean, stupid!”