Full Text
|
|
Introduction
The Pacific Marine Environmental Laboratory (PMEL) conducts global and regional oceanographic research in support of the National Oceanic and Atmospheric Administration’s (NOAA’s) three mission areas: (1) understanding and predicting changes in climate, weather, oceans, and coasts; (2) sharing that knowledge with others; and (3) conserving and managing coastal and marine ecosystems and resources. Since its establishment in 1973, PMEL’s work has ranged from pole to pole and across the global ocean. The lab’s research has examined ocean structure and function in the physical, chemical, and biological realms, and has informed and supported the development of US policy in these areas.
In celebration of its 50 years of scientific public service, this special issue presents PMEL’s past and future science in six broad and interrelated themes that represent much of the lab’s research and innovation: PMEL history, climate, Arctic and ecosystems, ocean chemistry and biology, tsunamis, and innovation and exploration. This introductory paper provides a synopsis of PMEL’s history (Theme 1), and then discusses advances in each of five additional scientific themes in which PMEL has been actively engaged (Figure 1). These themes are broadly overlapping, and much of the research and many of the observations within each theme are relevant for other themes as well; they should not be regarded as fully distinct areas of inquiry but rather as interconnected efforts to better understand our ocean, atmosphere, and Earth system. Figure 1 is organized by these themes, and each milestone is referenced by number and theme within the figure (e.g., “C.1” is the first milestone in the Climate theme) within the figure; these milestones are noted with this coding in the text.
|
|

Theme 1. PMEL Mission, History, and Structure
NOAA was established in 1970 as part of a larger, national inclusion of environmental science in the US government. Initially, NOAA comprised 10 environmental science laboratories that were included in a Department of Commerce agency named the Environmental Science Services Administration (ESSA). One of these laboratories, the Pacific Oceanographic Laboratories, was directed, as recorded in the Federal Register for 1970, to “conduct oceanographic research toward fuller understanding of the ocean basins and borders, or oceanic processes, sea-air and land-sea interactions as required to improve the marine scientific services and operations of NOAA.”
In 1973, that laboratory became the Pacific Marine Environmental Laboratory, and in 1976, the first of its four permanent directors, John Apel, joined its staff. PMEL is currently one of 10 laboratories within NOAA’s Office of Oceanic and Atmospheric Research, and one of three “wet” labs among them that focus on the ocean or the Great Lakes (others focus primarily on atmospheric phenomena and modeling). PMEL’s initial emphases were on water quality in Puget Sound, environmental studies of the Gulf of Alaska and Bering Sea to support federal oil leasing programs, deep-sea mining, and tsunamis. As these and other areas of societal concern have grown, PMEL has risen to meet the challenges posed by extreme events, a changing planet, and more. Specifically, research at PMEL has expanded to include ocean-atmosphere interactions that are critical for understanding climate change, subseasonal to seasonal climate variability and extreme weather, fisheries oceanography, and global patterns and processes of heat and carbon budgets within the ocean.
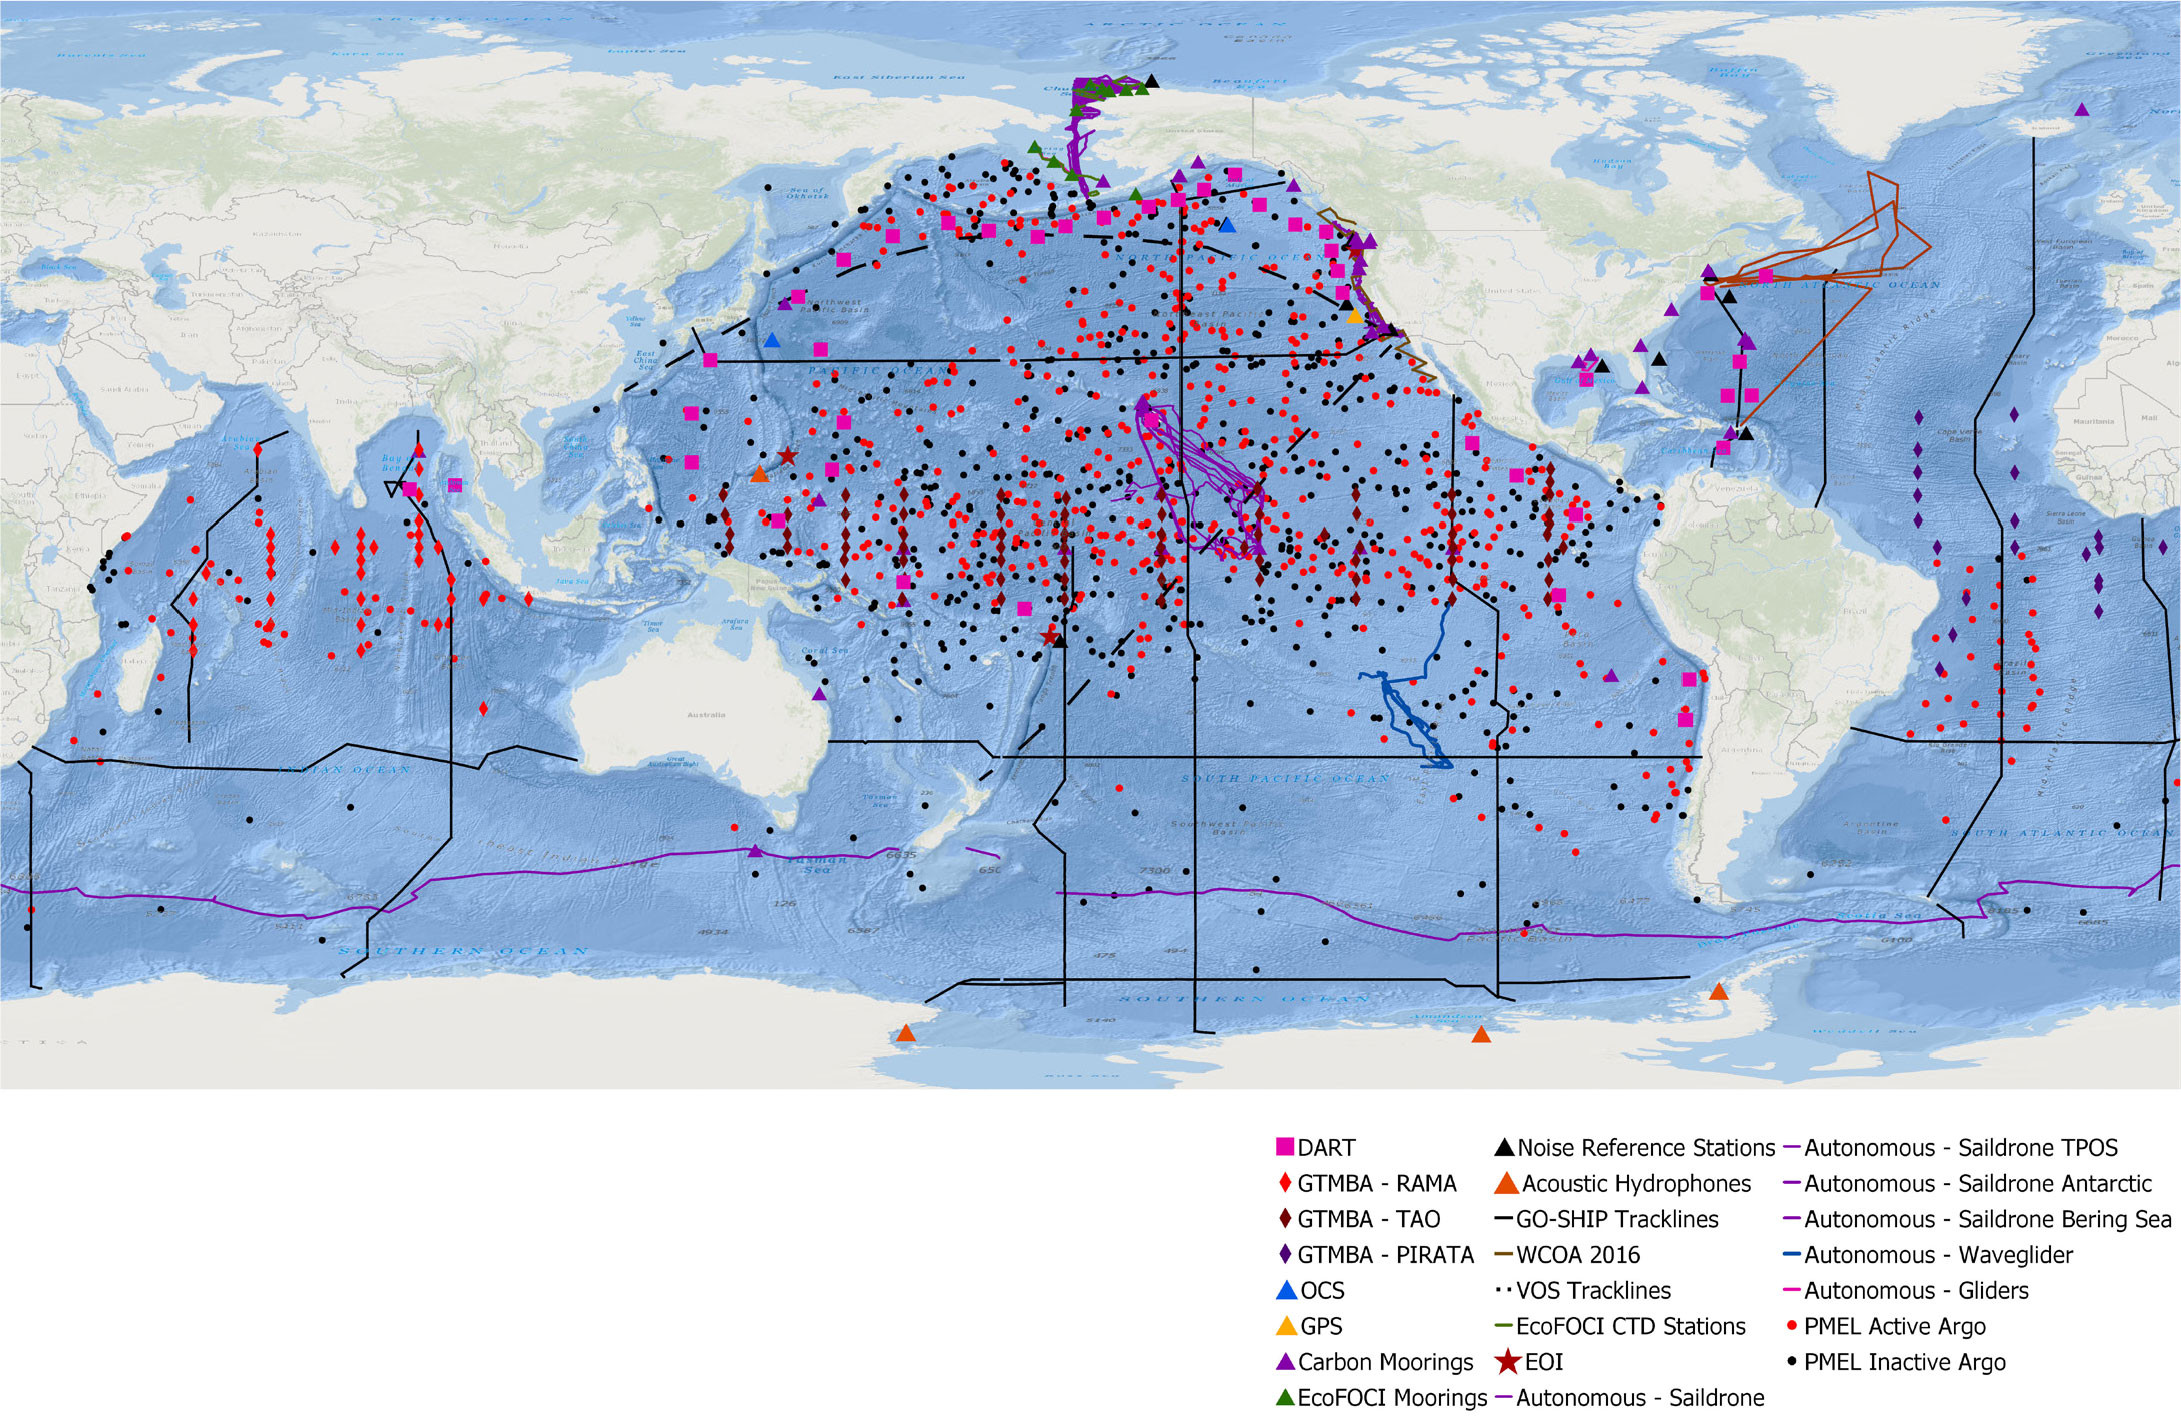
PMEL’s scientific contributions to these arenas are numerous and substantive. Our scientists have published over 100 papers annually in recent years, with a total over the last 50 years of 3,477. These contributions have been cited over 225,000 times as of this writing. One measure of the caliber of our science is the h-index, a common metric of the productivity and citation impact of an individual or an organization. PMEL’s lab wide h-index is 200, meaning that 200 of our publications have been cited at least 200 times. Moreover, only two NOAA scientists currently have h-indices (per Google) that are greater than 100; both of them are at PMEL. The observational data we collect are used in innumerable oceanographic studies. Remarkably, PMEL has executed on average, since 1974, 553 days at sea per year in pursuit of those data; more recently, in the five years before the global pandemic, our scientists and technicians spent an average of 723 days at sea each year collecting data and deploying moorings and other observational technologies. (Note that in this paper, “observations” typically refers to in situ observations, whether shipboard, mooring-based, or from autonomous floats or vehicles; see Figure 2).
|
|
Theme 2: The Ocean’s Role in Climate
Understanding the ocean’s role in natural climate variability and human-caused climate change has been a key area of research for PMEL since the lab was established. Scientists at the lab have investigated both global, long-term phenomena and more seasonal and regional climate patterns, and their work has contributed to our understanding of climate fluctuations around the globe, led estimates of the total excess heat absorbed by the ocean, and more. PMEL’s advances in observing technologies have provided the foundation for these scientific advances.
Improved understanding of the El Niño-Southern Oscillation (ENSO) provides one example of these advances. The ENSO cycle of warm El Niño and cold La Niña events is the strongest year-to-year climate fluctuation on the planet. ENSO originates in the tropical Pacific, but affects patterns of weather variability worldwide, increasing the risk to society from natural hazards such as droughts, floods, heatwaves, wildfires, and severe storms. Improving understanding of drivers of these cycles and supporting climate forecasting requires sustained in situ observations of surface, atmospheric, and subsurface conditions over many decades in portions of the ocean that are very difficult to access; such observations are not practical in academia and are not included in the missions of other government agencies. PMEL established and currently operates sustained climate observations in the tropics, a major driver of global climate variations, and at key climatically sensitive regions in higher latitudes. PMEL also maintains critical long-term observations in the subpolar and polar regions that quantify the impact of changing climate on marine ecosystems (see Stabeno et al., 2023, in this issue).
Motivated by the strongest El Niño event of the century in 1982–1983, which was not predicted and escaped detection until it was nearly at its peak, PMEL took on the challenge of developing an observing system that could support both El Niño research and forecasting. El Niño arises through coupled feedbacks between the ocean and the atmosphere involving massive redistributions of upper ocean heat content in the tropical Pacific from one year to the next (see McPhaden et al., 2023, in this issue). To make the measurements necessary to properly capture the processes leading to El Niño development, Stan Hayes worked with Hugh Milburn and other PMEL engineers to develop the first deepwater buoys and instruments capable of being moored in waters >4,000 m deep in equatorial regions. The expansion of global satellite coverage allowed real-time transmission of data from the air-sea interface and the subsurface ocean (Figure 1, C1). This technology served as the basic building block for the Tropical Atmosphere Ocean (TAO) buoy array that was developed over a 10-year period from 1985 to 1994 as part of the international Tropical Ocean Global Atmosphere (TOGA) program, with 70 moorings spanning the full extent of the tropical Pacific basin (Figure 1, C.2 and C.6, and Figure 2). A partnership with the Japan Agency for Marine-Earth Science and Technology (JAMSTEC) was established in the mid-1990s to transfer TAO technology and help maintain the western Pacific portion of the buoy array with Japanese TRITON (TRIangle Trans-Ocean Buoy Network) moorings. Then, between 2005 and 2007, the management and operation of TAO was transitioned from PMEL research to NOAA’s National Data Buoy Center (NDBC). The TAO project also pioneered the free and open access of near-real-time moored buoy data at the dawn of the internet era through implementation of a graphical user interface on the World Wide Web. Most recently, PMEL scientist William Kessler served as the co-chair of the international Tropical Pacific Observing System effort (Figure 1, C.10) to re-envision observations along the Pacific equator; this resulted in a new array design for NDBC to implement beginning in 2023.
ENSO events are now predictable with up to one year lead times, thanks in part to the availability of TAO/TRITON data for forecast model development, initialization, and validation (McPhaden et al., 2010; Figure 1, C.6). These seasonal forecasts have built on the first successful El Niño forecast in 1986 (Barnett et al., 1988) and are important for agriculture, water management, and similar economic and public management sectors. In fact, economic impacts of ENSO variations have been estimated to be in the trillions of dollars globally for major events (Callahan and Mankin, 2023).
Following the successful implementation of the TAO/TRITON array, the tropical moored buoy program expanded into the Atlantic in the late 1990s with the Prediction and Research Moored Array in the Tropical Atlantic (PIRATA) and into the Indian Ocean in the mid-2000s with the Research Moored Array for African-Asian-Australian Monsoon Analysis and Prediction (RAMA) (Figure 1, C.3 and C.9). Like the tropical Pacific, the tropical Atlantic and Indian Oceans are host to large-scale fluctuations, such as the Indian Ocean Dipole and Atlantic Niños, that have significant regional climatic impacts. Variability in these basins also affects the weather and climate of North America, so advancing our understanding and ability to predict variability in these regions contributes to NOAA’s mission goal of building a climate-ready nation. Crucially, the success of RAMA and PIRATA, as with TAO/TRITON, is underpinned by robust cost-sharing multi-national partnerships (see also Connell et al., 2023, in this issue, for recent challenges due to world events in maintaining these arrays).
The data from the Global Tropical Moored Buoy array has been invaluable in increasing our understanding of the Earth system. It supports marine weather forecasting and seasonal weather and climate predictions. The long time series from the array also provides critical information for understanding climate- and weather-relevant linkages between the ocean and atmosphere and between ocean basins. As one measure of value, data from these three tropical moored buoy observing systems have been used in approximately 2,500 refereed journal publications, with about 1,500 for TAO and TAO/TRITON and the remainder split roughly equally between PIRATA and RAMA.
Building on PMEL’s expertise in deep ocean moorings, in the early 2000s, climate observations moved into the higher latitude North Pacific, and time-series sites were established in the Gulf of Alaska at station Papa (Figure 1, C.4) and off the Japanese coast at the Kuroshio Extension Observatory (KEO). These ocean climate stations are heavily instrumented with meteorological instruments on their surface buoys (see Cronin et al., 2023, in this issue). Sensors attached to the mooring lines measure upper ocean temperature, salinity, and near-surface ocean currents. Sensors mounted on the anchor releases measure bottom water temperature, salinity, and pressure. Climate-related air-sea fluxes are well described in the tropics, thanks to the TAO/TRITON, PIRATA, and RAMA arrays, but the highly dynamic and storm-dominated high-latitude oceans are much more difficult to observe and are not as well understood. In 2007, CO2 sensors were added to both the KEO and the Papa moorings, further increasing the value these observatories provide to the climate community (Figure 1, C.8). These sites have been favored locations for process studies, with many co-located sensors, and have captured air-sea fluxes in high-impact storms including typhoons and atmospheric rivers. Most recently, PMEL has co-chaired the Observing Air-Sea Interactions Strategy, a UN Decade of Ocean Sciences-endorsed program to increase and improve air-sea flux measurements globally (Figure 1, C.13).
In the 1990s, another new technology—the profiling float—revolutionized ocean observations. These floats drift with ocean currents, and move up and down between surface and midwater levels, collecting temperature, salinity, and depth data that is transmitted via satellite each time the float surfaces. Each float can take measurements and transmit data for several years; hundreds of thousands of profiles are provided each year. PMEL was an early adopter of this technology and was actively involved with the development of the global Argo profiling float array (Figure 1, C.5). It was officially initiated in 1999 as a multi-institutional and international collaboration to provide systematic observations of temperature and salinity in the upper two kilometers of the world ocean. PMEL agreed to take on responsibility for about 13% of the global Argo profiling float array of more than 3,000 floats (Figure 1, C.7 and C.11). These floats have increased our ocean interior observations by orders of magnitude (see Johnson and Fassbender, 2023, in this issue). In the same way that satellites revolutionized surface ocean observations and understanding, Argo has provided a previously impossible synoptic picture of the ocean interior and how it is evolving over time. PMEL’s recent deployment of Deep Argo floats (Figure 1, C.12) has further expanded our ability to observe the ocean and contributed to global ocean heat content estimates.
One indicator of the importance of PMEL’s past climate work is the contributions of several PMEL scientists to the Intergovernmental Panel on Climate Change’s efforts, which were awarded the 2007 Nobel Peace Prize jointly with Albert Gore. In addition, Nick Bond, a Cooperative Institute for Climate, Ocean, and Ecosystem Studies (CICOES) scientist affiliated with PMEL until recently, has served as the Washington State Climatologist since 2010. In the future, PMEL will continue its strong emphasis on understanding the ocean’s role in climate processes and climate change.
Theme 3: Arctic Oceanography and Ecosystems
PMEL’s Arctic-related research has had two primary components from its earliest days in the 1970s (Figure 1, A.1). The first includes efforts to look at the Arctic’s role in large-scale climate and weather patterns. The second has been focused on Arctic and Alaskan oceanography and ties to ecosystems, particularly those components most relevant for fisheries.
In the 1970s and early 1980s, one of PMEL’s key Arctic and Alaskan areas of research was in the physics related to the atmosphere and ocean (see Wang and Overland, 2023, in this issue). Oil exploration motivated an initial emphasis and fieldwork on sea-ice prediction and vessel icing. As climate change progressed, however, the lab’s work expanded to include modeling, especially assessment of the behavior of global climate models at high northern latitudes, and eventually, examination of teleconnections between the Arctic and mid-latitude weather and climate. Most recently, it has included the use of flight missions to observe heat flows in the Arctic system (Figure 1, A.12)
PMEL’s work has been used by the Intergovernmental Panel on Climate Change and in other scientific venues, but PMEL scientist James Overland was a pioneer in recognizing the need for readily accessible, up-to-date information about the changes and current status of the Arctic for lay audiences. He led the development of the first Arctic Report Card in 2006 (Figure 1, A.7); this peer-reviewed publication has been produced annually since that time to provide clear, concise information about the current conditions of the Arctic system in comparison with historical records. The most recent Report Card includes annual updates on a set of recurring metrics, a set of indicators visited at a two- to four-year frequency, and emerging topics, including Arctic pollinators, seabird die-offs, and consequences of Arctic change on Indigenous peoples. Over 140 authors, from more than 80 institutions and 11 countries contributed to the 2022 Arctic Report Card.
Another PMEL and CICOES scientist, Kevin Wood, was a leader in bringing historical oceanographic records from Arctic voyages from the US Navy and Coast Guard into the digital era. Harnessing the power of citizen scientists, volunteers were recruited to transcribe logbooks from ships traveling in those regions in the nineteenth and twentieth centuries, providing critical historical in situ data for model validation and reanalysis.
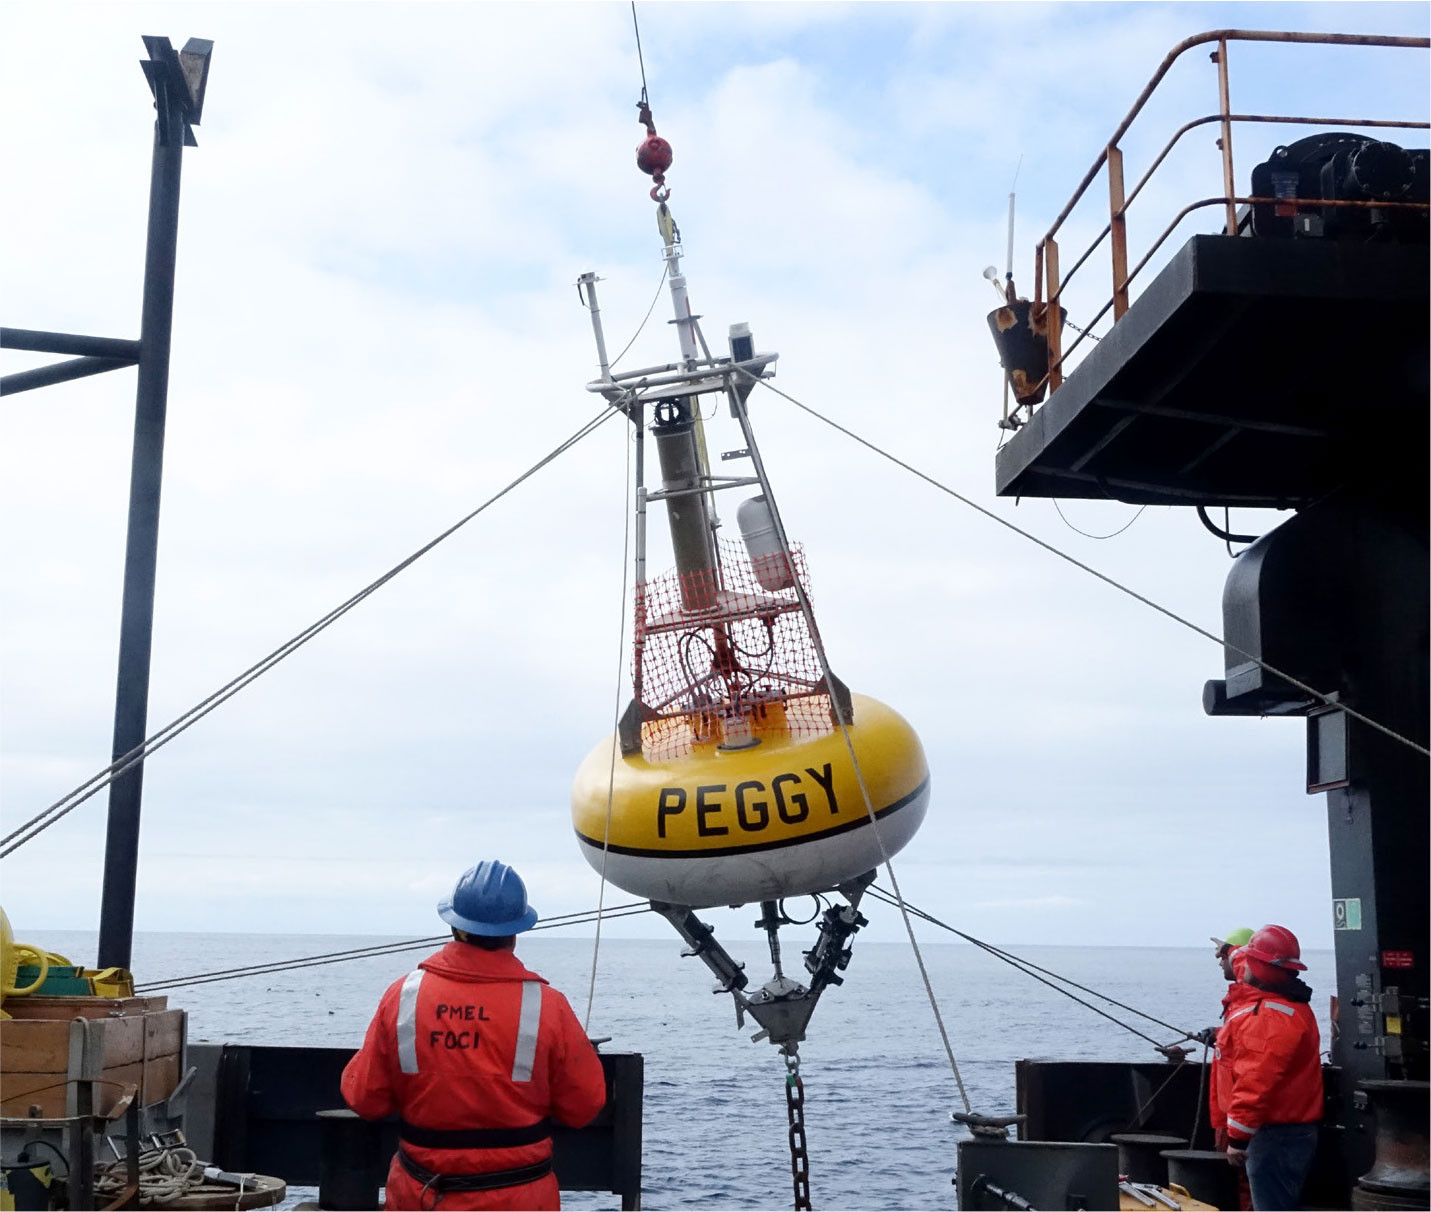
The passage of the Magnuson-Stevens Sustainable Fisheries Act in 1976 set the stage for the other primary area of PMEL’s Arctic and Alaska-oriented research: fisheries oceanography (see Mordy et al., 2023, in this issue). This act required sustainable management of commercial fisheries in US waters, necessitating greater understanding of the entire ecological system—physical, chemical, and biological—supporting those fisheries. The PMEL-Alaska Fisheries Science Center informal partnership that began shortly after PMEL was established in 1973 was formalized as the Fisheries-Oceanography Coordinated Investigations (FOCI) program in 1984 (Figure 1, A.2), with a focus at that time on walleye pollock in the Gulf of Alaska. The program expanded in the 1990s to include regional ecosystem modeling (Figure 1, A.3) and has since provided oceanographic and biological information relevant for shellfish, marine mammals, and Pacific cod and other fishes. PMEL deployed the first of an array of biophysical moorings in the Gulf of Alaska and the Bering Sea in the 1990s (Figure 1, A.4; Figure 3; Stabeno et al., 2016). FOCI uses a combination of fixed moorings, Lagrangian devices, joint scientific cruises, and modeling to identify oceanographic drivers and correlates of recruitment that inform recruitment forecasts for the North Pacific Fishery Management Council and other stakeholders (e.g. Stabeno et al., 2012). It has expanded geographically, now including observations from the Gulf of Alaska, the Bering Sea, and, beginning in 2010, the Chukchi Sea (Figure 1, A.8).
|
|
The long-term time series from this joint project allow detailed understanding of the Alaskan and Arctic ecosystems and the impact of climate on them (Duffy-Anderson et al., 2017; Moore et al., 2018; Stabeno et al., 2019). These time series include nearly 50 years of surveys, and almost 30 years of moored buoy data at site M2 in the southeastern Bering Sea (Figure 1, A.4). This sentinel site has expanded beyond physics to include carbon (Figure 1, A.10), primary production, nutrients, acoustics, and other ecosystem parameters, and has been joined by three additional buoys in the Gulf of Alaska, four in the Bering Sea, and six in the Chukchi Sea. Most recently, environmental DNA sampling has been included in moorings and cruises in this region and has the potential to yield information about how climate change affects biological communities (Galaska et al., 2023, and McAllister et al., 2023, both in this issue).
These time series have proven to be useful for more than fisheries oceanography. During the first decade of this century, prompted in part by change in the Arctic, the program expanded to include climate variability as one object of its study (Figure 1, A.5). In 2004, the FOCI program formally added “Ecosystems” to its name, becoming EcoFOCI, and setting a strong example of science supporting ecosystem-based management (Figure 1, A.6). The program has also served as a testbed for novel technologies (Tabisola et al., 2023, in this issue). Together with PMEL’s engineering program, its researchers have devised wave-powered profilers (Figure 1, A.9), pop-up buoys that can be deployed by community partners and fishermen, and buoys designed to sink shortly before the arrival of ice and then rise after ice retreat in order to extend the observation period at two critical ecosystem transitions (open water to ice, and ice to open water). The program has been recognized in a variety of ways, including the 2021 PICES (North Pacific Marine Science Organization) Ocean Monitoring Service Award. Recently, the EcoFOCI program participated in 2022’s International Year of the Salmon, providing oceanographic observation expertise on an international mission intended to link physical and chemical conditions to salmonid biological status or responses, much as EcoFOCI has already done for walleye pollock and Pacific cod, among other species (Figure 1, A.12).
EcoFOCI’s observations provide critical data to regional ocean modeling efforts (Hermann et al., 2023, in this issue), a service that will continue in the future as NOAA embarks on its new Climate-Ecosystem Fisheries Initiative. This program is designed to provide regular, high-resolution, downscaled information from regional ocean models to fisheries scientists and managers for their decision-support models, including stock assessments.
Theme 4: Ocean Chemistry and Biology
The global ocean has absorbed approximately 26% of the anthropogenic carbon dioxide emitted to the atmosphere. Thus, it is an important carbon sink that plays a key mitigating role in climate change—but also alters ocean chemistry and will potentially affect organisms and ecosystems via “ocean acidification.” In addition, aerosols derived from ocean sources cause global cooling by aiding in the formation of cloud condensation nuclei that prevent heat-generating radiation from reaching Earth’s surface. Thus, providing a better understanding of the ocean’s role in controlling the distributions in the atmosphere of greenhouse gases that cause warming, and aerosols that cause cooling (Figure 4), has been another important element of PMEL’s research since its founding.
|
|

In the 1970s, the lab’s work was primarily focused on the local Puget Sound region, but as NOAA’s national and global roles developed, PMEL evolved to direct its attention to larger regional and global priorities. Although the study of ocean chemistry lies entirely within the missions of NOAA’s Office of Oceanic and Atmospheric Research and PMEL, ocean biological studies needed to be closely coordinated with the National Marine Fisheries Service and other agencies and organizations that include the management of living marine resources in their missions.
In the 1980s, PMEL scientists were the first to show quantitatively the impact of ENSO on the interannual variability of the ocean carbon budget in the Equatorial Pacific (Figure 1, O.1) (Feely et al., 1987). Later studies show that this region is the largest cause of interannual variability of CO2 fluxes in the global ocean, thus having a significant impact on the variability of the global carbon budget between years (Ishii et al., 2014). In this same time period, PMEL researchers conducted the world’s first field measurements of ocean acidification impacts. They showed the direct effect of anthropogenic CO2 on aragonite and calcite saturation horizons in the Northeast Pacific—namely, causing those horizons to rise toward the surface by about 50–100 m, affecting the dissolution of pteropods (e.g. Feely et al., 1984; Betzer et al., 1984).
In addition, PMEL scientists, together with researchers at the NOAA Atlantic Oceanographic and Meteorological Laboratory (AOML), were integral to the development of NOAA’s OACES (Ocean-Atmosphere Exchange Study) program in the late 1980s and early 1990s. OACES involved large-scale oceanographic survey cruises on NOAA ships as a contribution to several international science programs, including the Equatorial Pacific Ocean Climate Study (EPOCS), the Tropical Ocean Global Atmosphere (TOGA) program, the World Ocean Circulation Experiment (WOCE), and the Joint Global Ocean Flux Study (JGOFS) (Figure 1, O.3). These research cruises collected physical and chemical measurements throughout the water column and provided an important asset to the scientific community investigating ocean circulation and carbon cycling.
The OACES program ended in the mid-1990s and was followed by a series of gas exchange process study cruises called GasEx (Feely et al., 2002). The GasEx cruises pulled together the world’s experts on air-sea gas exchange processes in an attempt to directly measure the transfer of key trace gases between the ocean and the atmosphere under differing environmental conditions. These measurements led to an improvement of the algorithms used to estimate the uptake of carbon dioxide from the atmosphere.
Despite numerous twenty-first century technological advances, ship-based hydrography remains, at present, the only method for obtaining research-quality, high spatial- and vertical-resolution measurements of a suite of physical, chemical, and biological parameters over the full water column. One of PMEL’s key contributions to the collaborative global repeat hydrography effort was to develop chemical tracers that are used to age water masses as they move in the world ocean, and thus derive accurate assessments of total carbon uptake (Sonnerup et al., 2008). Early in this century, NOAA teamed up with the National Science Foundation to re-establish a ship-based hydrography program that is essential for documenting ocean changes throughout the water column, especially for the deep ocean below 2 km (52% of global ocean volume not sampled by profiling floats). GO-SHIP (Global Ocean Ship-Based Hydrographic Investigations Program) is still operating today, with PMEL and AOML scientists as major contributors to the program (Erickson et al., 2023, in this issue; Figure 1, O.5).
PMEL and other programs continue to develop autonomous technologies to explore atmospheric chemistry, surface fluxes, and subsurface conditions to complement ship-based surveys and expand our understanding of gas and heat exchange at the ocean-atmosphere boundary (Johnson and Fassbender, 2023, in this issue).
One of the significant findings of the survey cruises conducted in the 1990s was the first data-based estimate of the global distribution of anthropogenic (human-derived) carbon dioxide (CO2) in the ocean (Sabine et al., 2004; Figure 1, O.4) and the associated changes in ocean chemistry that could impact marine calcifying organisms (Feely et al., 2004). The fundamental changes in seawater chemistry from the uptake and storage of anthropogenic CO2 developed into a whole new field of study known as ocean acidification (see Feely et al., 2023, in this issue).
The rapidly emerging scientific issue of ocean acidification (OA) raised serious concerns across scientific and resource management communities as to possible ecological and economic impacts and led to legislation in 2009. The Federal Ocean Acidification Research and Monitoring (FOARAM) Act mandated that NOAA develop an active monitoring and research program to determine potential impacts of decreased ocean pH and carbonate saturation states, which are happening in direct response to rising atmospheric CO2. In response to this legislation, 70 scientists throughout NOAA developed the NOAA Ocean and Great Lakes Acidification Research Plan (2010) to present a consensus research strategy for NOAA to advance understanding of the impacts of ocean acidification and to address related challenges to local and national ecosystems and communities.
Initial appropriations for FOARAM were provided to PMEL and AOML to begin developing an appropriate ocean acidification observing program. A major project for PMEL was to expand the global moored and ship-based networks by adding pH and other biogeochemical measurements to provide important information on the changing conditions in the open ocean and coastal waters. The PMEL carbon group is primarily focused on large-scale observations of ocean interior carbon made during hydrographic cruises and surface ocean carbon dynamics measurements collected using volunteer observing ships, buoys, and other autonomous systems. In addition to these global studies, PMEL scientists also lead the West Coast Ocean Acidification cruise (WCOA), a quadrennial survey of regional chemical and associated physical and biological conditions along the west coast of North America that has shown finer-scale variation in carbon source-sink dynamics as well as interactions with upwelling and other oceanographic processes (Figure 1, O.6)
The NOAA Ocean Acidification Program (OAP) was established as a program within NOAA’s Office of Oceanic and Atmospheric Research (OAR) in 2012 (Figure 1, O.7) to develop a comprehensive approach to ocean acidification research both within NOAA and through partnerships with extramural partners (see Musielewicz et al., 2023, in this issue for one example). PMEL continues to play a major role in the implementation of the OA research plan, though much of its work is still focused on the field-based observations, instrumentation development, biological studies, and modeling that document the evolution of OA in the open-ocean and coastal waters and its impacts on local communities (Figure 1, O.8 and O.11; Feely et al., 2023; Sutton and Sabine, 2023; Alin et al., 2023; Bednaršek et al., 2023; Siedlecki et al., 2023, all in this issue). The 2009 FOARAM Act was reauthorized as part of the CHIPS (Creating Helpful Incentives to Produce Semiconductors) and Science Act in 2022, with additional responsibilities that continue to shape the program’s future directions.
The PMEL aerosols program started off with measurements of dimethylsulfide (DMS) in the early 1980s (Figure 1, O.2) in order to better understand the seawater sulfur cycle and the contribution of seawater DMS emissions to the global atmospheric sulfur budget. These measurements led to a global ocean database of DMS seawater concentrations currently hosted at PMEL with contributions from researchers worldwide. They were pioneering in providing evidence that marine aerosols are a complex mixture of chemical components that climate models need to include to accurately model Earth’s radiation budget (Quinn et al., 2023 in this issue).
PMEL continues its innovative work in ocean and atmospheric chemistry with observational and other advances. To gain even more detailed information about marine-derived aerosols, our atmospheric chemistry group is currently developing autonomous vehicles that can sample aerosols in both cloudy and clear conditions (Figure 1, I.9 and I.17). Our carbon group has partnered with our engineers and Saildrone Inc. to conduct the first autonomous circumnavigation of Antarctica (Sutton et al., 2021; Figure 1, O.9). Our Argo group recently expanded to include a biogeochemical (BGC) component, which began implementing a BGC Argo array in the California Current System in 2020. PMEL now has seven floats in this system (Figure 1, O.10), with five more to come, and is working to produce gridded data products from these floats and build connections with fisheries and ecosystem modelers (see also Johnson and Fassbender, 2023, in this issue).
Finally, PMEL researcher Jessica Cross led the NOAA-wide effort to develop a research plan for the agency for marine carbon dioxide removal (mCDR; Cross et al., 2023; Figure 1, O.12). This is an area of active development, with private companies identifying novel strategies for sequestering carbon and reaching out to NOAA on a regular basis. Our proactive involvement, as well as our ability to observe carbon parameters with a variety of new technologies, will be important to ensure that monitoring ocean carbon can keep pace with progress in this arena.
Theme 5: Tsunamis
Following the Pacific-wide 1960 Chile and 1964 Alaska tsunamis, an agreement was reached between the University of Hawai‘i and a predecessor to NOAA, the US Coast and Geodetic Survey, in 1965 to form the Joint Tsunami Research Effort (JTRE), the first federal organization mandated to conduct tsunami research. In 1973, JTRE merged with PMEL and continued to focus on tsunami research to improve the tsunami warning system and to establish the techniques for determining tsunami hazards to coastal areas. The 1975 Hawaiian tsunami prompted PMEL to design a local system for that region (Bernard et al., in this issue; Figure 1, T.1).
PMEL and the National Science Foundation (NSF) co-sponsored a tsunami research workshop composed of representatives from six federal agencies that resulted in the first tsunami research plan for the United States (Bernard and Goulet, 1981; Figure 1, T.2). An agreement was reached that NOAA would fund tsunami observational research in both coastal and deep water. Deep-ocean tsunami observations became the top research priority, and pilot projects carried out in the Gulf of Alaska recorded several deep-ocean tsunamis using internally logging bottom pressure recorders. In 1991, high-resolution tsunami models were used together with tsunami measurements to study the potential for forecasting tsunami flooding (González et al., 2005).
After a 1992 California local tsunami raised concerns about US tsunami preparedness, the Senate Appropriations Committee directed NOAA to formulate a plan for reducing US tsunami risks. Following three PMEL-hosted workshops, the National Tsunami Hazard Mitigation Program (NTHMP), a state/federal effort, was formed (Bernard, 1998), and PMEL’s then-director, Eddie Bernard, was elected as its first chair. PMEL received research funding to develop tsunami detection buoys (Bernard and Meinig, 2011; Figure 1, T.3) and produce tsunami flooding forecast capability (Titov et al., 2005; Figure 1, T.4). The first DART (Detection and Reporting of Tsunami) buoy pilot array was deployed in 1995 (Figure 1, T.5).
These two rapid technological advances were possible because observational engineering and flooding modeling were under one roof. PMEL engineers pioneered the technology for measuring deep-ocean tsunamis by sensing a pressure change at the seafloor, transmitting these data acoustically to a surface buoy about 4 km away, and retransmitting these data via satellite to tsunami warning centers before the tsunami floods the coastline. PMEL scientists developed and verified numerical models that used these deep ocean measurements as initial conditions for flooding forecast models. The application of these two technologies gave the world a tsunami forecasting capability.
In 2003, PMEL’s DART technology transfer to NOAA’s National Data Buoy Center (NDBC) was recognized by a Department of Commerce Gold Medal for both organizations (Figure 1, T.6). The flooding modeling technology was validated for long-term forecasting to produce hazard maps for coastal communities in the United States. With tsunami hazard maps and other preparedness criteria, NTHMP invented the “Tsunami Ready” program to prepare coastal communities for the next tsunami.
The horrific December 26, 2004, Indian Ocean tsunami, which killed over 230,000 people and displaced 1.7 million across 14 countries, stimulated governments of the world to address tsunami hazards. PMEL was instrumental in providing technical input for passage of the 2006 Tsunami Warning and Education Act (Public Law 109-424) that expanded the efforts of the NTHMP. The Tsunami Act emphasized research that embraces the concept of tsunami resilience—the ability of a community to quickly recover from a tsunami. High demand for modeling technology led to PMEL-developed web-based modeling tools to provide fast development options for shared tsunami modeling, forecast, and hazard assessment projects around the world. These tools have been used by hundreds of scientists for model development and by several countries for tsunami forecast development (Bernard and Titov, 2015).
In 2007, DART technology was also patented and licensed by PMEL to meet the needs of the international community (Figure 1, T.7). DART licensee Science Applications International Corporation (SAIC) has manufactured over 65 buoys for eight different countries. For more details on these transfers, see Titov et al. (2023, in this issue).
The 2011 Japanese tsunami tested the first real-time tsunami flooding forecast for Pacific coastal communities in the United States. The propagation forecast was used to set initial conditions for high-resolution flooding model runs for 32 coastal communities in the United States, resulting in warnings and evacuations in Hawai‘i (Tang et al., 2012). The forecast of flooding in Hawai‘i was validated by later observations and surveys, showing that accurate tsunami flooding forecasts were possible (Figure 1, T.8).
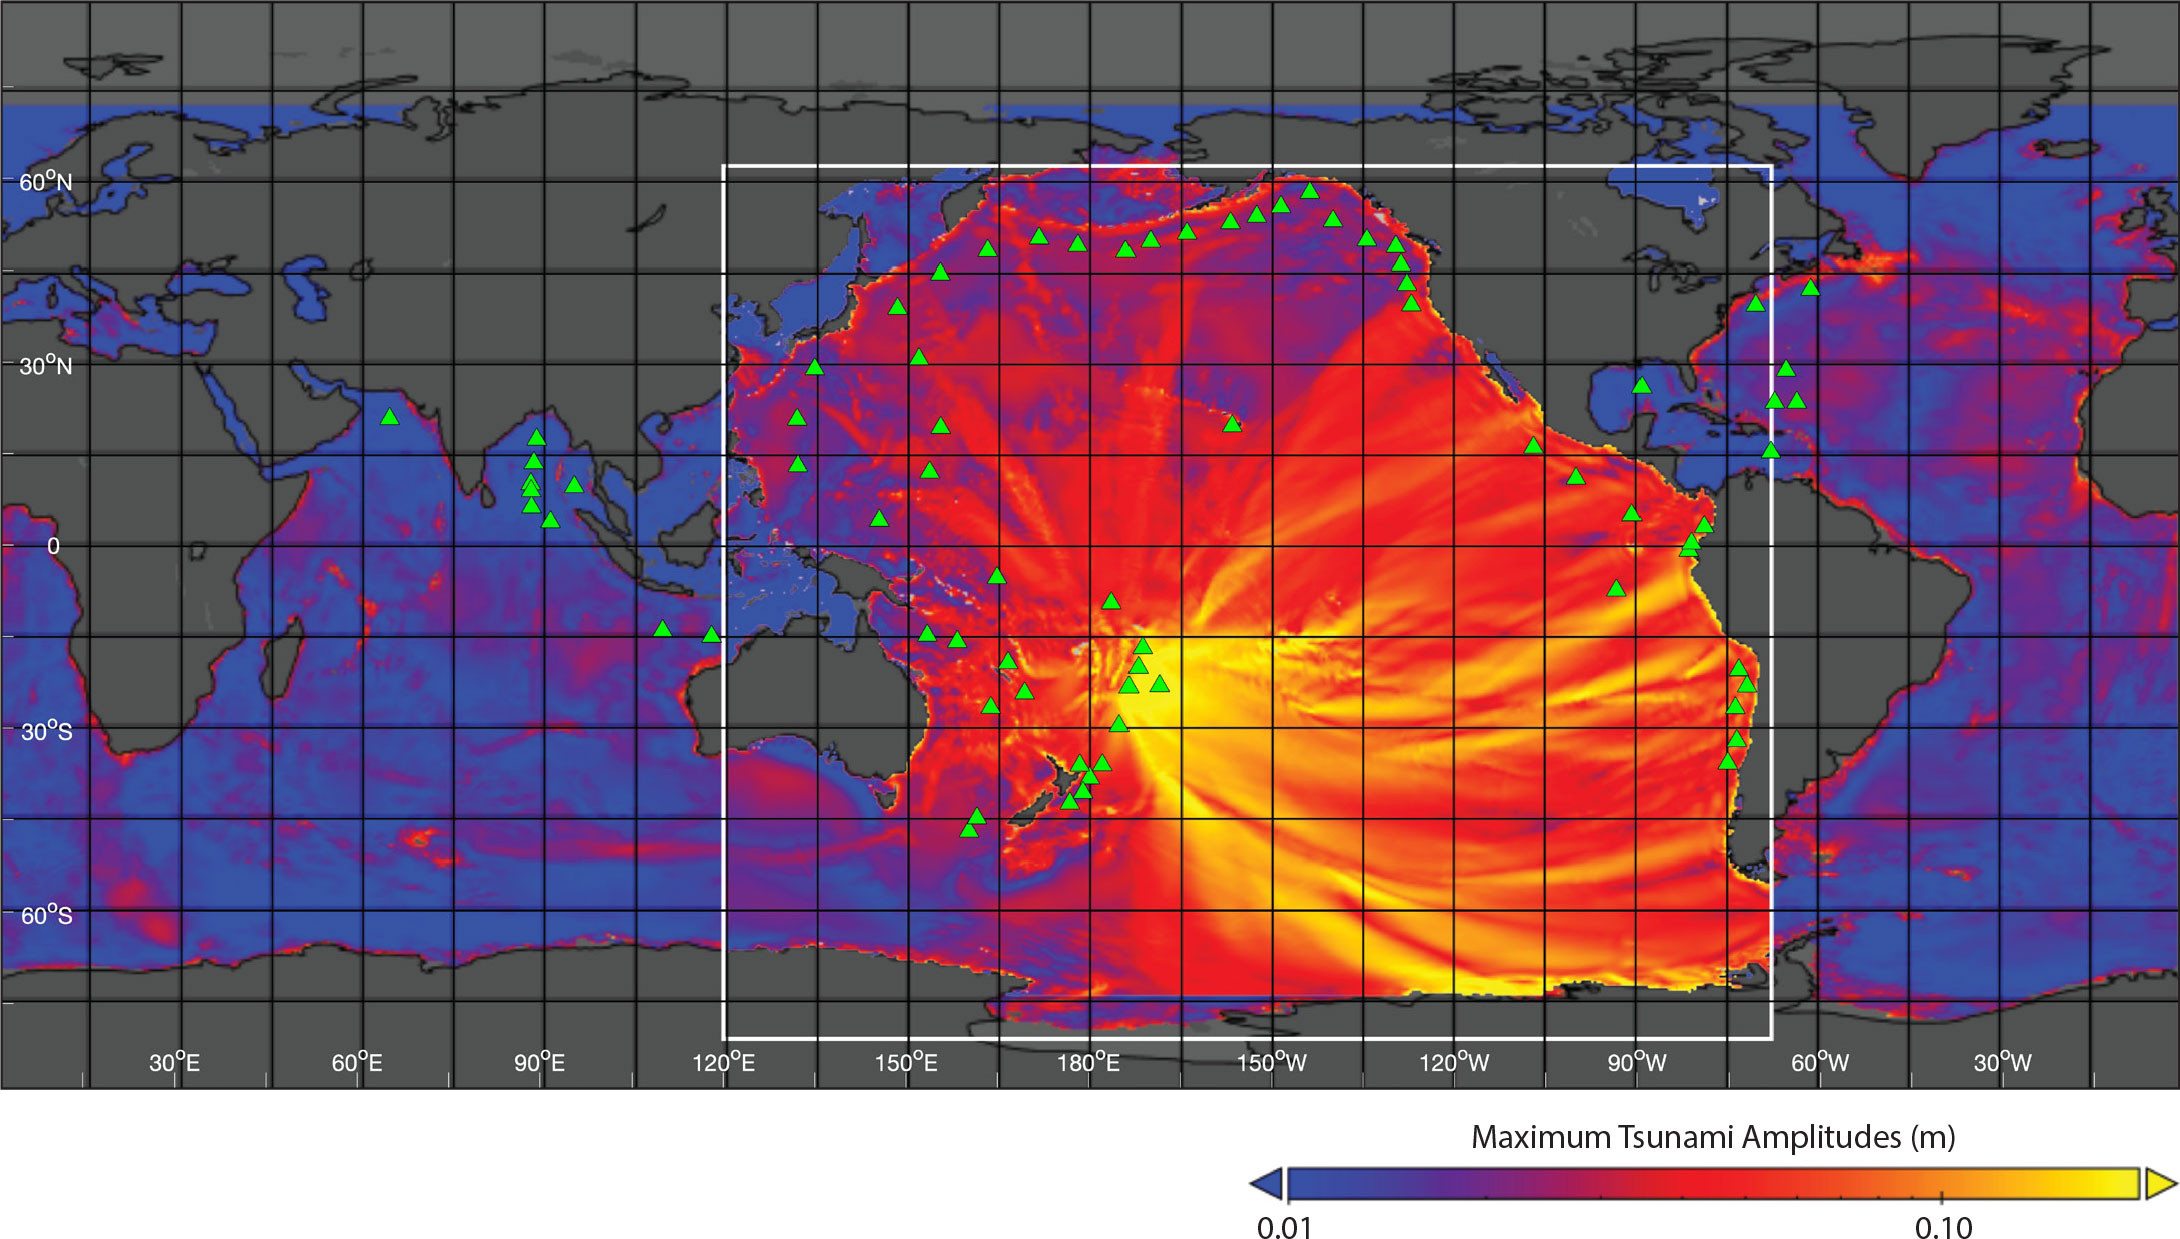
By 2015, PMEL had created a web-based product for real-time flooding forecasts. The product, named Tweb (Figure 1, T.9), provides a back-up system for tsunami warning operations and access by countries without flooding forecast capabilities. Figure 5 provides an example of the product forecast for the 2022 Tonga volcanic eruption.
|
|
Through collaboration with the American Society of Civil Engineers (ASCE) tsunami loads and effects subcommittee, PMEL developed a simplified method for modeling a probabilistic tsunami inundation for a study site. PMEL developed the Tsunami Design Zone maps for all coastlines of the five Pacific states for the ASCE tsunami provision (Wei et al., 2017; Figure 1, T.10).
By 2017, PMEL had successfully transferred the PMEL flooding forecast system to NOAA’s warning centers, and scientists received a Department of Commerce Gold Medal recognizing this transformative accomplishment. By 2022, PMEL’s fourth generation (4G) tsunami technology was in use globally (Figure 1, T.11). Today, 72 DART stations operated by eight nations provide real-time tsunami data required to drive models that forecast tsunami flooding. In addition, Tsunami Ready has been adopted by the Intergovernmental Oceanographic Commission (IOC) as the global standard for preparedness for an at-risk population of over 890 million people. IOC’s Ocean Decade efforts are underway to make all tsunami-threatened communities Tsunami Ready by 2030.
PMEL tsunami research continues to improve the speed and accuracy of flooding forecasts. We achieved a tenfold increase in forecasting speed by incorporating graphics processing unit (GPU) acceleration, and are also increasing model speed by incorporating the DART 4G technologies and outputs in our models. Our next challenge is to incorporate artificial intelligence in our models (Figure 1, T.12–T14) as we continue to provide society with warning systems that produce flooding forecasts and preparedness systems that will save lives and communities from future tsunamis.
Theme 6: Ocean Exploration and Innovation
Exploration
PMEL began building its expertise in seafloor research in the 1970s (Figure 1, I.1). These capabilities, coupled with NOAA’s access to the first US civilian multibeam mapping sonar technology, led to the discovery of seafloor hydrothermal venting along the volcanically active seafloor spreading centers in the Northeast Pacific. This discovery provided the impetus for establishing the NOAA Vents Program, with an overarching objective to understand the regional physical, chemical, and biological ocean environmental impacts that are the consequence of seafloor volcanic and hydrothermal activity (Hammond et al., 2015).
In 1983, NOAA made a strategic decision to narrow the focus of Vents research from global to regional and, specifically, to prioritize exploration of the active venting in the caldera of a large submarine volcano, Axial Seamount, located about 300 nm off the central Oregon coast and to headquarter the program at PMEL. Within a decade, Vents scientists had located all the active Juan de Fuca and Gorda hydrothermal vents (Figure 1, I.7) and discovered the first “megaplume,” revealing that hydrothermal venting was not simply steady state but rather a product of episodic seafloor eruptions (Figure 1, I.2; Baker et al., 1987). One of the most intriguing results from the analyses of hydrothermal vent fluids was the discovery that they commonly contain extremophiles, microscopic bacteria-like organisms (Archaea) that thrive at temperatures exceeding 100°C (Figure 1, I.4). These organisms produce enzymes and metabolites that have significant potential for biotechnical and pharmaceutical applications. The Vents team also completed the first multibeam sonar mapping of an entire oceanic plate (Figure 1, I.3).
In 1993, PMEL obtained real-time access to data from the Navy’s anti-submarine warfare Sound Surveillance System hydrophone arrays and established what was to become a unique 20-year effort to monitor Northeast Pacific spreading centers for earthquakes, volcanic eruptions, and any coincident marine mammals (Dziak et al., 2011). With acoustic monitoring having been active for only three days, the arrays detected the commencement of a volcanic eruption on a small spreading center segment immediately north of Axial Seamount. This was the first time an active deep-ocean eruption, the most common volcanic eruptions on Earth, had ever been detected and located (Figure 1, I.6). PMEL scientists immediately responded to the eruption and established the first in situ, long-term underwater volcano monitoring program: the New Millennium Observatory (NEMO). In 1998, Axial Seamount erupted again. With NEMO data and ship observations, Vents scientists had, for the first time, directly measured the geological and thermal characteristics of a deep-ocean eruption and returned seafloor images in real time (Fox et al., 2001). The successes of the Vents Program and NEMO inspired the establishment of a fiber-optic cable network at Axial Seamount that is part of NSF’s Ocean Observatories Initiative for which PMEL’s engineering program built several cabled instrument nodes (Stalin et al., 2000).
Successful acoustic detection of underwater eruptions led to PMEL’s development of autonomous hydrophone and mooring systems for acoustic monitoring of the global ocean. Data from these hydrophones have led to the acoustic monitoring of Antarctic seas in 2005, discovery of a contemporary population of North Atlantic right whales in 2010, creation of the NOAA-National Park Service Ocean Noise Reference Network in 2014 (Figure 1, I.10), and the first long-term measurement of ambient sound in the Challenger Deep, Mariana Trench in 2015. (Dziak et al., 2011; Figure 1, I.11). The lab continues its work characterizing ambient sound, with a particular focus on impacts to marine mammals to this day (Dziak et al., 2023, in this issue).
Building on the successes at Axial Seamount, the Vents program established a multitude of collaborations with researchers from around the globe and expanded the program to include exploration along the East Pacific Rise and the Galápagos spreading centers. In 1999, the lab embarked on systematic surveys along volcanic arcs and back-arc basins of the Mariana subduction zone. The 2003–2006 Mariana exploration campaign led to notable discoveries including (a) the first direct observations of an active deep volcanic eruption, (b) discoveries of multiple new species of hydrothermal vent organisms, and (c) the discovery of CO2 venting from a single small, young submarine arc volcano on a scale equivalent to about 0.1% of the carbon flux from the entire global mid-ocean ridge (Embley et al., 2007). The Mariana exploration campaign led to establishment of the Volcano Unit of the Mariana Trench Marine National Monument in 2009.
In the mid-1990s, Vents recognized an untapped resource: the many US and foreign vessels that were collecting petrological samples along spreading center ridges and arcs but that were not collecting data in the water column. PMEL engineers, in collaboration with Vents researchers, developed a simple plume sensor, the Miniature Autonomous Plume Recorder (Figure 1, A.5), which allows any researcher using any wire lowered to the seafloor—such as rock cores, dredges, side-scan sonars—to explore for hydrothermal activity at no cost to the primary cruise objectives (Walker, 2023, in this issue). Using these extra data, maps of the global distribution of hydrothermal plumes and oceanic hydrothermal vent fields were created by 2004 (Beaulieu et al., 2013). These studies led to the 2015 discovery that hydrothermal venting is a significant upper-ocean source of a critical nutrient, iron (Resing et al., 2015).
In 2016, the lab began a systematic exploration for methane seeps along the Cascadia Margin, which extends along the coasts of northern California, Oregon, and Washington (Butterfield et al., 2023, in this issue). The outcome was the discovery of thousands of active methane bubble plumes clustered in more than a thousand localized sites. Methane is a potent greenhouse gas and its unexpected prevalence in the Cascadia Margin water column raises questions about its role in fisheries habitat, ocean acidification, slope stability, whether significant quantities of methane escape into the atmosphere, and how all of these impacts and processes may be affected by ocean warming (Merle et al., 2021).
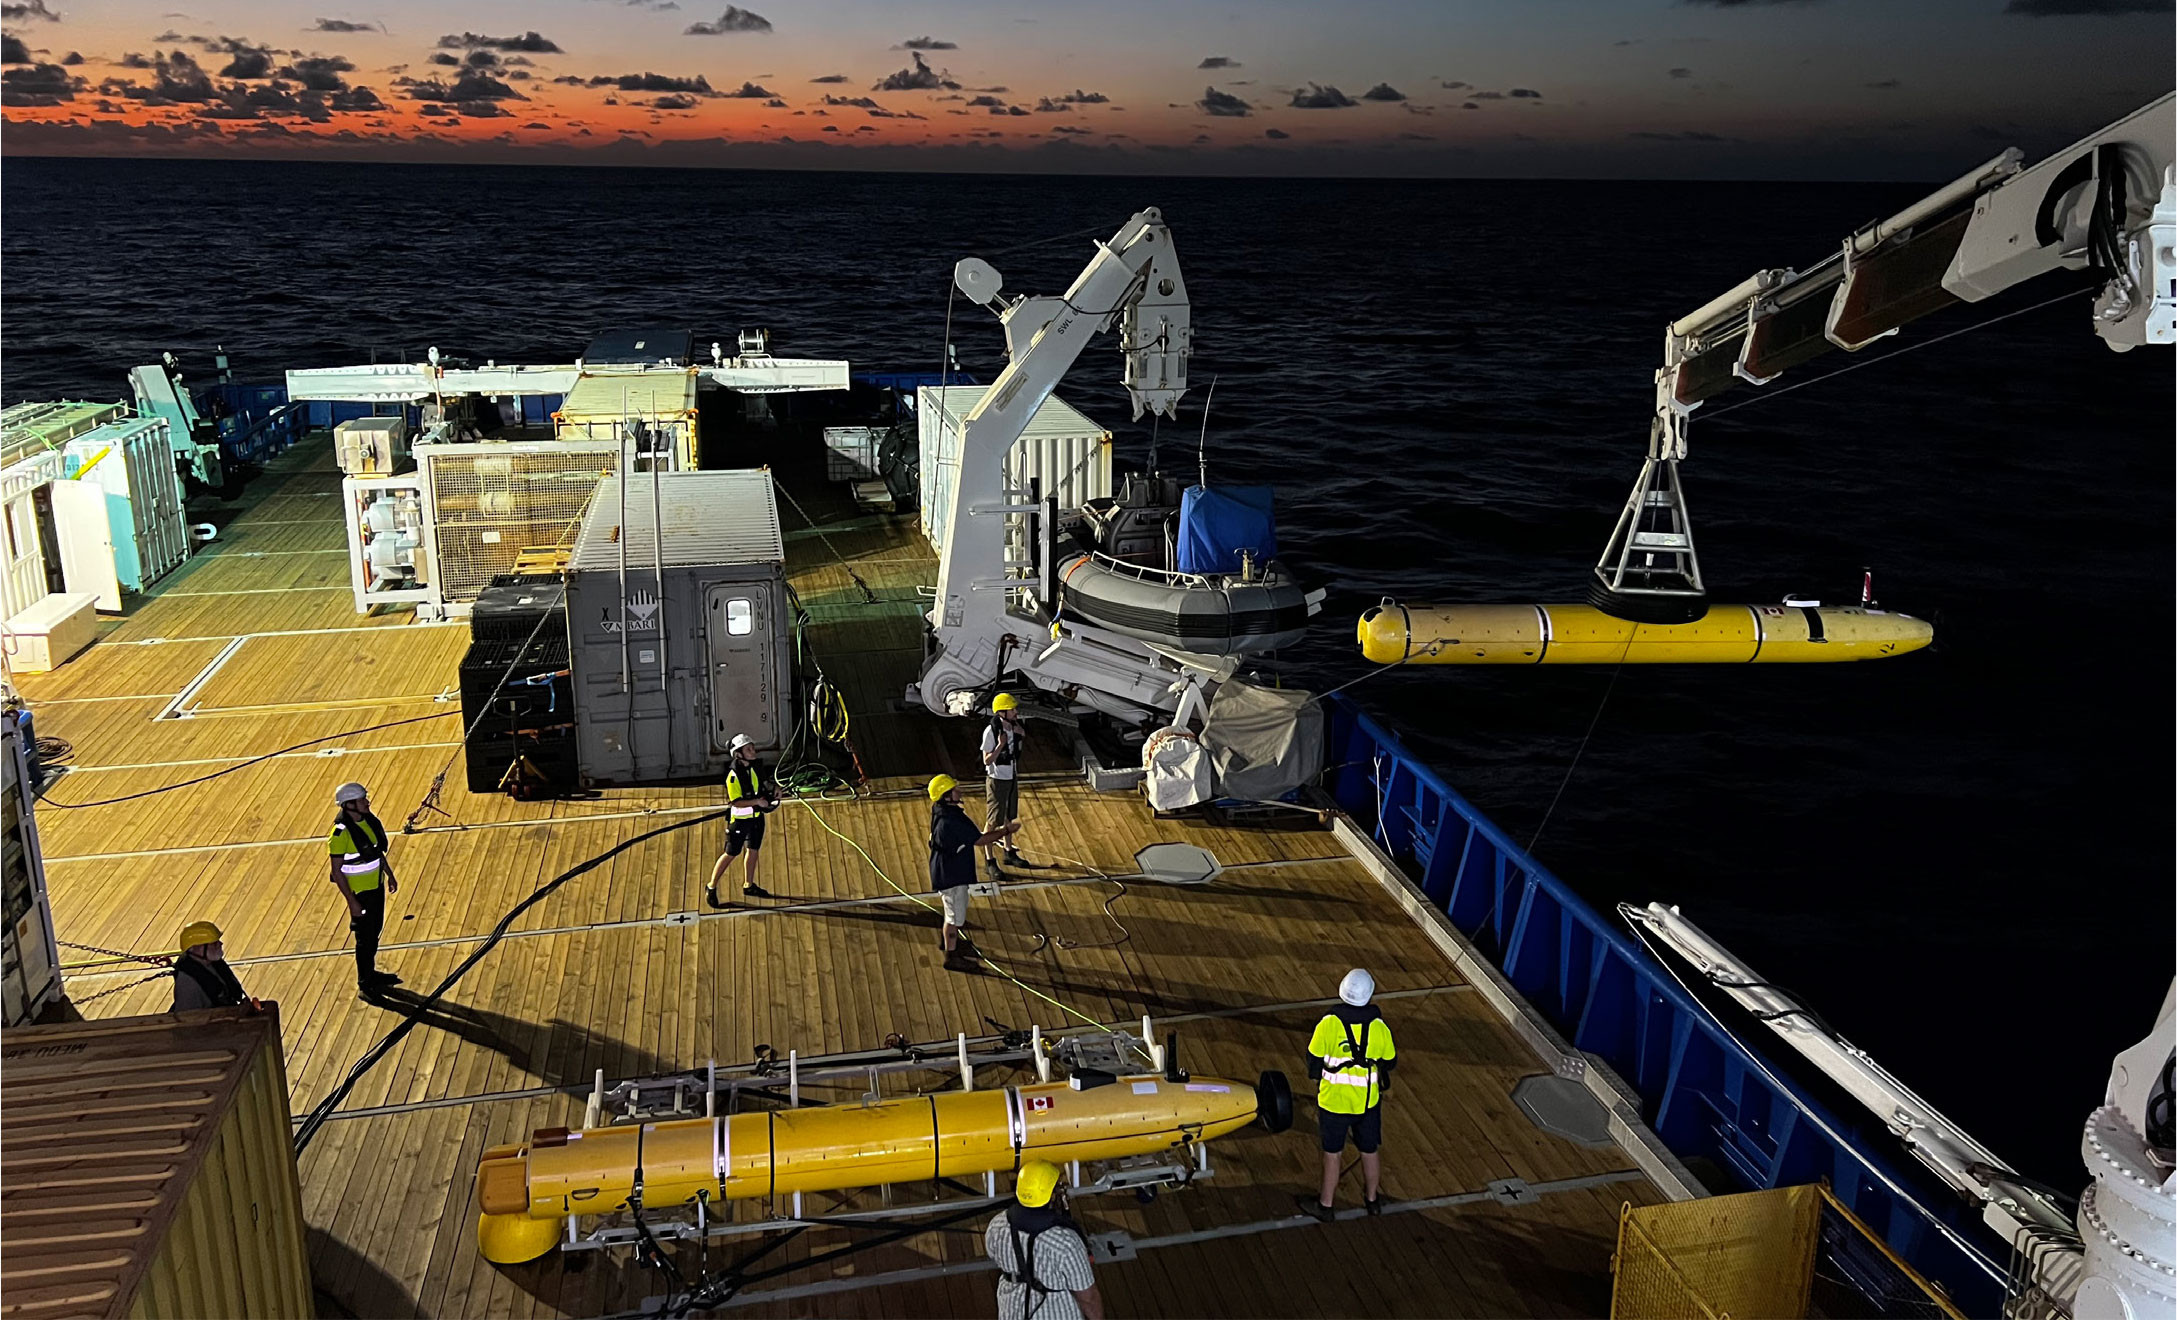
Most recently, in 2023, during an expedition to the Mid-Atlantic Ridge that was the first operational cruise (Figure 6) of the Schmidt Oceanographic Institute’s new research vessel Falkor (too), PMEL scientists discovered extensive high-temperature vent fields, thus substantially adding to understanding of the volcanic and hydrothermal oceanographic impacts of this largely underexplored ridge (Figure 1, I.15).
|
|
Innovation
PMEL’s Engineering Division has supported the lab’s research efforts with technological developments in observing systems and sensors since the founding of the division in the early 1970s by Hugh Milburn. Key to PMEL’s technology development is close collaboration with scientists to produce original approaches to observing ocean and atmospheric conditions in varied and often unforgiving marine environments; the reverse is also true—many of PMEL’s scientific advances have been enabled by the novel observation technologies developed by the engineering division. The division uses a process of prototype manufacturing and rigorous testing that gives researchers confidence that new systems are thoroughly tested and refined prior to scientific deployment.
Many of the specific technological advancements have already been described (see previous themes); here we present several additional particularly important or especially promising developments.
Advancements in mooring technology expanded PMEL’s ability to gather high-quality data at any ocean depth. Hugh Milburn’s implementation of many relatively small (~35 cm) airfoil-like attachments on the mooring line in the upper 200 m of the ocean reduced drag from strong equatorial currents. This enabled the first-ever deep-sea equatorial moorings. In fact, PMEL was granted a patent for a “Mooring Line for an Oceanographic Mooring” (US 7,244,155) in 2007. The development of inductive, acoustic modem, and satellite communications, coupled with innovations in low-powered microelectronics, supported real-time or near-real-time transmittal of data from buoys across the global ocean and in harsh and unforgiving environments. PMEL’s patent for “System for Reporting High Resolution Ocean Pressures in near Realtime for the Purpose of Tsunami” (US 7,289,907) in 2005 was an outcome of these kinds of developments. Together, these technological advancements revolutionized our understanding of ocean processes and enabled ENSO and tsunami forecasts.
More recently, PMEL engineers developed a system for acquiring temperature and salinity profiles, as well as other continuous measurements across depths, by using wave energy to power a “profiling crawler” or Prawler (Stalin et al., 2023, in this issue; Figure 1, I.8). The profiler samples as it descends the mooring line, transmitting its data through an inductive coupling, and then uses the movement from waves to crawl back up the line with a ratcheting mechanism. This instrument has been deployed in the Arctic and the tropics and was transferred to McLane Labs for commercial production in 2019 (Figure 1, I.13).
PMEL established a Cooperative Research and Development Agreement (CRADA) with Saildrone Inc. in 2014 to refine the autonomous, wind- and solar-powered drone they had developed for oceanographic observation (Figure 1, I.12). Over the last decade, our engineers and scientists have worked (and are working) with the company to deploy the vehicle in the Arctic, the Antarctic (Zhang et al., 2023, in this issue; Figure 1, O.9), and the tropics, as part of the TPOS implementation. We are currently also collaborating with Saildrone Inc. and AOML to deploy the vehicle in hurricanes; in 2022, we were able to gather the first observations and video at the air-sea interface at the eyewall of a Category 4 hurricane (Figure 1, I.16).
Our technological advancements have been adopted by other oceanographic researchers around the globe, and have been recognized with numerous Department of Commerce Gold and Silver Medals, Technology Transition Awards, and a Ron Brown Excellence in Innovation Award.
Importantly, obtaining and managing the data acquired with these new technologies requires its own innovations. As satellite and telecommunications infrastructure has improved, PMEL has been able to take advantage of more near-real-time data delivery. Our data management group has developed data acceptance, verification, and data delivery infrastructure that has allowed moored and other observing platforms to transmit data in near-real time to PMEL (see also Burger et al., 2023, in this issue). Data integrity is a key component of such processes, and PMEL has simplified transmittal processes to reduce opportunities for data corruption. With Saildrone Inc., we have been an early adopter of the acquisition of in situ commercially acquired data—the fully automated workflows PMEL has developed have accepted millions of such observation records from commercial vendors, and they are coupled with lab-developed data integrity verification software. We are also developing a new approach to data quality control that uses machine learning, and that will be integrated into those systems. In addition to accepting these data, the data group developed processes to improve the efficiency of data distribution on the operational World Meteorological Organization’s Global Telecommunication System (GTS). Dissemination of data from PMEL observing systems on the GTS further expands the societal value of these data by making them available to global modeling centers.
Conclusions: PMEL in the Next 50 Years
The world’s climate is changing at a pace far more rapid than was anticipated as little as 10 years ago (IPCC, 2023). PMEL has key components of the tool set necessary for humans to address that change, and indeed, in areas such as marine carbon dioxide removal and evaluating the ecosystem impacts of ocean acidification, we are already serving as pioneers and eager collaborators. As we move forward, we will need to be nimble enough to adopt new techniques, such as artificial intelligence and bioinformatic and genomics tools, into our everyday work. More importantly, we will need to imagine the future needs of our scientific enterprise for observation, analysis, and interpretation to continue our cutting-edge work in obtaining the best, most reliable, and most economical measurements of the world ocean and producing information from those measurements of great importance to society.
Two key components of PMEL’s operations—its role as a federal government laboratory and its wide range of partnerships—will continue to be important in producing that scientific benefit for society. First, federal government laboratories such as PMEL fill a unique role in the scientific world that is particularly relevant today. Federal research in general can sustain long-term observations that are less easily supported on the one- to five-year funding cycle that is typical within the academic community. Such long-term time series of environmental conditions in our ocean and atmosphere can provide information about baseline conditions and trends—a necessary component of understanding the changes in the Earth system. They also provide the basis for fully characterizing processes within and between the ocean, atmosphere, and solid Earth. In addition, technological advances made in government labs tend to increase the rate of innovation outside the government in non-overlapping technological areas and in inventions that result in greater than incremental change (Shin et al., 2022). PMEL has been a leader not only in making its long-term data publicly available but also in transferring technology to the private sector and partner institutions.
Second, the laboratory is immeasurably stronger for its close work with other institutions and organizations. The full range of scientific collaborators in PMEL’s work spans the globe and crosses atmospheric- and oceanographic-related disciplines. Our work with agencies that have decisional responsibilities, both within NOAA and within the US states of Washington, Oregon, Alaska, and California, have ensured that the highest-quality physical and chemical oceanographic research has been incorporated into ocean management decisions. Of particular note in the realm of partnerships are three types of close relationships that have been especially critical in achieving our goals: the NOAA cooperative institutes, the OAR program offices and laboratories, and several public-private partnerships. The cooperative institutes have provided us the ability to easily collaborate with and use the tremendous resources of US research institutions; PMEL has been particularly indebted to the Joint Institute for the Study of the Atmosphere and Oceans at the University of Washington, and its new form as a consortium named the Cooperative Institute for Climate, Oceans, and Ecosystem Studies (CICOES) that includes University of Alaska Fairbanks and Oregon State University; the Cooperative Institute for Marine Ecosystem and Resource Studies (CIMERS) at Oregon State University; and the Cooperative Institute for Marine and Atmospheric Research at the University of Hawai‘i. The OAR programs provide leadership and funding for national-level priorities and activities across laboratories; our ocean and seafloor observations, climate, atmospheric aerosol, and Arctic research has benefited tremendously from this coordination. Finally, public-private partnerships have enabled the development and commercialization of innovative technologies such as autonomous vehicles and novel marine sensors; these have brought benefit to both the government and the private entities with which we engage. Several of these partnerships are described more fully throughout this special issue.
PMEL’s role in oceanographic research is especially important today, as we face changes in our climate and our ocean that are unprecedented in human history. These changes also force us to confront the challenge of helping the world respond effectively to alterations in the ocean’s role in regulating the global climate system. Critically, the urgently needed responses and resilience cannot be achieved without better understanding Earth’s physical, chemical, and ecosystem processes—an understanding that PMEL is uniquely poised to provide. As we advance into our next 50 years, PMEL will continue to seek the areas of highest scientific impact to support a predictable, safe, and healthy ocean, sustained for future generations as our planet changes.