Full Text
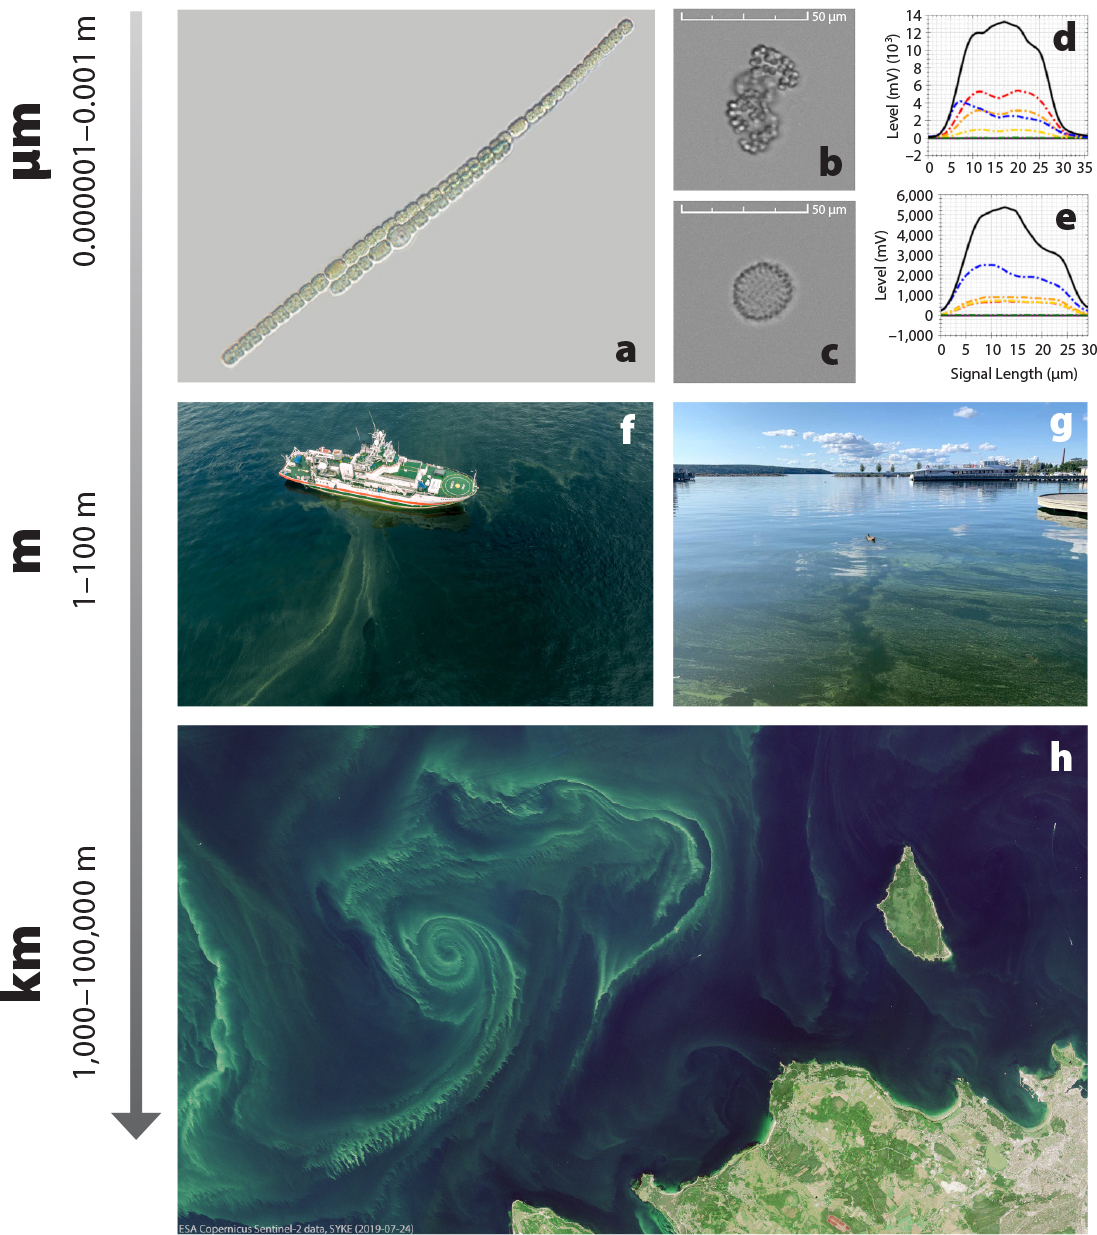
Microscopic cyanobacteria, or blue-green algae, are found in a wide range of aquatic environments (freshwater, brackish, and marine). They can create a nuisance due to biomass accumulation and the production of toxins, which can be harmful to humans and other animals. Cyanobacteria exist in a variety of sizes and shapes (Figure 1a–c), and their blue-green coloration (some species are reddish) is attributed to the presence of phycobiliproteins that are the primary light-harvesting pigments for their photosynthesis and that are auto fluorescent (Figure 1b–e).
|
|
When the reactive forms of nitrogen needed by all primary producers for growth are not available in the water, some cyanobacteria can convert free nitrogen (N2) into more reactive nitrogen forms (nitrogen fixation) to sustain themselves in conditions that would not support most algal growth.
Blooms of cyanobacteria are a known issue in many parts of the world. In the Baltic Sea they are commonly observed during summer, when biomass accumulations can cover large areas (Figure 1h). Although more than 200 species have been reported, Baltic bloom formation is mainly attributed to a few filamentous species (Figure 1a). As one of the largest brackish water bodies in the world, the unique Baltic Sea environment is sensitive to climatic and anthropogenic stressors, such as the excess nutrient loads that result from human activities and lead to eutrophication.
During summer, when reactive forms of nitrogen are scarce, the growth of cyanobacteria is favored by their capacity for fixing N2, by high inorganic phosphorus concentrations in the waters, and by increasing water temperatures. Inefficient zooplankton grazing results in the accumulation of cyanobacteria and affects how nutrients, matter, and energy flow in the environment.
Increased cyanobacteria biomass and surface accumulations serve as indicators of Baltic Sea health. Accumulated cyanobacteria biomass often negatively affects recreation and fisheries, as it can not only be aesthetically displeasing but also poses a real threat for humans and domestic animals due to the potential toxicity. Thus, the detection of cyanobacteria blooms in the Baltic Sea is of paramount importance to the environment, aquatic resources, and human health, and it is needed to manage mitigation.
Systematic observations of cyanobacteria in the Baltic Sea constitute one part of monitoring activities for the larger phytoplankton community that provide environmental quality indicators for the region. Baltic Sea phytoplankton monitoring began in Finland in 1979, with observations limited to 12 offshore locations that were sampled with a research vessel. The phytoplankton monitoring network was expanded to coastal areas in the early 1990s, and today the phytoplankton monitoring network includes 121 locations in waters around Finland (Figure 2a). Phytoplankton cells larger than 2 µm, including cyanobacteria, are counted and identified using quantitative microscopy, employing the only method that is based on international standards in order to allow comparison of data between countries and provide a basis for implementing new methods. However, this method requires samples to be fixed and an expert for species identification, and it is time consuming (analysis of each sample takes a few hours).
|
|
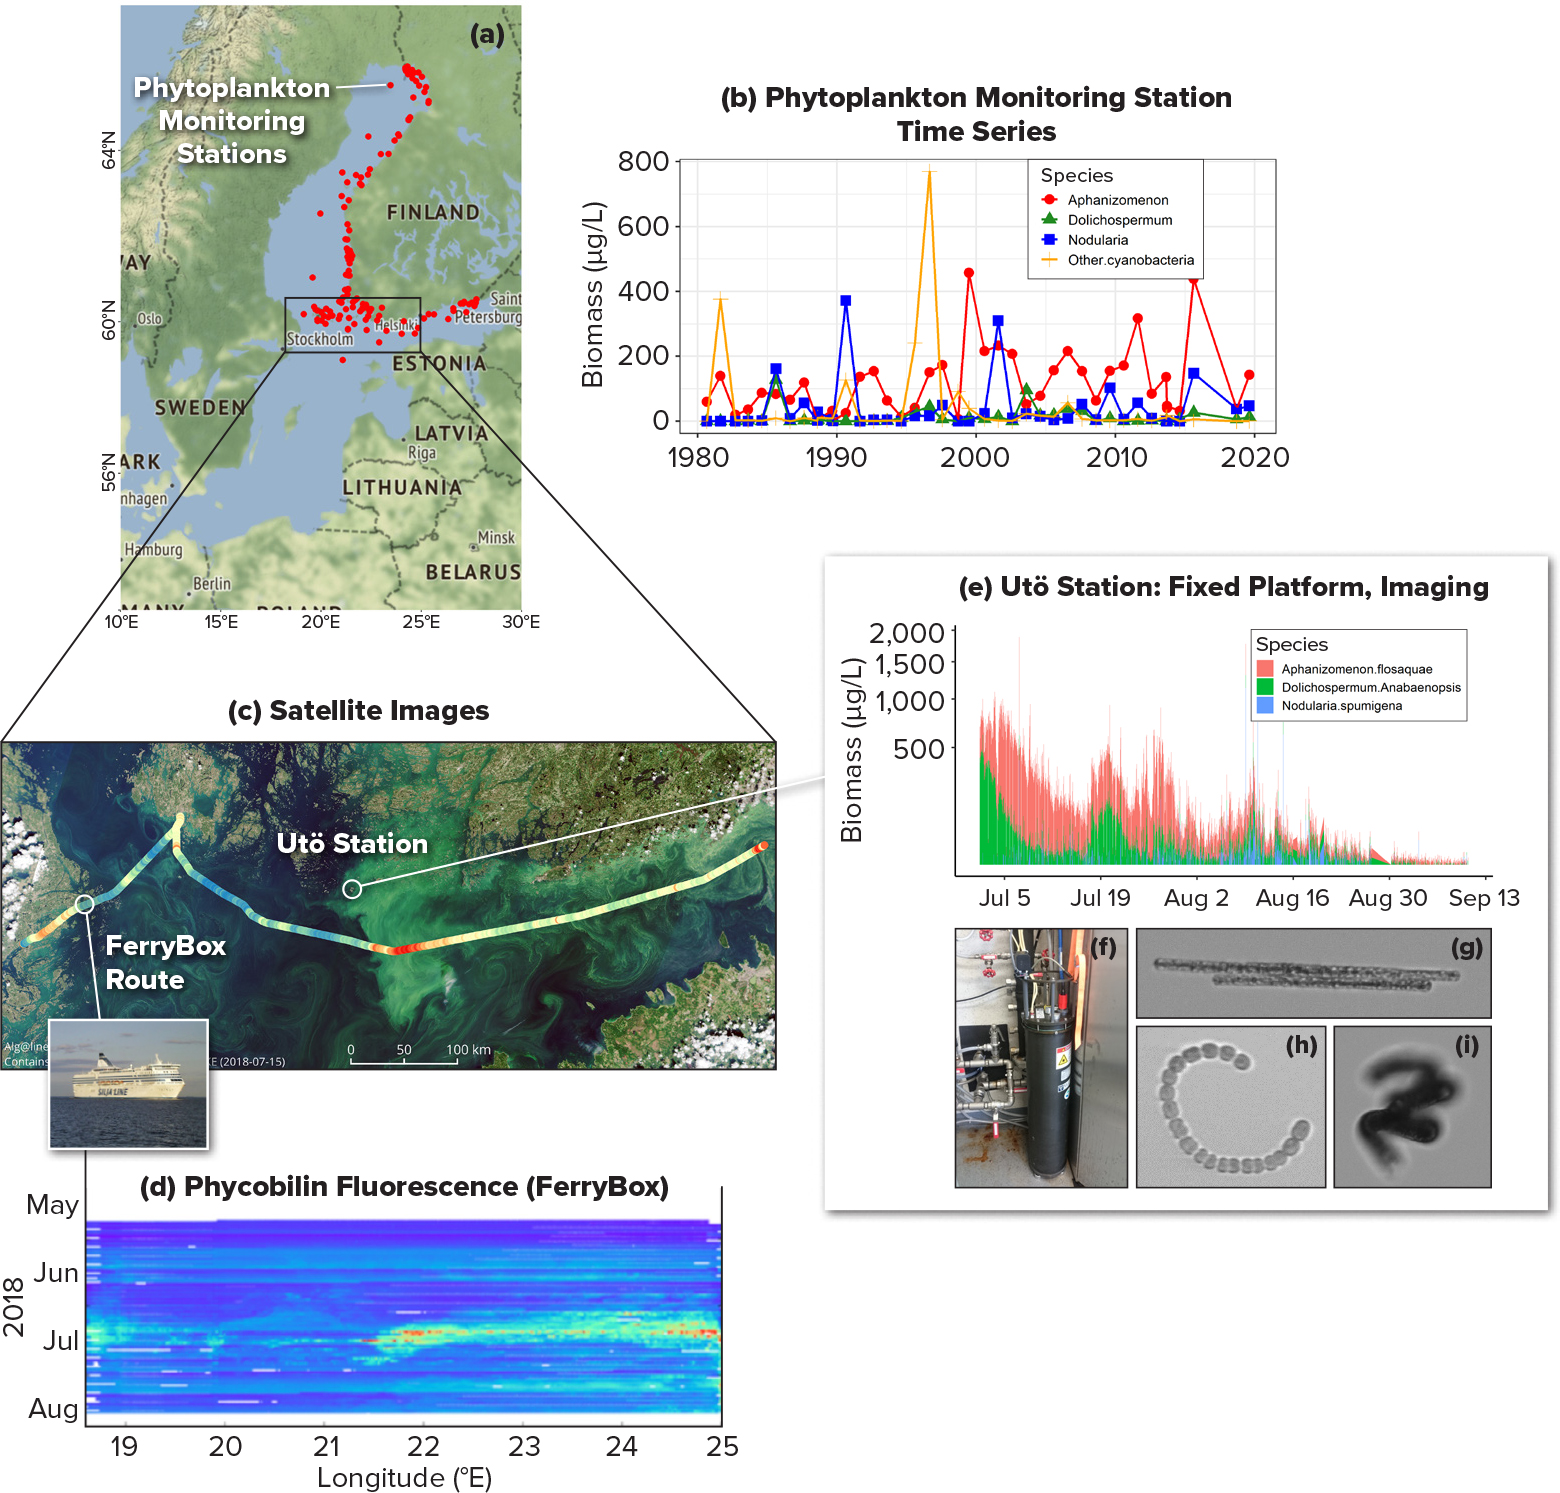
In the early 1990s, the Alg@line program for observations using ships of opportunity was introduced. Commercial Baltic ferry lines are equipped with automated sampling systems called FerryBoxes that collect discrete water samples for laboratory analyses and have sensors for detecting the specific pigment fluorescence of cyanobacteria (Figure 1b–e) in high spatial resolution (Figure 2c,d).
In 1998, summertime national cyanobacterial bloom monitoring was initiated, with bloom intensity estimated visually in lakes, along coasts, and in archipelago areas. Coordinated by Finnish environmental authorities, it engages citizen volunteers and incorporates observations from routine border guard flights.
Satellite observations for detecting the cyanobacteria blooms were established in Finland in 2004, and since 2016, an open web map interface showing the areas of surface layer blooms, true color imagery (Figures 1h and 2c), and surface water temperatures has been available. Additionally, annual composites that show summer surface blooms detected by satellite observations are generated.
In 2015, the Utö Atmospheric and Marine Research Station was established in the outer Archipelago Sea for continuous, autonomous collection of observations using fluorescence sensors (like those used in FerryBox) and imaging in-flow techniques for identification and quantification of cyanobacteria (Figure 2e–i). Although the in-flow methods allow for fast and reliable analysis of individual particles in a sample, these relatively new methods are still not standardized, so experts are required to adjust the automated classifications and to manage the massive amount of data produced by the continuous measurements.
The evolution of the monitoring network and the broadening of its spatiotemporal coverage has only been possible through the combined efforts of research institutions, international partners, and public participation, as well as the use of a variety of technologies. Multiple techniques can be used to observe cyanobacteria, each with different strengths and weaknesses, and combining techniques improves observation capacity and therefore cyanobacteria monitoring (Figure 2). Network observations are coordinated by the Finnish Environment Institute, which compiles the information as a national summer bloom status report that is made available to the public weekly. The evolution of Finland’s Baltic Sea cyanobacteria observations over recent decades illustrates not only the various methods available for observing the ocean but also the importance of engaging diverse partners, including citizens, to accomplish observations of marine phenomena.