Introduction
One way to evaluate the 50-year evolution of the Pacific Marine Environmental Laboratory’s (PMEL’s) research is to consider discoveries, innovations, and results as returns on the US government’s investments. NOAA, part of the Department of Commerce (DOC), conducts purposeful research to support its mission (1) to understand and predict changes in climate, weather, ocean, and coasts; (2) to share that knowledge and information with others; and (3) to conserve and manage coastal and marine ecosystems and resources. Research requires perseverance by dedicated scientists and engineers who spend years, sometimes decades, to bring a hypothetical concept to real products. If successful, these research products become candidates for transfer into NOAA operations and/or the US economy. This article focuses on the transfer of PMEL-produced tsunami technologies to NOAA operations and the US blue economy (Hotaling and Spinrad, 2021). For background on the decades of research and development that preceded the transfer of these technologies, see Bernard et al. (2023, in this issue).
PMEL’s approach to tsunami research is unique in that tsunami observations and modeling are advanced simultaneously as a unified project. This offers an advantage in both enhanced speed and lowered cost of developments based on close interactions of the observational researchers with modelers. An example of this interaction was setting the thresholds of tsunami detection for the Deep-ocean Assessment and Reporting of Tsunamis (DART) buoy. The sensor technology allowed two options for the measurement range of tsunami height: 0.01–1.00 m or 0.01–10.00 m. After conducting modeling experiments, modelers recommended the 0.01–10.00 m option. During the 2011 Japan tsunami, a DART buoy reported the tsunami with a 1.87 m amplitude, demonstrating that the modelers’ recommendation was correct.
This article provides a brief history of the transfer of DART and modeling technologies within and outside NOAA, and Figure 1 shows the flow from research to technology transfer and its effects on expanding the blue economy. The next section describes the transfer of DART within NOAA, which required years of effort, and then the transfer outside of NOAA that required a patent and license agreement. It is followed by a discussion of the tsunami flooding modeling technology that required a multi-year validation process for transfer to NOAA’s tsunami warning centers (TWS) and an international training program to allow other countries to access the technology. The next section describes how this transfer process led to economic development to protect coastal citizens from future tsunamis. The final section presents conclusions and future directions.
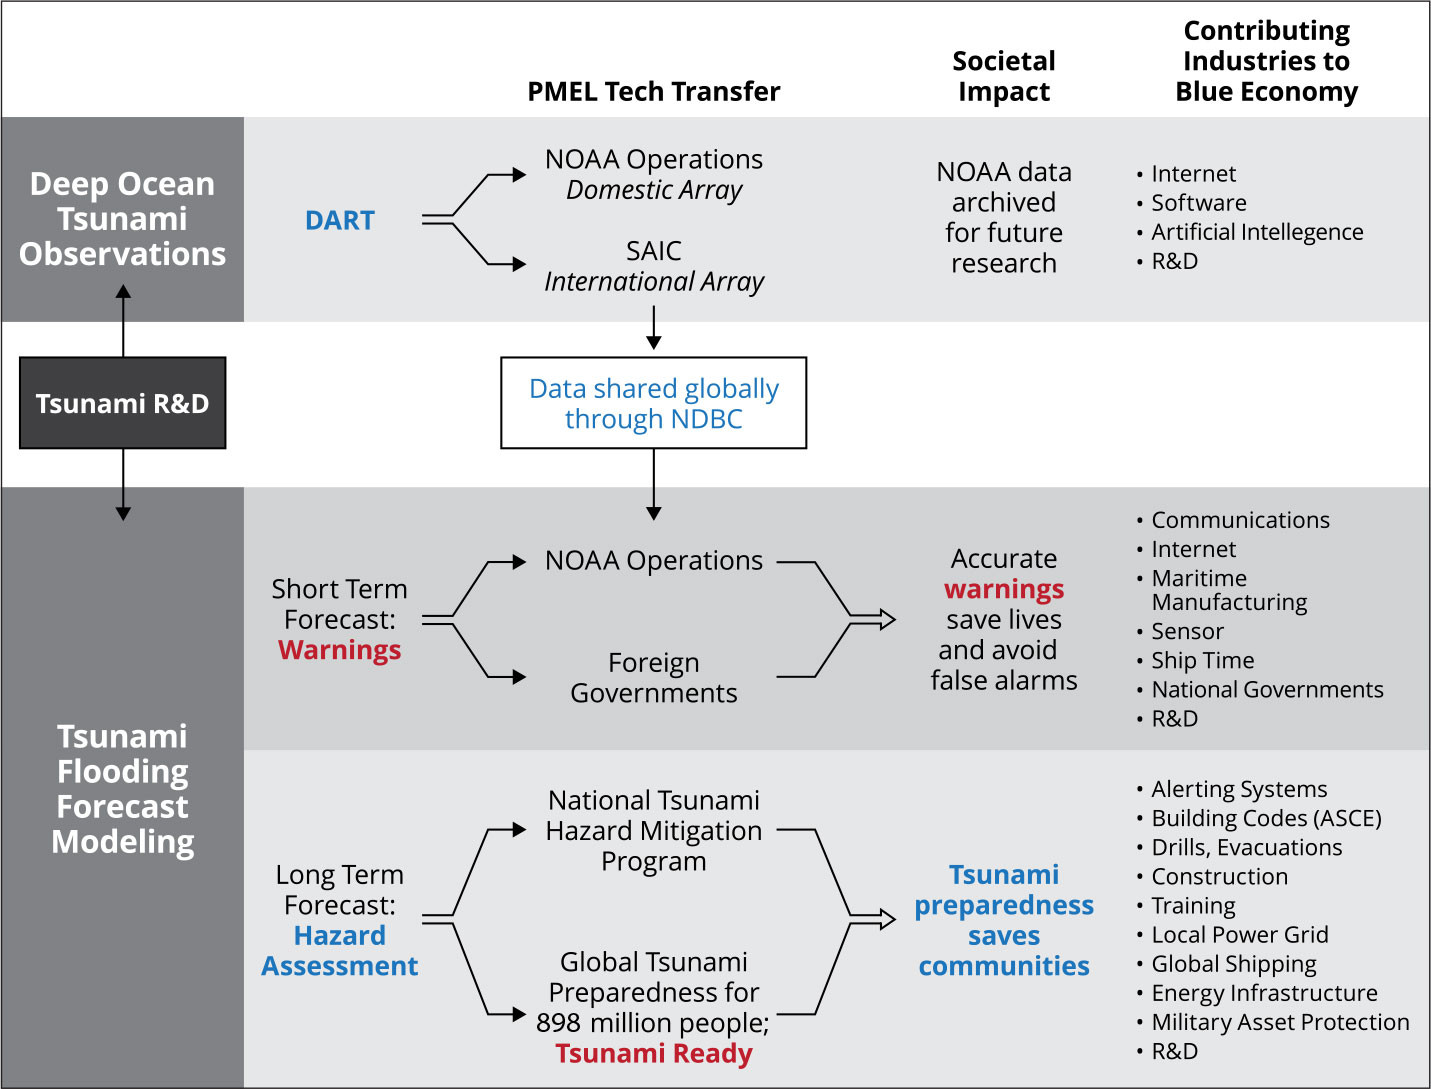
FIGURE 1. History of the transfer of tsunami technologies within and outside NOAA and resulting impacts on global society and the blue economy. > High res figure
|
PMEL’s efforts in transferring tsunami technology have been a resounding success, recognized by four US Department of Commerce gold medals. The creation of this tsunami flooding forecast capability has benefited not only NOAA operations but also communities in the United States and elsewhere as it provides protection from future tsunamis for a growing global population in low-lying coastal areas that currently numbers about 898 million (Reimann et al., 2023).
DART Technology Transfer to Operations
DART History From 1980 to Present
Through the 1980s, the development of autonomous bottom pressure recorders (BPRs) for tsunami measurements accelerated advances in low-powered electronics coupled to high-resolution depth sensors. In 1981, PMEL initiated a dedicated research and development program, along with a sustained observing program, that monitored bottom pressure at five sites in the North Pacific (Eble et al., 1991) and resulted in some of the first deep-ocean measurements of tsunamis. These programs set the stage for an integrated observing and modeling effort that revolutionized the field of tsunami monitoring and forecasting.
In the mid-1990s, PMEL developed, integrated, and tested key surface mooring and acoustic modem and satellite communication technologies that were coupled to BPRs to become the first operational DART system (Meinig et al., 2001; González et al., 2005). Development of the DART network was an extraordinary accomplishment, and a real-time operational network was a powerful catalyst for the paradigm shift in PMEL’s research and forecasting efforts away from indirect observations and toward development of the first direct, high-quality measurement of this kind (Bernard et al., 2001).
Through the late 1990s, the DART network became reliable and economical. Endurances exceeded 12 months, and data transmission reliability was >97%, well above the 80% design criteria even in the North Pacific, which has some of the harshest wave conditions on the planet (Bernard and Meinig, 2011). The core DART technology has evolved and grown into a more capable and integrated system that today includes 72 systems deployed operationally by eight countries, with standardized data shared globally. It is important to note that this global operational DART array would not exist without (1) dedicated industry partners that provide key enabling technologies and components, and (2) the successful, yet complex, DART system technology transfers to both government and industry that expanded the blue economy.
DART Technology Transfer to the National Buoy Data Center
The goal of transitioning the operation and maintenance of the DART network from research to operations within NOAA was to maintain, operate, and improve the system in a cost-effective manner. The National Data Buoy Center (NDBC) has a clear mission to collect and deliver operational data to support warning and guidance decisions that serve a variety of stakeholders, including federal, state, and local governments as well as growing commercial interests that use NOAA foundational data sets as they create new markets in the blue economy. Although serving such individual new markets is beyond NOAA’s mission, identifying new emerging data needs, setting standards, and transitioning capabilities to operations are measures of success for NOAA.
High-level goals were to improve forecasts, infuse new technology, and increase efficiency. Over the course of about four years, two generations of DART technology were transferred from PMEL to NDBC. After developing a rough transition plan and estimating costs for each organization, the process was roughly separated into phases for each DART generation transition, as depicted in Figure 2.
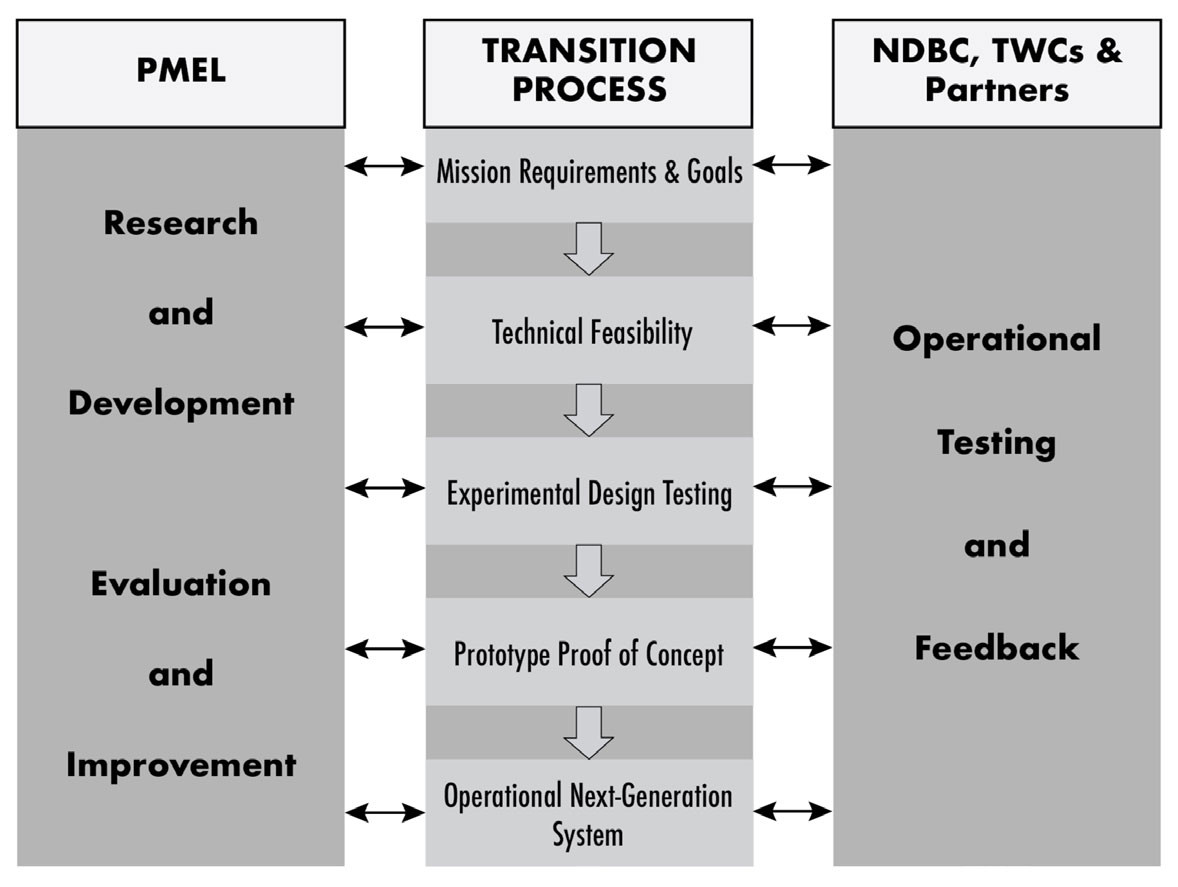
FIGURE 2. Interactions required for successful technology transfers from NOAA research to NOAA operations. This process must continue as long as the technology is used. > High res figure
|
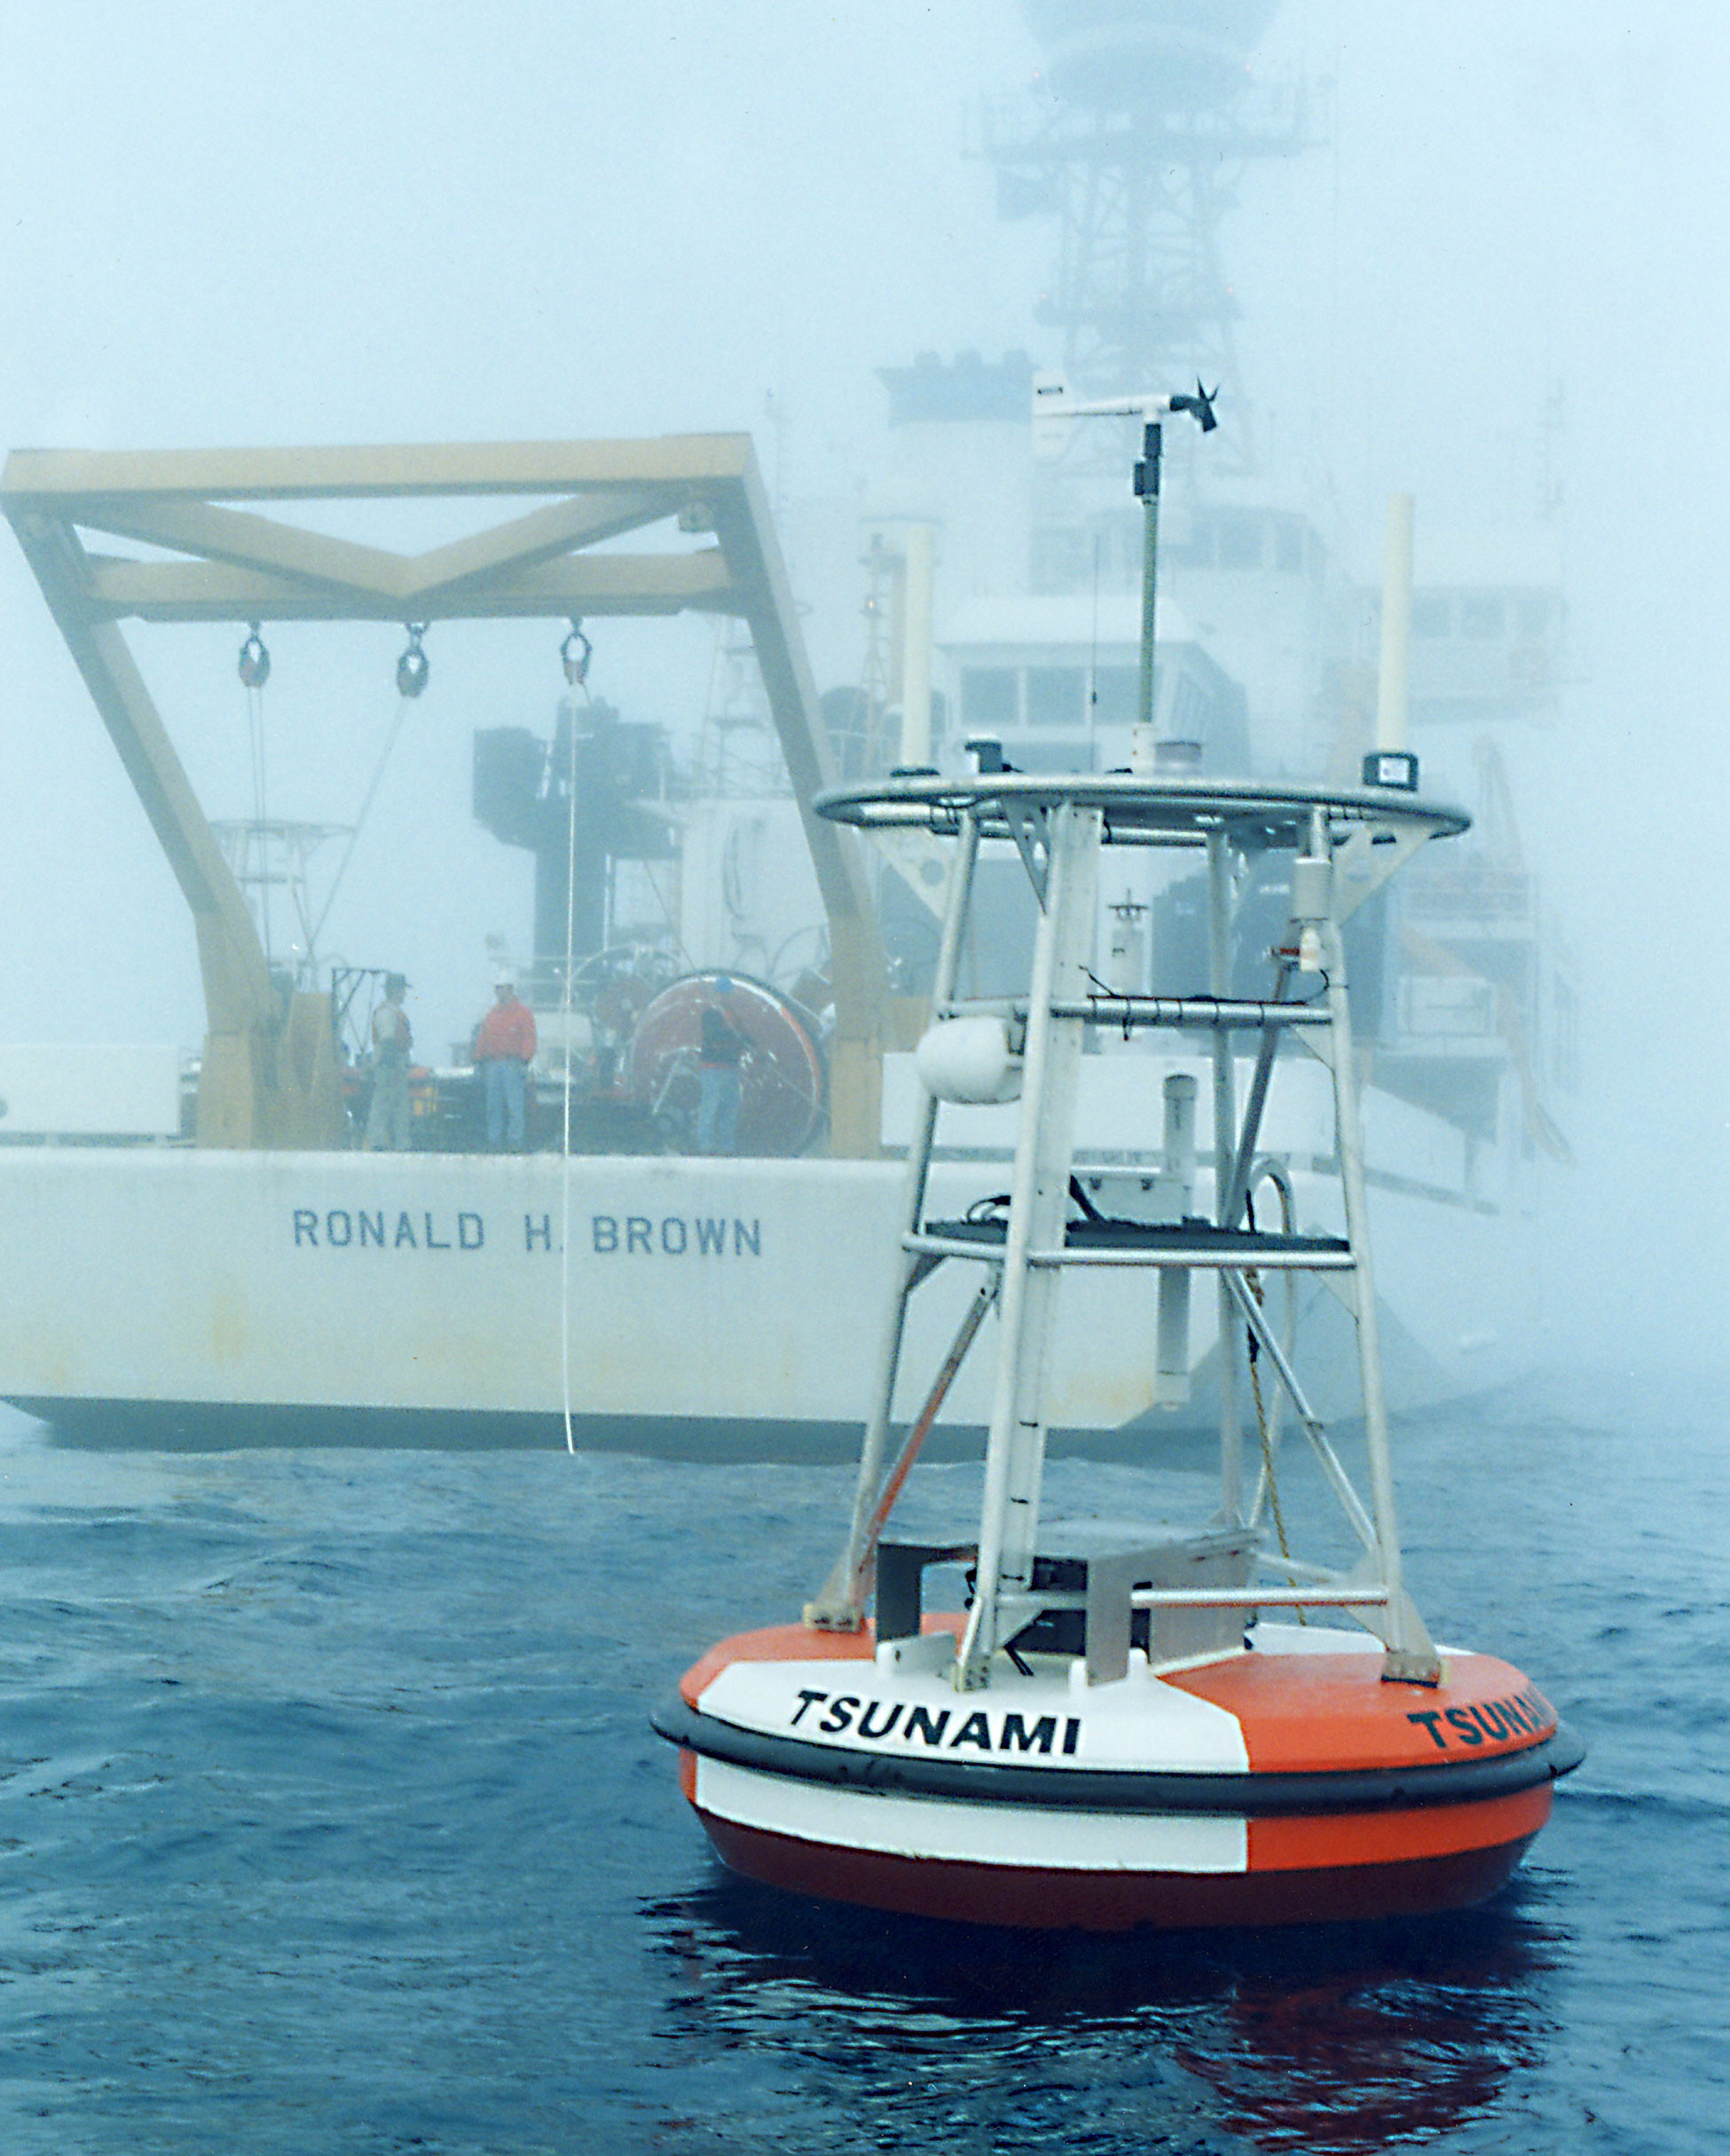
Although NDBC and PMEL both had successful buoy programs, these programs developed differently over the years, with PMEL working in the deep ocean and NDBC in the surface ocean. Introducing the DART system brought a new level of complexity to NDBC because it included a BPR that required expert knowledge about high-pressure electro-mechanical systems, acoustic communications, and a highly sensitive pressure gauge as well as at-sea knowledge of how to precisely deploy, track, and recover both the buoy at the surface and the relatively small BPR at depths up to 6,000 m (Figure 3). Other specialty skills required included selecting and testing of subsea cables and connectors; specifying and testing of acoustic modems, releases, and power systems; and knowledge of subsea maintenance protocols. These combined technical challenges along with important cultural differences between PMEL and NDBC give rise to important lessons learned in the successful transitioning of the DART array.
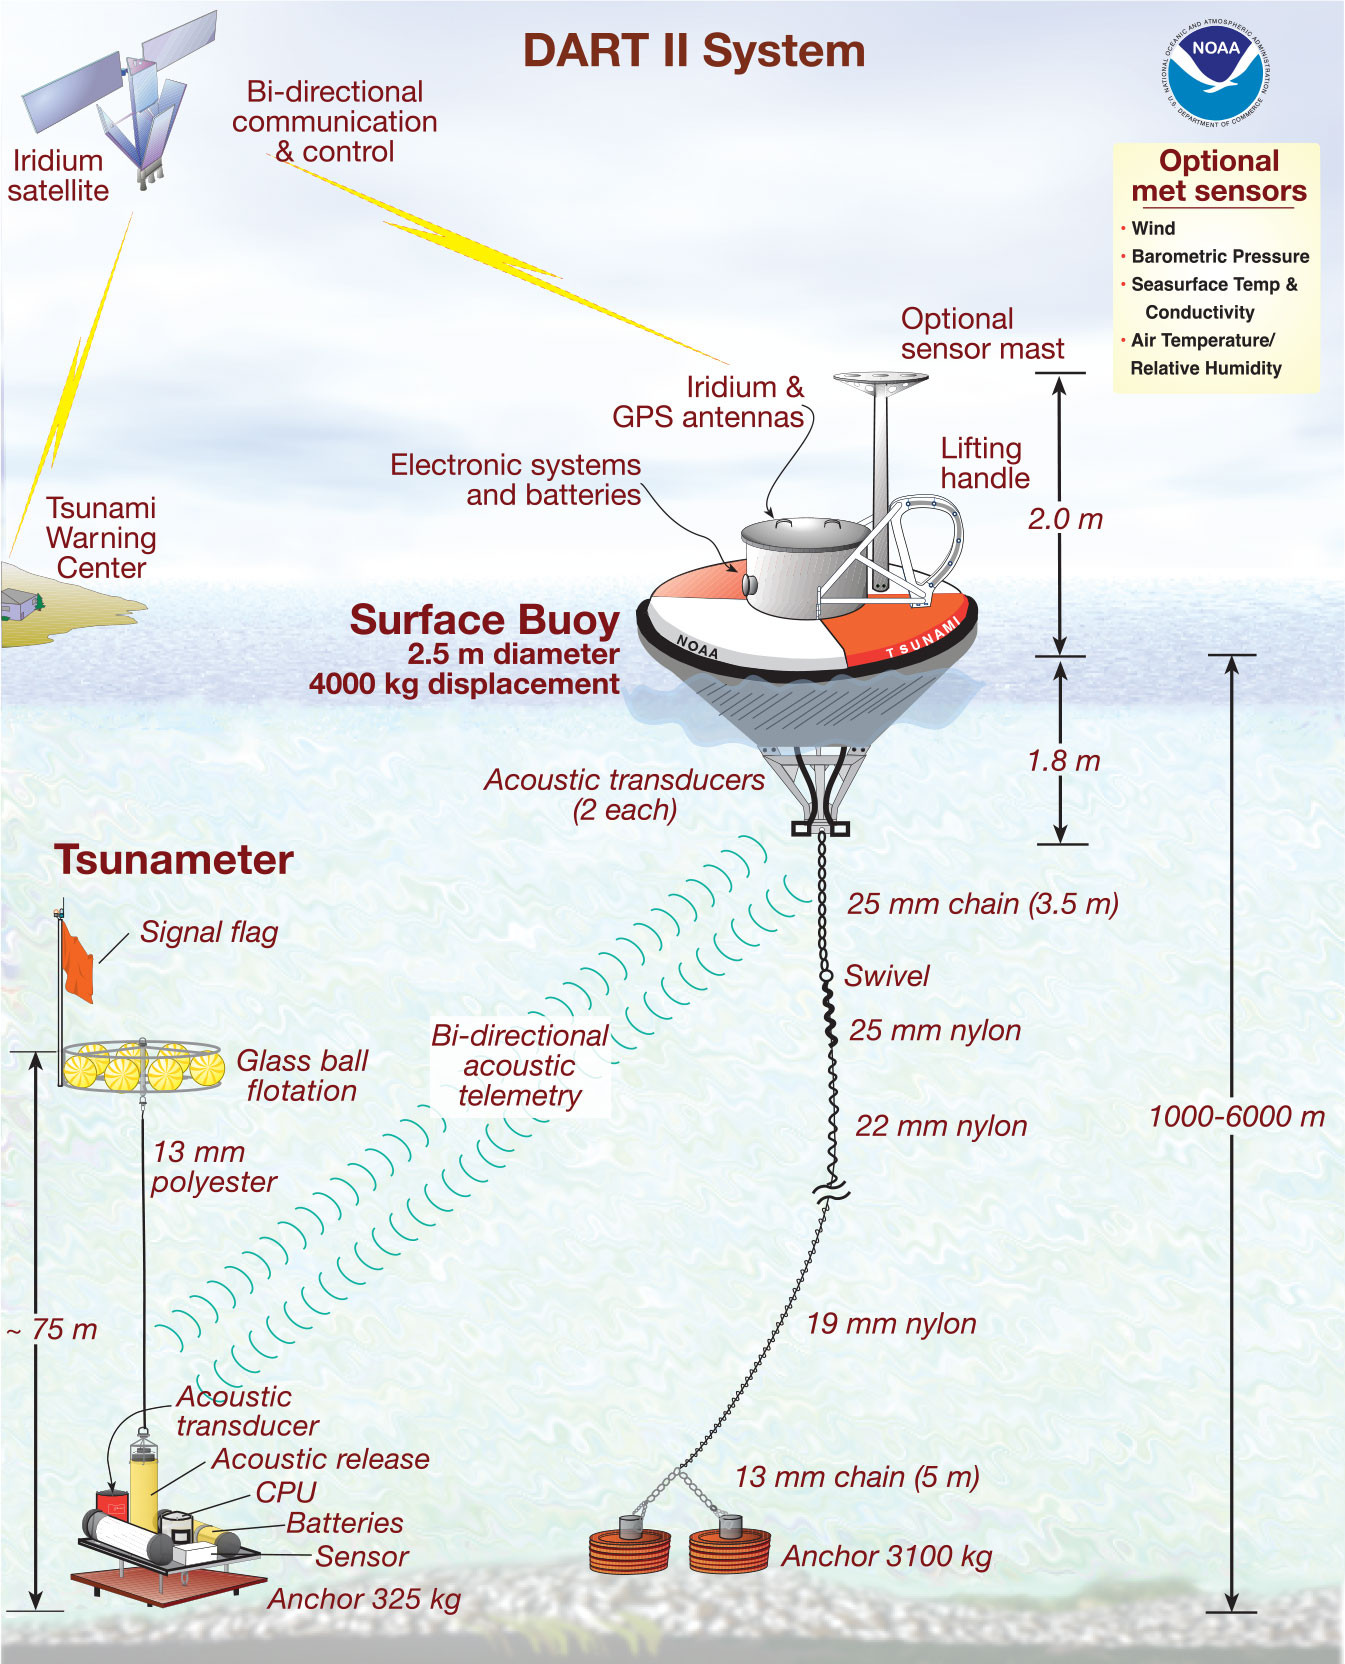
FIGURE 3. Details of DART technology components requiring specialized knowledge and experience. Image credit: NOAA/PMEL. > High res figure
|
Challenges and Lessons Learned from NOAA Technology Transfer
The successful transition of the DART network from PMEL to NDBC was a test of technical and operational skills, organizational capacity, and fiscal commitment. Challenges and lessons learned have crystallized over time and could benefit other transitions. In the ~15 years since the DART transitions, NOAA has addressed several of the transition challenges with the recent formation of the NOAA Ocean and Atmospheric Research Transition Office and a guiding policy (NAO 216-105B). We learned three lessons from two DART transitions.
- A dedicated technology transfer manager can improve coordination between the research organization and the receiving operational organization. A transition manager with proper authority could have guided and reconciled competing resource commitments for each NOAA branch involved during the transition process. A technically skilled transition manager could have helped navigate the inherent cultural differences within NDBC and PMEL, and thus improved efficiency and coordination as the transition plan was executed.
- A tactical technology transfer plan would aid in the transfer process. While a high-level “Operations and Services Improvement Process” existed in NOAA and a mutually agreed-upon transition plan was eventually written and useful in the overall process, the collective effort would have benefited from a tactical plan that assigned specific responsibilities and provided sufficient resources for each line office to execute them. A definition of terms within the plan would have framed deliverables and clarified expectations for research, operations, and leadership.
- Identification of specific skills required for the transfer would improve the process. Each line office would have benefited from specific technical and operational skills that would have sped up the transition process. PMEL would have benefited from having personnel with operational management skills and the availability of operational-grade software documentation. The additional structure would have dovetailed better with NDBC’s operational mandate within NOAA. Similarly, while NDBC had buoy experience, its staff had little to no experience with subsurface and high-pressure equipment because no other buoy programs required it. Deploying high-pressure yet fragile instrumentation and the proper subsea cables and connectors presented challenges that required specialized knowledge, testing procedures, and equipment.
The transition of two generations of DART technology from NOAA research to operations has been successful and to a large extent a model within the NOAA ocean observing community. However, the global demand for DART technology that surged after the devastating 2004 Indian Ocean tsunami was outside the scope of what NOAA could provide. PMEL created a plan to meet this urgent demand by combining the best aspects of government research and industry to make DART globally available through a public-private partnership that has sparked “green shoots” (new growth) in the blue economy and opportunities for technological value-added development (Hotaling and Spinrad, 2021).
DART Technology Transfer to Industry
Following the 2004 Indian Ocean tsunami, PMEL was granted a patent for the DART technology in order to make it widely available internationally and to encourage growth in the US blue economy. The DART technology is licensed through an application and evaluation process. Selected licensees are subject to annual review, including evaluations of production quality and system performance, which are vital for the integrity of a warning system. Although several companies have applied for licenses, to date, only Science Applications International Corporation (SAIC) has been licensed to produce and support commercial DART systems (Bernard and Meinig, 2011).
SAIC has a long history of supporting the US government and the Department of Defense with advanced technologies, integration, and operations. Since 2007, SAIC has produced and supported more than 60 DART systems for Australia, Chile, China, Ecuador, India, Japan, New Zealand, Russia, Taiwan, Thailand, and the United States per PMEL specifications and the license agreement. Key SAIC contributions include the ability to scale appropriately to meet international demand for DART systems and support, and capacity for efficient and effective data ingestion into global forecasts. SAIC has frequent and direct contact with their international DART customers and encourages them to archive and publicly share their DART data and operational lessons learned for the collective benefit of the entire observing community. Importantly, SAIC shares system performance from the international DARTs with the PMEL developers to continuously improve system performance.
Since 2007, three generations of DART technology have been transferred from PMEL to SAIC using the same process established for the PMEL to NDBC transfer. However, there are some important differences to highlight. The royalties returning to PMEL from the license agreement with SAIC permit a continuous dialog along with funding of PMEL engineering costs. This open dialog and funding has benefited a range of technical and operational improvements and protocols, including troubleshooting obsolescence problems, developing DART Easy to Deploy, evaluating mooring endurance (Lawson et al., 2011), debugging software, and characterizing tsunami data from many tsunamis and earthquakes.
Challenges and Lessons Learned from Transfer to Industry
The successful transition of three generations of DART technology from PMEL to SAIC proved what could be accomplished through cooperative work and annual review of patent license agreements.
Although the global market for DART systems is limited, they do provide direct economic gains and the benefits of a standardized deep ocean observing system to communities under threat. In the ~15 years of PMEL-SAIC DART transitions, we highlight two of the most important lessons learned:
- Perform an annual review of the patent license with clear performance criteria. The PMEL lab director has authority over the patent application and review process (per federal guidelines), which minimizes bureaucracy and streamlines communications with the industry partner. This reduces management expenses and maximizes engineer-engineer direct collaboration between SAIC and PMEL.
- Invest royalties in continued DART R&D. A fraction of patent royalties return to the PMEL lab director for a defined set of uses that include advancing R&D and future innovations. This small but annual amount of funding is important for the continuity of DART system improvements that benefit the entire global tsunami community.
The transfer of three generations of DART technology and the ~15-year public-private-partnership between SAIC and PMEL have delivered benefits to the blue economy above and beyond the limited global market size of tsunami observing systems alone. Just as the DART system has followed a technology development and transition path, tsunami model development followed a separate process with important intersections and feedback to the next generation of DART systems. The combination of DART data plus modeling had profound impacts on tsunami forecasting and the blue economy.
Modeling Technology Transfer and Applications
Developing modeling expertise for scientific research and exploration is a very different task from building modeling capabilities for operational settings. Operational forecast use of modeling tools requires accuracy (the primary goal of the science use) and reliability of model results, robustness of model performance, and rapid production of actionable forecast products. Here we provide an overview of PMEL’s efforts to move tsunami models into operational tsunami forecasting capability for NOAA’s Tsunami Warning Centers (TWCs) and to provide technical tools for long- and short-term tsunami forecasting useful to national and international partners.
Short-Term Flooding Model Transfer to NOAA’s Tsunami Warning System
The idea of basing tsunami flooding forecasting on real-time tsunami data was formulated at PMEL’s tsunami research group in the late 1990s (described in detail by Titov et al., 2005). In 1997, PMEL began systematic research and development efforts designed to build practical tsunami forecasting tools based on the Method of Splitting Tsunami (MOST) model. The Defense Advanced Research Projects Agency (DARPA) funded the development of tsunami hazard mitigation tools for the Pacific Disaster Center. This work has continued with follow-up grants from the Department of Defense, NASA, and the National Tsunami Hazard Mitigation Program (NTHMP). This effort was the foundation for the next-generation tsunami forecasting tools for the TWCs (Titov and Gonzalez, 1997; Titov et al., 1999, 2005).
Following recommendations of the Workshop on Far-field Tsunami Forecast Guidance, NTHMP funded the development of tsunami forecast guidance tools for NOAA TWCs and emergency managers. The collaborative effort combined several tsunami forecast methodologies (Titov et al., 1999; Wei et al., 2003; Whitmore, 2003) into practical forecast tools for implementation at TWCs. The development of modeling capabilities was in parallel and in close collaboration with engineering efforts to develop deep-ocean tsunami detection tools. Several tsunami events recorded by the bottom pressure recorders were used to test the forecast methodology. The 1994 Kuril Island and the 1996 Andreanof Island tsunami events were the first tests of emerging forecast methodology. However, the most important proof of concept came with real-time detection of the 2003 Alaska tsunami by three DARTs located along the Aleutian Trench. These data were combined with the model database to produce the first real-time model tsunami forecast obtained before the tsunami waves had reached many coastlines. This forecast provided both an experimental test and justification of the newly developed forecast method for real-time warning operations.
The novel three-step coastal forecast procedure followed then—(1) precomputed propagation to be used for (2) inversion of real-time tsunami measurement followed by (3) high-resolution coastal assessment—has become the de facto standard for new tsunami forecast capabilities developed around the world (Bernard and Titov, 2015). It established several key requirements for accurate flooding forecasts: use of direct tsunami observations for model input, an effective data inversion procedure, and availability of high spatial model resolution at forecasted coastlines (Figure 4). Successful testing of the method with real tsunamis showed the benefits of the model flooding forecast capability for tsunami warning, which led to the NOAA leadership decision to implement the flooding forecast in TWC operations following the 2004 Indian Ocean tsunami disaster. The aftermath of that tragedy resulted in accelerated development and implementation of more advanced tsunami forecast systems (Bernard et al., 2006; Synolakis and Bernard, 2006; Titov, 2009).
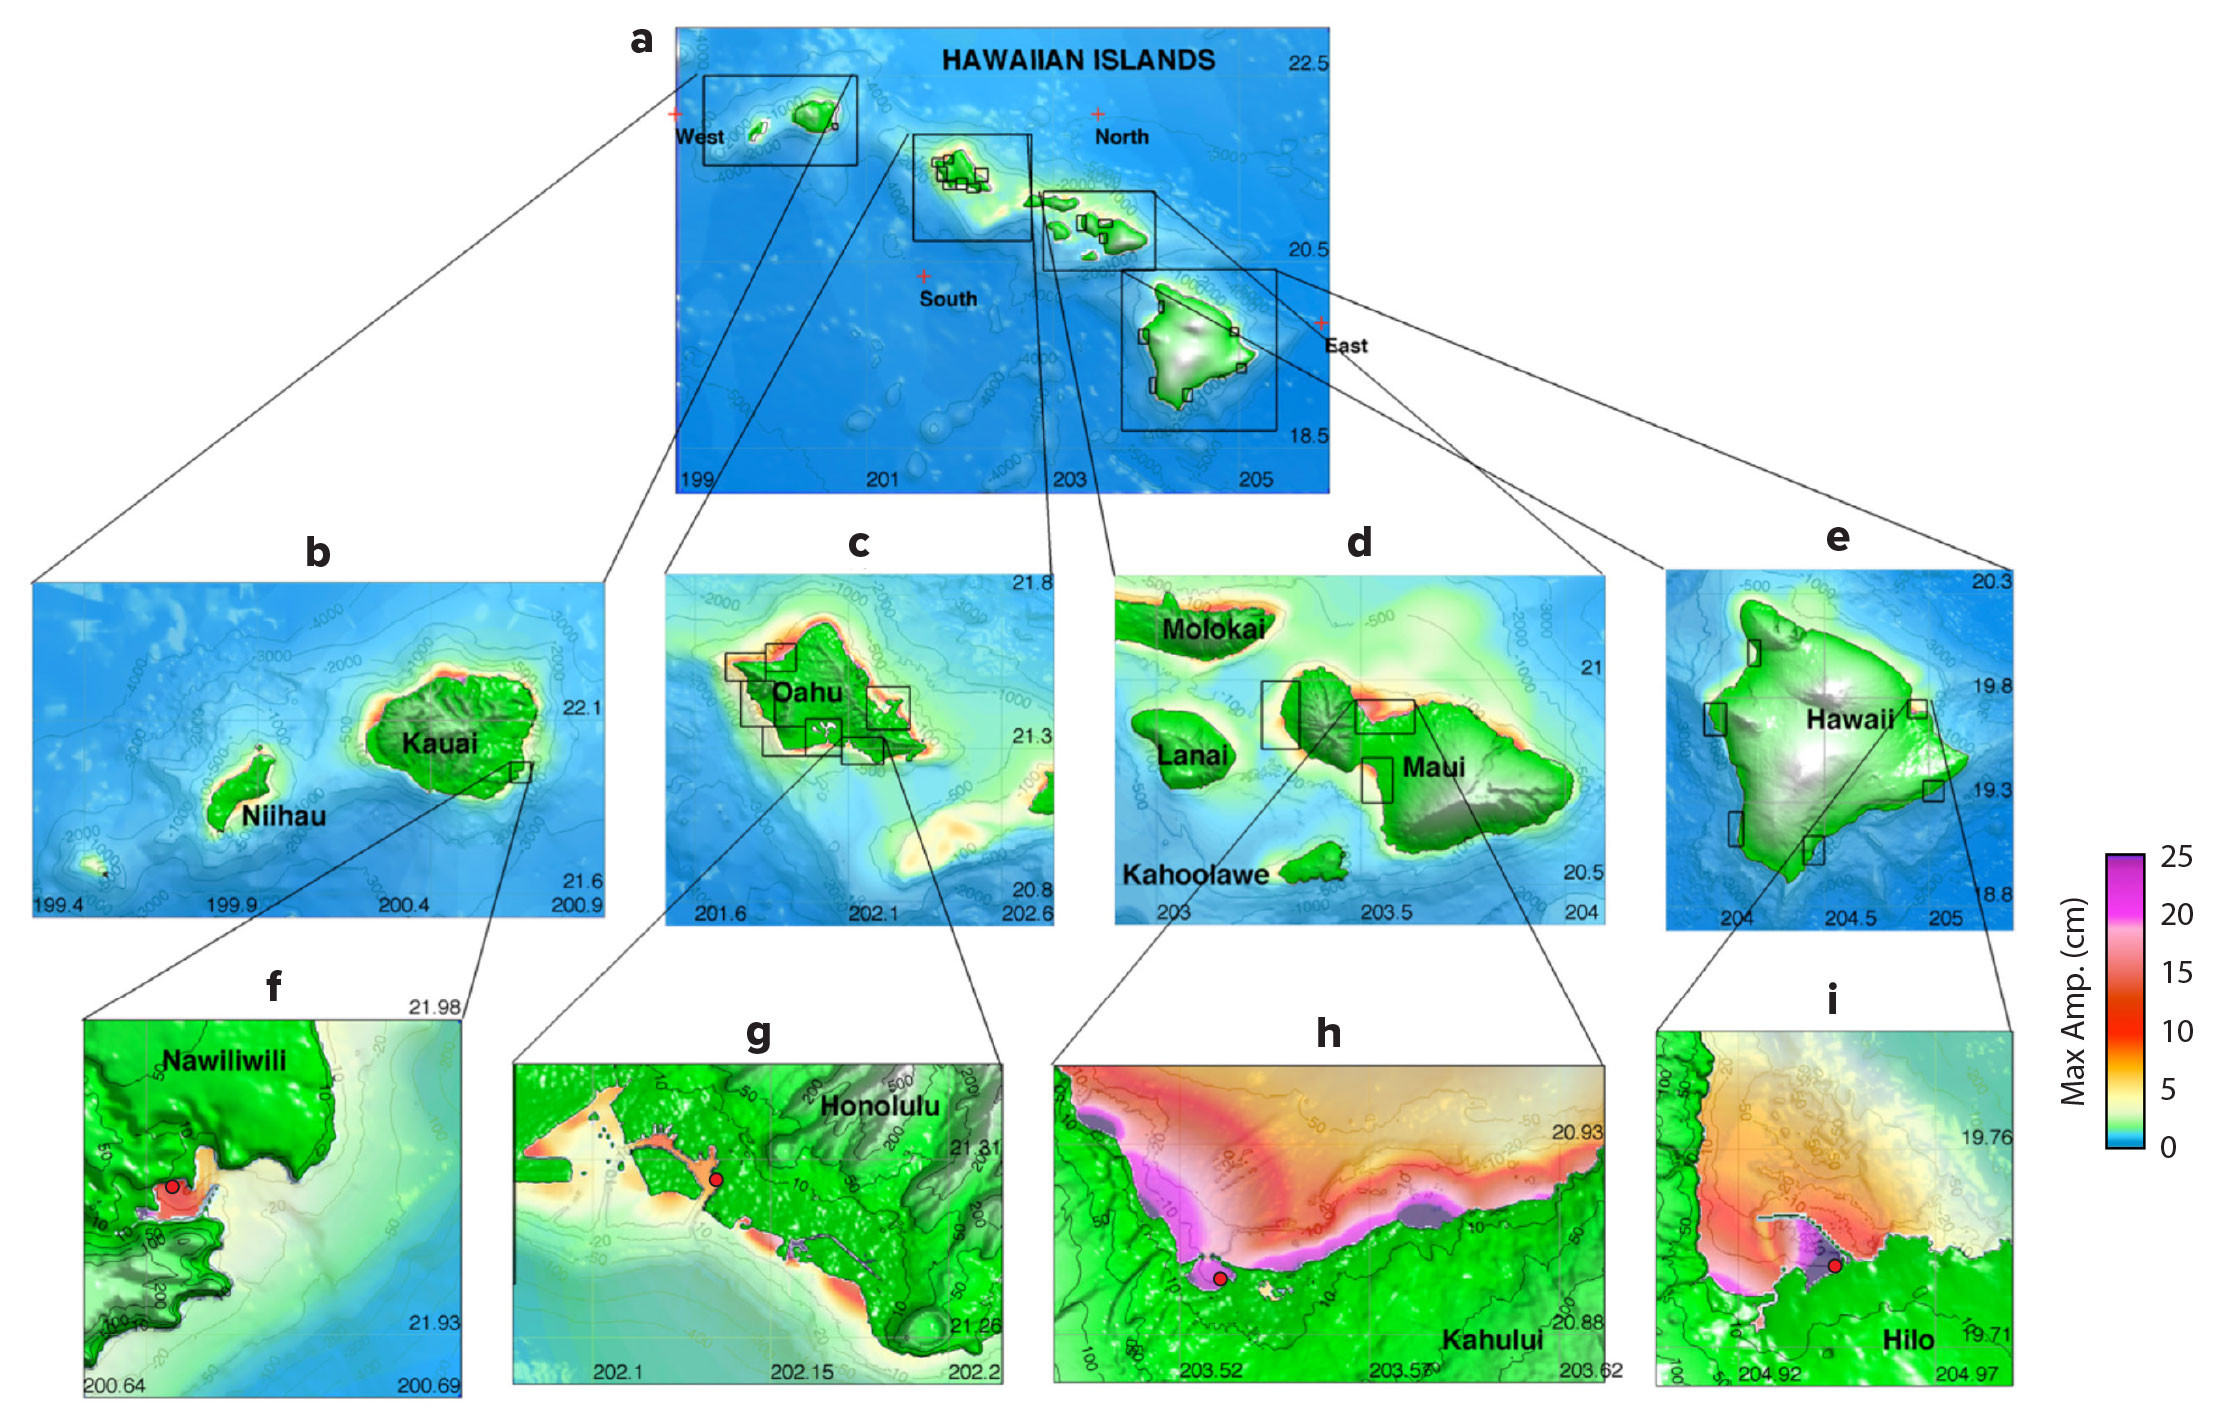
FIGURE 4. Forecast model setups in Hawai‘i: (a) 2 min (~3,600 m) regional, (b–e) 12–18 sec (~360–540 m) intermediate, and (f–i) 2 sec (~60 m) nearshore grids for Nawiliwili, Honolulu, Kahului, and Hilo. Filled colors show the maximum tsunami amplitude in centimeters computed by the forecast models for the November 17, 2003, Alaska tsunami. Red dots mark coastal tide stations. Adapted from Tang et al. (2009). > High res figure
|
After the 2004 event, the NOAA Center for Tsunami Research (NCTR) at PMEL was tasked with developing a tsunami forecast system for TWCs (Titov et al., 2005; Titov, 2009). This system is based on previous PMEL development work and is described in detail by Tang et al. (2009). The forecast method combines real-time measurements from DART buoys with the MOST model to produce real-time forecasts of tsunami arrival times, heights, and inundations.
The final design of the system, Short-term Inundation Forecast for Tsunamis (SIFT), was established in 2007 with 39 operational DART stations in the Pacific and Atlantic Oceans and at least 75 high-resolution models to provide tsunami flooding forecasts for high-risk communities along US coastlines. The system also included a modeling component to provide tsunami propagation forecasts using the database of over 2,000 precomputed global tsunami propagation runs. The whole system was transitioned to TWC operations by 2013.
Several sizable tsunamis were used for testing during development of the system. The ultimate test occurred on March 11, 2011, when the Japanese Mw 9.0 earthquake generated the tsunami that became the costliest natural disaster of all time. The tsunami killed over 22,000 Japanese people and caused economic losses exceeding $214 billion. This was the first tsunami that flooded many Pacific coastlines for which deep-ocean data were available from multiple well-positioned DART stations near the source to verify the experimental flooding forecast capability of the system. The DART observation system was fully deployed, and 32 site-specific flooding forecast models (most of those planned for the Pacific) were already installed at the TWCs for operational testing. The average accuracy of all 32 forecasts for the 2011 tsunami, when compared with the maximum amplitudes at the tide gauges, was approximately 70% (Titov et al., 2016). The gauges measuring amplitudes greater than 1 m exhibited 74% accuracy, and those measuring amplitudes greater than 1.5 m were predicted with 87% accuracy, confirming that flooding can be accurately forecasted (Figure 5).
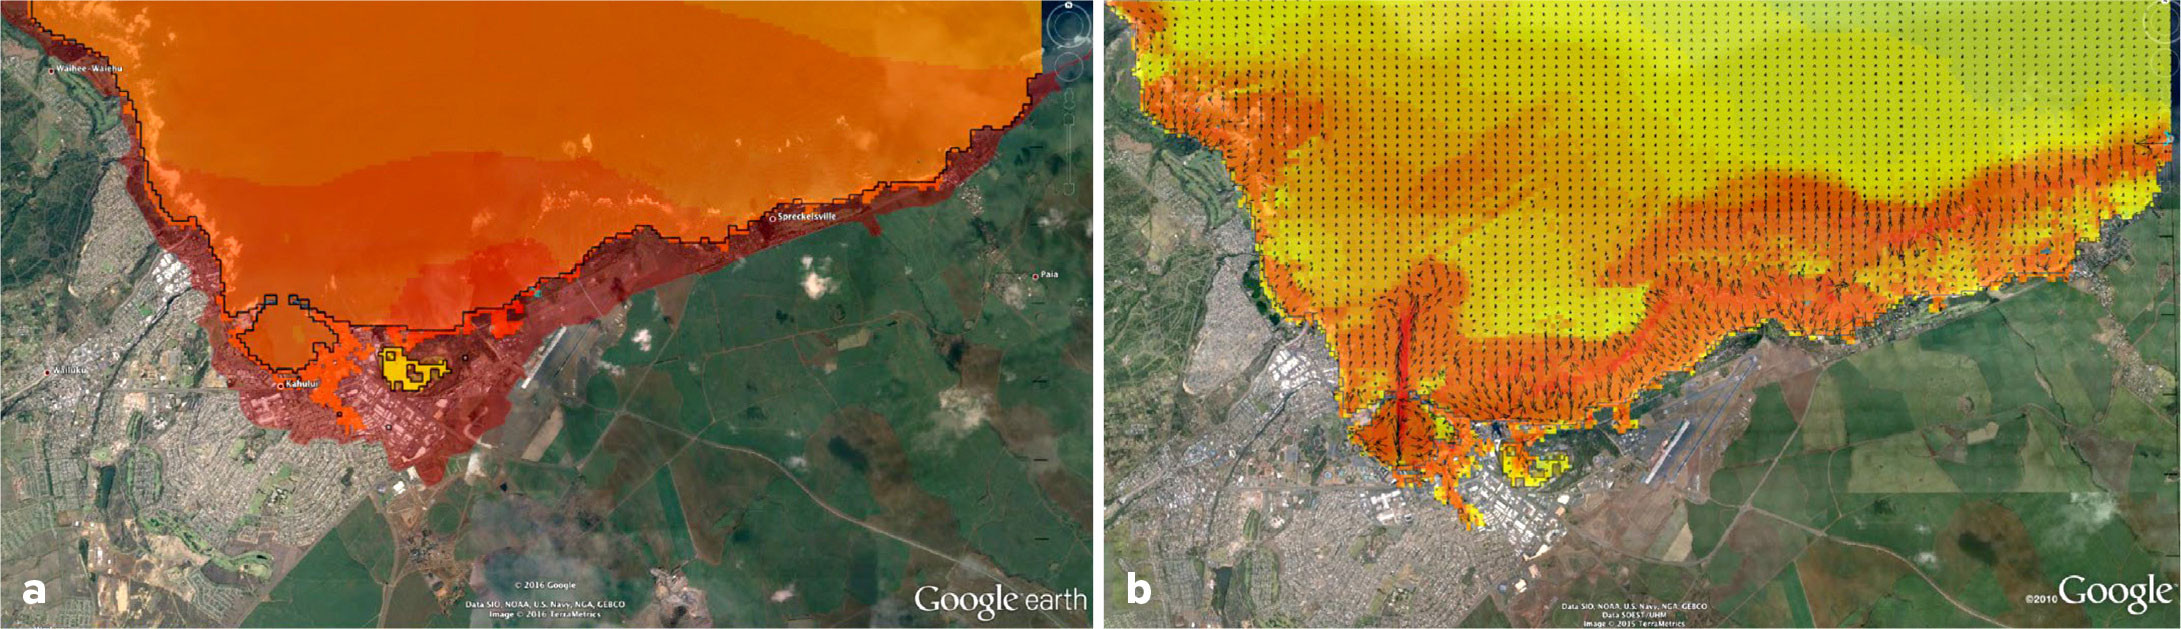
FIGURE 5. Example of tsunami forecast graphical products of Tweb and ComMIT for the March 11, 2011, Tōhoku tsunami at Kahului, Hawai‘i. (a) Tsunami inundation forecast for the Tōhoku tsunami (bright red colors) as viewed in Tweb overlaid with tsunami evacuation zones (darker red colors). (b) Output of tsunami currents forecast (arrows show current directions, colors indicate current intensity), as output of ComMIT. > High res figure
|
In addition to accuracy tests with real tsunami events, operational testing and evaluation (OT&E) were conducted to ensure robustness and to develop standard operating procedures for using SIFT and its tsunami flooding forecast models in the operations of the TWCs. The 2011 tsunami data comprised one of four sets of event data used by TWC staff to test the tool; others included data from the 2007 Kuril Islands, 2009 Samoa, and 2010 Chile tsunamis. Over the next two years of testing, four more tsunamis occurred that were also included in the operational tests. In August 2013, after almost two years of OT&E at the TWCs, the first-ever real-time tsunami flooding forecast capability based on PMEL models became operational.
Challenges and Lessons Learned from the Model Forecast Transition to NOAA’s TWCs
SIFT has gone through several versions during implementation testing operations—operational version 4 will soon be replaced by version 5. Based on implementation and operational use experience, a few conclusions can be drawn.
DART transition efforts have gone through a similar number of versions (DART 4G is the current technology). While these two scientific and engineering developments have been largely independent, they represent two interwoven components of the tsunami forecast system based on tsunami data. Therefore, continuous interchange of data, ideas, and experiences fueled improvements of both systems.
Operational implementation of the two technologies faced very similar challenges. All DART transition issues and lessons learned can be related to the challenges and lessons of SIFT transition into NOAA/TWC operation. In particular, the absence of detailed implementation planning led to additional work during development and implementation of the forecast modeling. This affected modeling more than DART implementation because DART engineering design was fixed before the transition started, while the models were still being developed and refined during the transition. Nonetheless, models were implemented as originally planned and within planned budget, but it led to additional strain on the personnel involved in the implementation process.
PMEL is primarily a research organization with staff selected, evaluated, and motivated by research advances. “Research to Operations” is formally one of the evaluating criteria of research, but it is usually recognized only at the end of a very long process of implementation. During the tedious process of implementing research ideas, research output is adversely affected. Implementation of a completely new system is an additional task that does not align well with PMEL’s main research goals. While there is “push” to transfer the new research to operations, there is not much “pull” for implementation from the operational entity. The problem could be remedied by forming a special technology transfer entity that manages and performs the research implementation using research and operational personnel as outside partners. The concept is depicted in Figure 2. PMEL was de facto acting as such entity but without clear mandate or budget for such function. When the transition budget was exhausted, this function also largely disappeared.
Some additional modeling-specific lessons can be highlighted.
- During the development of NOAA’s flooding model, benchmarks were established using laboratory, analytical, and field data provided by a wide range of research institutions, including academic, government agency, and international collaborators. As a result of this modeling transition effort, the tsunami research community established a standardized benchmarking procedure for tsunami models (Synolakis et al., 2008).
- The success of the transition depends on NOAA upper management promotion and close collaboration through a trusting relationship between developers (NCTR) and users (forecasters at TWCs). Ideally, the interaction should start well before a particular implementation effort is under way so there will be “buy-in” from the operators. This effort should continue throughout refresh cycles in order to provide continuous flow of new science into operations (Figure 2).
A significant difficulty of the transition was the development of a modeling system for two NOAA TWCs that had different responsibilities, provided different products, had different standard operating procedures, and used different computer systems. The problem of serving two separate TWCs and providing recommendations for unified operations has been highlighted in several assessments of the US tsunami warning system (NRC, 2011; NSAB, 2021). SIFT implementation started with the assumption that the operations would be unified. However, the two TWCs are still operating with significantly different procedures, which required essentially doubling the SIFT transition effort. This problem again highlights the value of short- and long-term planning in order to make the transition more effective. While the implementation was more difficult than expected, the resulting SIFT has gained additional value in being a common, standardized system for both centers, and that may become the basis for future unified operations.
Short-Term Flooding Model Access for the International Community
In addition to the flooding forecast system SIFT at NOAA’s TWCs, forecast models are available via the web-based Community Model Interface for Tsunami (ComMIT). ComMIT runs PMEL-developed models locally but downloads the initial data from the same propagation database implemented in SIFT. Thus, forecast scenarios can be used by ComMIT users without conflicting with the operations of the TWCs. ComMIT essentially transferred PMEL’s forecast modeling technology to worldwide communities of tsunami scientists and practitioners. The initial development and training program was sponsored by the US Agency for International Development (USAID) as a capacity-building program for the Indian Ocean nations after the devastating 2004 tsunami. The success of the ComMIT framework for model distribution led to its use for tsunami hazard assessment in many countries and for many different projects and geographies (Titov et al., 2011).
To further advance the distributed forecast concept, PMEL has developed a prototype web tool, Tsunami-web (Tweb), which allows rapid sharing of forecast results created with ComMIT for different coastlines via a graphical web client (Bernard and Titov, 2015). The graphical products recommended for the US Tsunami Warning System by US Tsunami Program reviews (NRC, 2011; NSAB, 2021) are already available for real-time tests via the combined use of ComMIT and Tweb in the United States (Figure 5) and other locations, including Chile and Taiwan.
Long-Term Flooding Forecasting for US and International Coastal Communities
In the past two decades, PMEL utilized short-term forecast methodology and research for long-term tsunami forecasting with deterministic- and probabilistic-based tsunami hazard assessments. Through close collaboration with local experts, the PMEL tsunami model has been employed to produce high-resolution tsunami inundation maps for coastal communities in Washington (e.g., Dolcimascolo et al., 2022), California (e.g., Barberopoulou et al., 2011), Hawai‘i (e.g., Tang et al., 2006), Oregon (e.g., González et al., 2009), and Pacific islands (e.g., Uslu et al., 2013). PMEL’s probabilistic inundation hazard assessment uses high-performance computing (using GPU and parallel computing) to expand tsunami modeling capability for inundation mapping and assessing the resilience of critical coastal infrastructures. These hazard assessments have contributed to design standards adopted by the American Society of Civil Engineers for US Pacific coastlines (ASCE, 2017), as well as for many US facilities overseas.
Challenges and Lessons Learned in Building a Modeling User Community
The main lesson of transitioning tsunami modeling applications to a wider community of users for long- and short-term forecast applications echoes one lesson from DART and SIFT implementation efforts: the importance of having a planning body and continuity of efforts following the transfer. The Tsunami Ready program (http://itic.ioc-unesco.org/index.php?option=com_content&view=category&id=2234&Itemid=2758) is now commonly used for hazard assessment model applications, and ComMIT is quickly becoming the standard requirement for the program. The ASCE-related work played a major role in standardizing the modeling applications for engineering purposes. Tweb is becoming a go-to application for quick tsunami forecast functionality with minimum development. However, all these efforts began and continued with ad hoc planning and depend on intermittent funding, which make them difficult and labor intensive. Applying the process depicted in Figure 2 would help to make all these efforts sustainable and effective contributors to the new blue economy.
Impact on Society and New Blue Economy
PMEL’s work on tsunamis has had a significant impact on society and the new blue economy by providing new science and technology to create data-driven economic opportunities (Hotaling and Spinrad, 2021). As Figure 1 illustrates, tsunami research and development led to observational and modeling products that were transferred to NOAA operations and also enhanced the possibilities for future use and development of more refined products by/for partners in the private sector and the global hazard mitigation community.
Components of the traditional blue economy benefit as suppliers of DART buoys and their maintenance, communications, software, transportation, and ship operation. DART data, the gold standard for tsunami forecast model assimilation, are free and available for use beyond NOAA and can stimulate development of specialized tsunami hazard assessment products for critical infrastructure projects and private use around the world. Nations without tsunami warning systems along with ports and nuclear power stations are among many potential new clients for such systems.
The ultimate goal is to forecast tsunami coastal flooding before the waves reach coastlines. Accurate forecasting of coastal flooding allows evacuation and eliminates the costs of false alarms (Titov, 2021). The value of tsunami flooding forecasts was evident during the very first test of the system during the 2011 Japanese tsunami when a flooding forecast, using real-time DART data, was issued for Hawai‘i six hours before flooding occurred. The technology was validated as evacuation in Hawai‘i saved lives, and the forecasts were later confirmed to be accurate at many locations (Figure 5).
The same validated modeling technology supported production of tsunami hazard maps for coastal communities in the United States through the NTHMP. The ComMIT tool, developed to build capacity for Indian Ocean nations after the 2004 tsunami, and its training program have been so successful that participants produced models for most Indian Ocean coastlines (Titov et al., 2011), and it has been extended into the Pacific, Europe, and the Caribbean to become an essential part of the global Tsunami Ready program.
Estimating the economic impact of false alarms (Bernard and Titov, 2015; Titov, 2021) is only one metric that can be measured out of many factors that contribute to tsunami impacts. Society is willing to invest in tsunami warnings and preparedness to save lives and to prevent false alarms for these low-frequency but high-impact events. Tsunami preparedness contributes to the blue economy by creating demand for alert systems, building codes, drills and evacuations, construction, and training, and it also affects local government power grids, global shipping, energy infrastructure, military preparedness, and others. The products involved in the creation of improved tsunami hazard mitigation also provide opportunities in the area of technological products. New data, standards, and modeling systems that PMEL has developed can be used to create improved and customized products for specialized tsunami mitigation applications. PMEL tsunami research results have been transformed into practical products that have yielded flooding forecasts and a preparedness system that saves lives and communities.
Conclusions
The case study regarding transferring PMEL tsunami research offers lessons for successfully transferring other technologies within and outside NOAA. Within NOAA, both DART and modeling transfers were difficult due to lack of resources, absence of tactical management to identify technical problems and resolve conflicts, and lack of “buy-in” by the receiving organizations. In contrast, transferring outside NOAA was relatively easy because the recipients wanted the technology. For DART, three generations of technology were transferred from PMEL to SAIC, while only two generations were transferred to NDBC. For the modeling transfer to NOAA’s tsunami warning centers, PMEL had to conduct two modeling transfers because the two centers operate independently with different computer systems. To overcome this incompatibility, PMEL created a web-based flooding forecast system called Tweb that may be a prototype for the unifying software that NOAA’s tsunami warning centers need to operate uniformly.
PMEL scientists and engineers persevered in these transitions because they knew their research would ultimately save lives and communities from tsunamis—and their extra push has made the world a safer place to live. However, transfers of technology require ongoing resource support as long as the technologies are in use. Future transfers within NOAA should plan for long-term support of technology maintenance and refresh along with well-established plans for the transfer processes themselves.