Full Text
Introductory courses typically provide an overview of the study program’s relevant topics, concepts, theories, and terminology. They could also help socialize students into their roles as students and future experts in the field of study. Both of these goals require a course design that supports learning of various, often fragmented, topics by connecting them meaningfully.
When students learn new concepts, they must go through a sensemaking process (Odden and Russ, 2019). This process starts when students realize that there is a gap in their knowledge, for example, when they observe something that they cannot explain. The students will then try to understand the new observation by using a new concept or theory to make sense of it. They must decide what to believe or how to merge their understanding into a coherent explanation. Sensemaking can be difficult, especially if the new concept conflicts with what the students think they understand already.
To make the most out of the sensemaking process, students need scaffolding as well as repeated exposure to a new topic and opportunities to practice the topic collaboratively. They need time to let things settle, integrate new and prior knowledge, and connect with everyday experiences (Odden and Russ, 2019). For this to work well, teachers need to know not only how to teach well in general but also what the common misconceptions in their subject are and how to address them (Shulman, 1986). We present an example from an introductory course in atmosphere and ocean physics where we redesigned the course to support students’ sensemaking process to overcome a previously identified misconception. We now use weather maps as a connecting thread, creating a cohesive and interconnected narrative that ties together various core themes.
The Influence of Earth’s Rotation on Large-Scale Circulation Is Important but Difficult to Understand
Earth’s rotation influences the large-scale circulation in the ocean and the atmosphere on spatial and temporal scales that we cannot directly observe with our own senses. Therefore, it is challenging for undergraduate meteorology and oceanography students to understand and make sense of how these processes work, especially if they lack the mathematical tools to achieve a theoretical understanding. There are attempts to give students embodied experiences (e.g., lab exercises and throwing balls while sitting on merry-go-rounds; Glessmer and de Wet, 2018), but this is not routinely part of all courses where understanding the effects of Earth’s rotation becomes important.
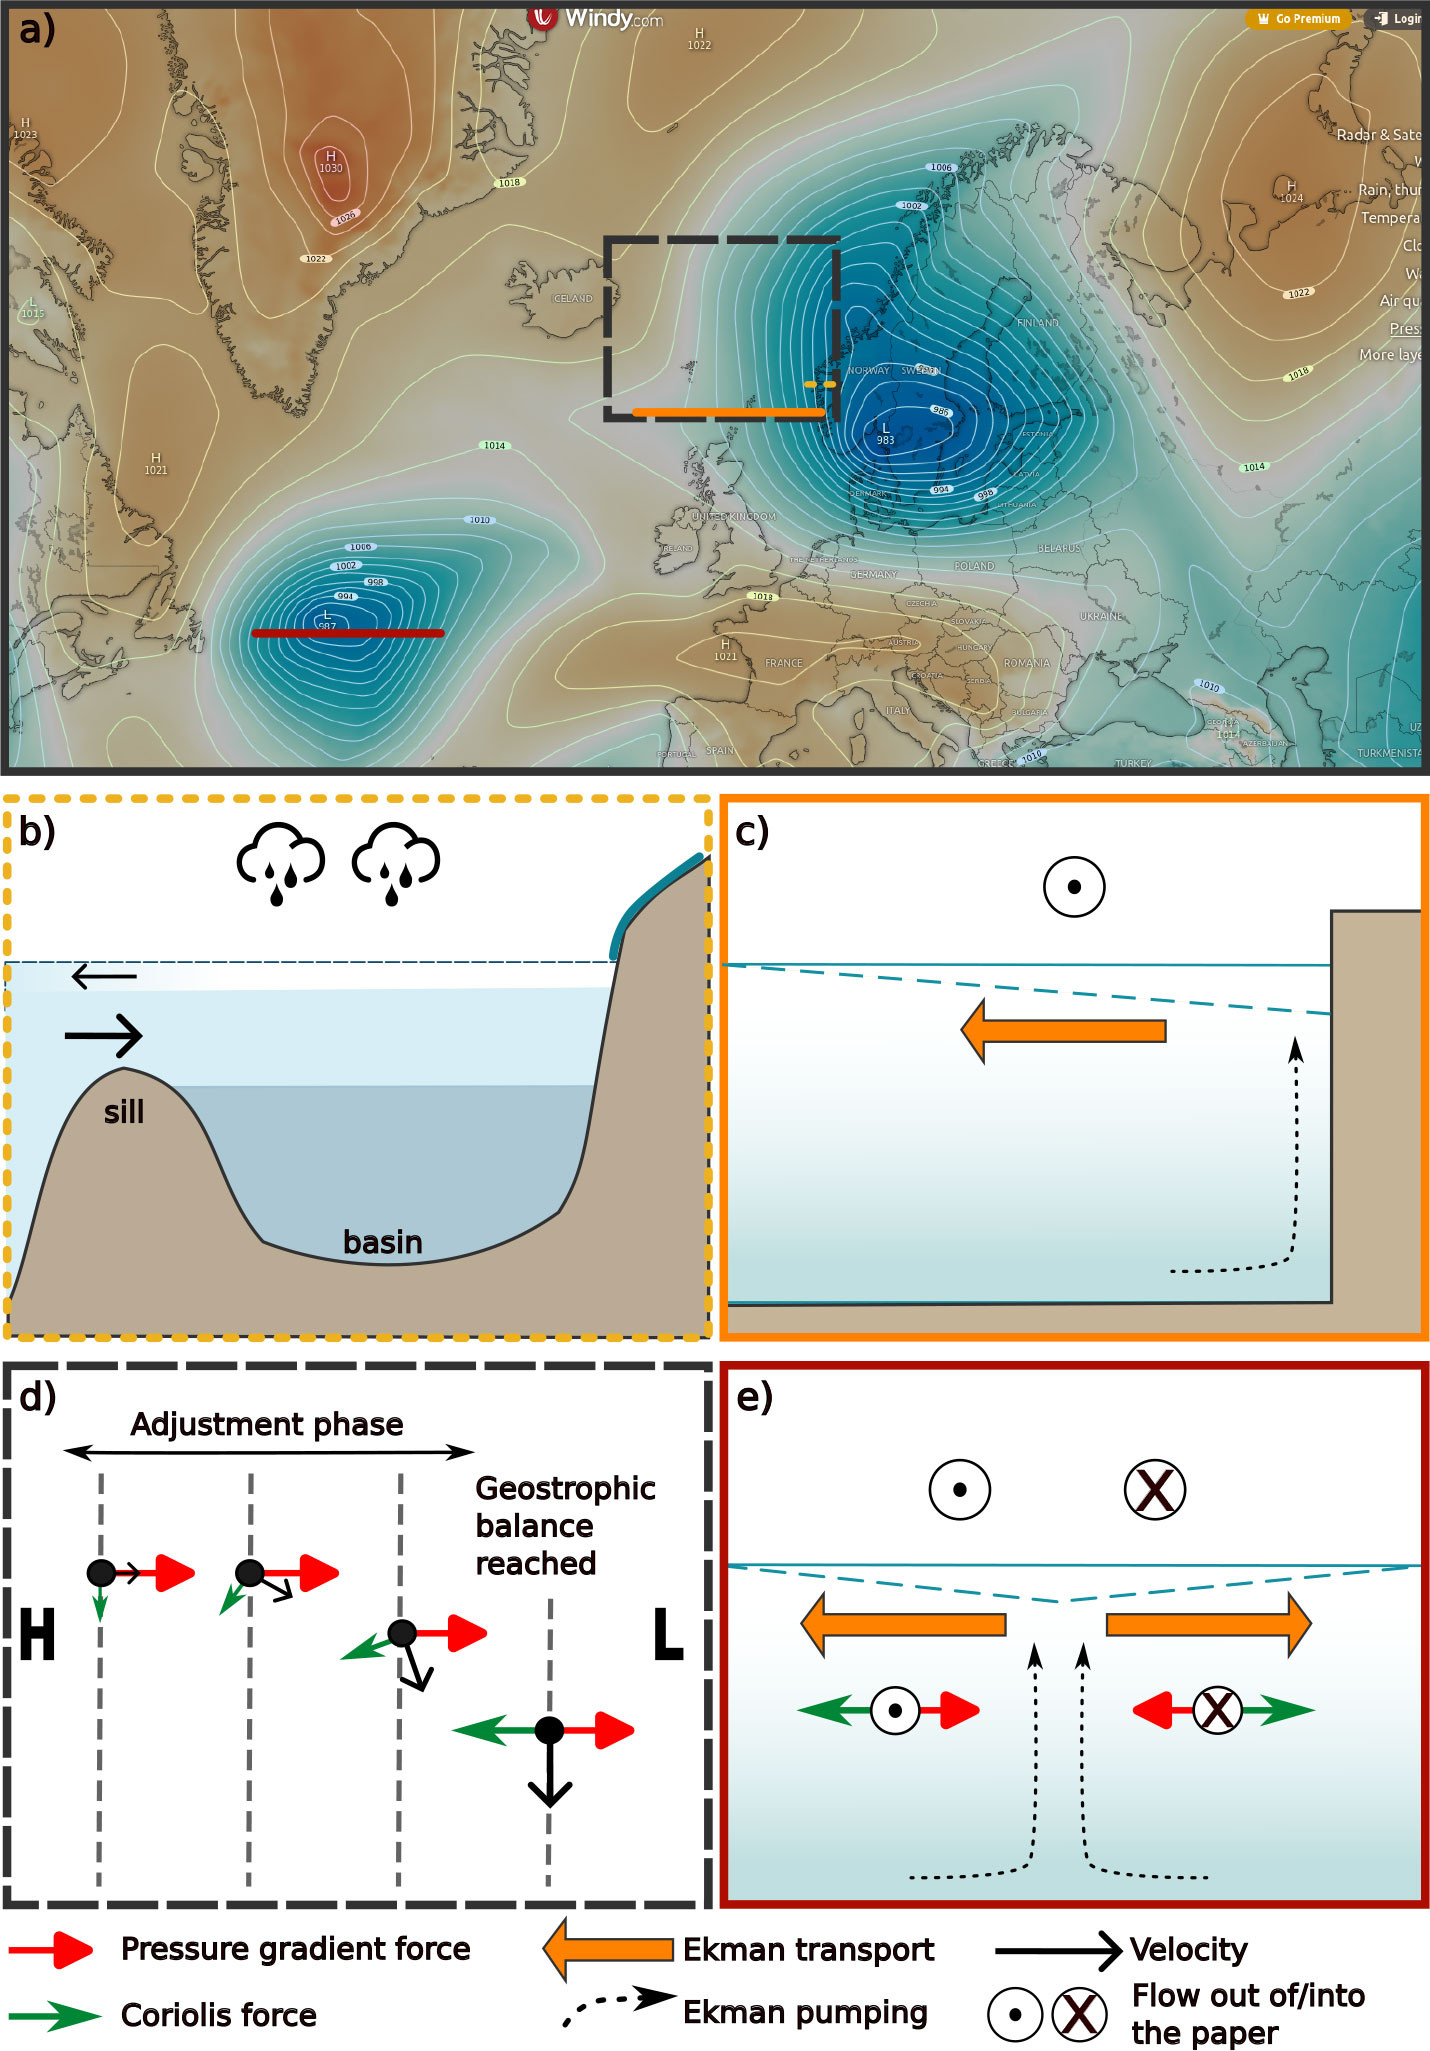
Over many years, we have observed that students can reflexively answer correctly when asked about the deflection of large-scale flows (“to the right on the Northern Hemisphere”), but this does not translate into being able to apply this knowledge (Glessmer and de Wet, 2018). For example, students often struggle to interpret weather maps and correctly identify wind directions from atmospheric pressure fields. Although students have worked with the concept of geostrophy in class by sketching how balancing pressure and Coriolis forces develop from rest toward a steady state (Figure 1d) and discussing how this leads to wind flowing along isobars, they seem not to recall this later. In subsequent learning activities, many students tend to draw arrows leading directly from high-pressure centers toward low-pressure centers and claim that the wind moves along these arrows, as it would do on smaller scales or in a non-rotating system. This misconception causes problems later during the course when students are required to correctly identify wind directions from maps in order to discuss more advanced oceanographic concepts.
|
|
Using Weather Maps as a Connecting Thread
Having identified the misconception related to the large-scale circulation, we used repeated exposure and different representations to gradually build students’ understanding of the concept and relate it to other processes (Figure 1). In particular, we introduced repeated exercises with weather maps because most atmospheric and oceanic phenomena discussed in the course can be related to a map of atmospheric pressure.
To provide us and the students with a baseline of how much they knew before and had learned throughout the course, we handed out a weather map during the first lesson, showing the North Atlantic with overlaid sea level pressure (color and contours/isobars; Figure 1a). We asked the students to estimate and compare the pressure at two marked locations, infer the local wind directions, and discuss the ocean’s response to different weather situations depicted on the map. We collected their individual responses and repeated this exercise at the end of the course with exactly the same weather map.
Throughout the course, we revisited weather maps of different regions and times and linked them to newly introduced concepts. The students also had to switch between representations, such as identifying a process from a map view and a vertical section through the ocean. When introducing the circulation in a fjord through collaborative sketching (Daae and Glessmer, 2022), we discussed the effect of varying freshwater forcing related to strong/weak precipitation and river runoff—which can be inferred from pressure systems on a map (Figure 1b). The students also connected locations of coastal upwelling (or downwelling) with large-scale winds causing offshore (onshore) Ekman transport (Figure 1c). Similarly, we used weather maps to illustrate the process of geostrophic adjustment and flow around pressure systems (Figure 1d), and the adjustment of the open ocean to atmospheric pressure systems (Figure 1e). The latter concept combines up-/downwelling with geostrophy, thus building on and extending the students’ previous knowledge.
Does It Work?
In the weather map exercise at the beginning of the course, the students mainly mentioned general atmospheric and oceanic phenomena they were familiar with from daily life, such as precipitation and sea state, and very few students identified the correct wind direction from the map considering Earth’s rotation. After the course, most students had overcome the threshold of differentiating between small and large scales and could correctly identify wind direction from weather maps of atmospheric pressure. More students also used confident language and technical terms (such as Coriolis force, Ekman transport, or geostrophy) to describe atmospheric and oceanic phenomena, and they often mentioned concepts we had linked to the weather map during the course (Figure 1). Compared to previous iterations of the course, the combination of dedicated time spent reading the weather maps in class and repeatedly connecting each new topic to the maps helped our students make sense of the various concepts and processes.
In addition to learning concepts from meteorology and oceanography, learning to read weather maps contributes to students’ identity formation as (future) experts in these fields. Weather maps are present in everyday life, and the students have many opportunities to apply their acquired knowledge when discussing the weather with friends or family, thus the students experience themselves as emerging experts.
In our context, the weather maps work well as a connecting thread, helping students make sense of and add new concepts to the bigger picture. Finding a good connecting thread that suits your context is not necessarily straightforward—we needed several iterations to arrive at the current version of our course. To find the connecting thread and support sensemaking, it is helpful to carefully consider the exact course content, the learning barriers, and the relation among the core concepts. What could be the connecting thread in your course?