Introduction
There has been considerable scientific interest in natural deep ocean submarine asphalt deposits and associated chemosynthetic communities since the 2003 discovery of Chapopote Knoll in the southern Gulf of Mexico (MacDonald et al., 2004). Similar to other marine hydrocarbon seeps, so-called asphalt “volcanoes” support prolific chemosynthetic communities (Cordes et al., 2009), with the distinction that asphalt flows also generate massive fields of hard substrate in an abyssal setting (Brüning et al. 2010; Sahling et al. 2016). Offshore energy activities potentially impact seeps and seep communities (Rowe and Kennicutt, 2008; Ramirez-Llodra et al., 2011). A more complete knowledge of how asphalt flows form morphologically complex habitat will contribute to research on recruitment and succession in chemosynthetic communities and allow energy exploration managers to avoid these sensitive habitats.
Asphalt deposits have been observed at an increasing number of locations worldwide, including in Santa Barbara Basin (Vernon and Slater, 1963; Valentine et al., 2010), the southern and northern Gulf of Mexico (MacDonald et al., 2004; Weiland et al., 2008; Williamson et al., 2008; Sahling et al., 2016; NOAA, 2017), the Angolan margin (Jones et al., 2014), and the southwest Atlantic Ocean offshore Brazil (Fujikura et al., 2017). All of these known submarine asphalt deposits are linked either to salt diapirism or to compressional tectonics. These geological processes create fractures in the sediment cover through which heavy bitumen (the heaviest and thickest form of petroleum) may migrate upward, ultimately leading to the discharge of tar-like fluids onto the seafloor (Vernon and Slater, 1963; Ding et al., 2008; Weiland et al., 2008; Williamson et al., 2008; Valentine et al., 2010; Jones et al., 2014; Fujikura et al., 2017).
The southern Gulf of Mexico asphalts are unique because they display great variability in morphology and apparent viscosity (MacDonald et al. 2004; Bruning et al., 2010). “Fresh” or recently discharged asphalts remain ductile and tend to be colonized by microbial mats, while weathering causes older material to harden and fracture (Sahling et al., 2016). To date, the southern Gulf of Mexico sites are the only known examples where complete sequences of fresh to weathered asphalt deposits can be studied to shed light on processes related to asphalt deposits located elsewhere.
Until recently, little research has focused on understanding the dynamics of asphalt volcanism (MacDonald et al., 2004; Hovland et al., 2005; Ding et al., 2008; Brüning et al., 2010). Although the formation of asphalt volcanoes likely results from a more focused and vigorous supply of asphalt than might be found at smaller and flatter submarine asphalt seeps (Williamson et al., 2008; Jones et al., 2014; Fujikura et al., 2017), the mechanisms controlling the formation of asphalt volcanoes are still debated (Bohrmann, 2014). The current understanding is that the asphalt rises through the overlying sediments in a semi-liquefied state (when cold, asphalt is highly viscous), which could explain the lava-like flow shapes observed on the seafloor (MacDonald et al., 2004; Hovland et al., 2005; Brüning et al., 2010; Bohrmann, 2014). Brüning et al. (2010) noted a novel morphology in asphalt flows, whereby some “fresh” extrusions initially exhibit positive buoyancy in seawater, then topple to form irregular stacks. These authors propose that after extrusion, the asphalt loses its buoyancy but remains sufficiently ductile to advance across the seafloor and form so-called flow fields. Large asphalt fields display fissures and fractured rubble. Taken as a whole, the morphologies of asphalt flows indicate that their physical properties range from buoyant, semi-fluid whips and plugs to deposits that are smooth and somewhat ductile, and finally to striated and fractured forms that are brittle and friable.
The precise causes for the apparent variability in the viscosity of rising asphalt remain unclear. In reporting the initial discoveries at the Chapopote site, MacDonald et al. (2004) speculated that discharges might be associated with elevated temperature; however, subsequent observations showed no anomalies above ambient seawater. This led later authors (Brüning et al., 2010) to propose that enrichment of the asphalt with lighter or gaseous hydrocarbons could decrease the density and viscosity of “fresh” discharges. A third hypothesis that involves mixing of asphalt with supercritical water (Hovland et al., 2005) is not favored due to the many assumptions it relies on and lack of supporting evidence. Thus, more than a decade after its discovery, many basic aspects of asphalt volcanism remain enigmatic. It remains uncertain whether asphalt extrusion is a slow, continuous process or occurs in pulses. Similarly, the timescales involved in the formation of the large asphalt fields are unknown.
Adding to the mystery, the morphology of an asphalt volcano and its flow fields are poorly resolved. Few images of asphalt volcanoes have been published, and those that are available show only small parts of the overall systems (MacDonald et al., 2004; Brüning et al., 2010; Valentine et al., 2010; Sahling et al., 2016). Unlike lava and mud volcanism, all asphalt volcanoes are located in deep water (between 150 m and 3,150 m) where the absence of light limits the field of view (Ludvigsen et al., 2007). While some natural tar seeps have been observed on land (Hodgson, 1987), they are generally thinner (<1 m thick) than the asphalt volcanoes found on the seafloor in deep water, where asphalt deposits are 1–20 m in height (Vernon and Slater, 1963; Weiland et al., 2008; Brüning et al., 2010; Valentine et al., 2010; Sahling et al., 2016).
Optical imagery below the photic zone cannot render clear images from more than ~5 m above the seafloor. In this regard, exploring the deep sea can be like walking around with blinkers on, where connections among details are not evident. To obtain a bigger picture of the links among seafloor geological formations under these conditions, photo surveys must be conducted over a greatly expanded scale (Ludvigsen et al., 2007; Marcon et al., 2013).
To better understand asphalt seepage on the seafloor and to provide the first large-scale view of an asphalt volcano, we visited the Campeche Knolls in the southern Gulf of Mexico in 2015 with R/V Meteor (research expedition M114). The Campeche Knolls (Figure 1) host the deepest active asphalt volcanoes (between 2,900 m and 3,150 m water depth) currently known (Sahling et al., 2016), including Chapopote Knoll, the first discovered asphalt volcano (MacDonald et al., 2004). Chapopote, named after the Nahuatl (Aztec language) word for tar, is characterized by fresh asphalt deposits and associated chemosynthetic biological communities (MacDonald et al., 2004), making it one of the youngest dynamic examples of asphalt volcanism. The presence of chemosynthetic life signals that the asphalt is still releasing light hydrocarbons such as methane, indicating that it may have extruded relatively recently (Sahling et al., 2016).
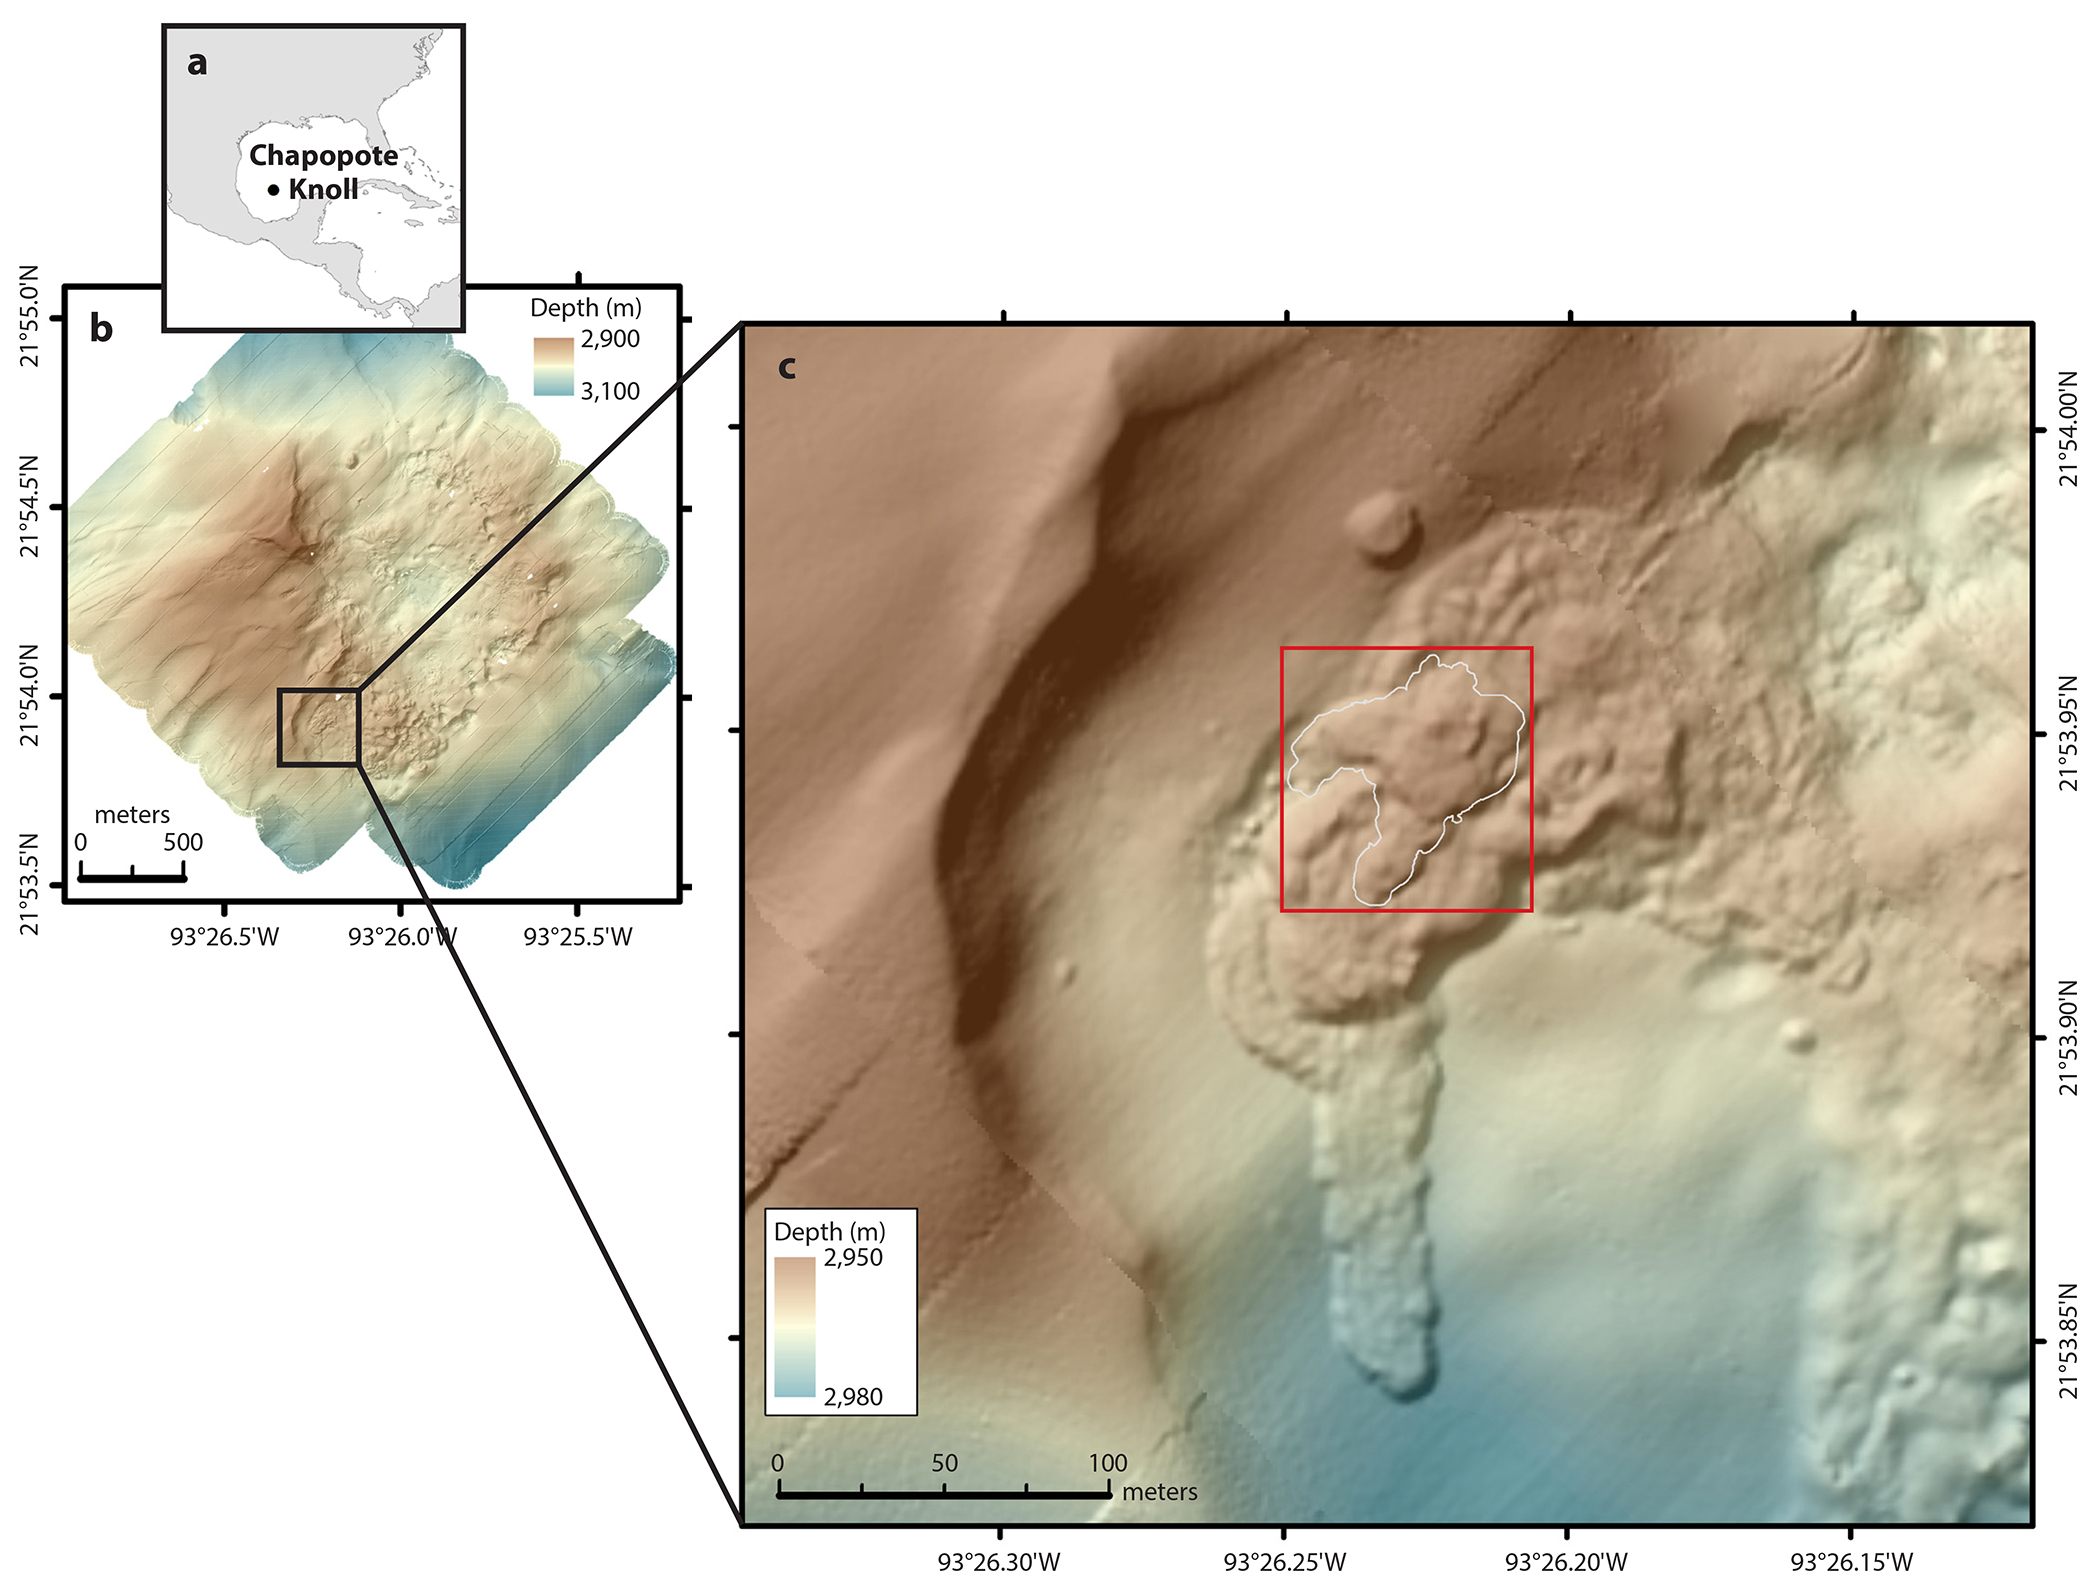
Figure 1. Location and bathymetry of Chapopote Knoll and the main asphalt field (MAF) in the southern Gulf of Mexico. (a) Overview thumbnail map, (b) autonomous underwater vehicle (AUV) microbathymetry of Chapopote Knoll, with a black rectangle locating (c). (c) Detailed microbathymetry (resolution of 1.5 m) of the study area indicates that older asphalt flows may underlie the MAF deposits. The red rectangle outlines the area discussed in Figure 4, and the white outline within it shows the extent of the MAF deposits. > High res figure
|
Methods
Bathymetry
Bathymetric data were acquired during cruise M114/1 with the autonomous underwater vehicle (AUV) MARUM SEAL 5000. The AUV was equipped with a Kongsberg EM2040 multibeam echosounder running at 400 kHz. The survey was conducted from an altitude of 80 m above the seafloor over a 1.2 km² area covering the entire Chapopote Knoll, including the asphalt flow areas. The bathymetry data were processed with MB-System (Caress and Chayes, 1995; Caress et al., 2018) and QPS Fledermaus Geocoder-Tools (FMGT). The final bathymetry map has a 1.5 m resolution (Figure 1).
M114/2 Mosaic (MAF2015)
The mosaicking surveys used in this work were conducted from a target altitude of 2.5 m above the seafloor during dives 359 (Station 97-1, GeoB 19340-1) and 362 (Station 108-1, GeoB 19351-1) with ROV Quest 4000 (R/V Meteor cruise M114/2 in 2015). The photographs were acquired with a downward-looking Prosilica GT6600 full frame photo camera with 29 megapixel (6,576 × 4,384) resolution. The photomosaic was constructed with the Large-Area Photo-Mosaicking (LAPM) tool (Marcon et al., 2013; Marcon, 2014) using a total of 999 photographs (Figure 2). All images were corrected for non-uniform illumination prior to mosaic construction using the method developed by Arnaubec et al. (2015). Mosaic georeferencing was done with the LAPM tool using ultra-short baseline (USBL) and Doppler velocity log (DVL) positioning data from the ROV. Finally, the geolocation of the mosaics was fine-tuned manually in ArcGIS in order to match the bathymetry.
Different features of the asphalt flow were classified according to visual appearance, including the main flow shapes as well as areas covered with white microbial mats. These features were delineated on the mosaic in ArcGIS 10.4. Where buried underneath younger flow units, the limits of Units 1 and 2 were identified through sharp elevation drops visible in the AUV bathymetry (Figure 1). The microbial cover was categorized qualitatively based on bacterial mat density (Supplementary Figure S1). All map projections use the WGS84 geodetic system. All areas were computed using the equal-area Mollweide projection, and distances were measured using a UTM projection. Thicknesses of different units were estimated with the AUV bathymetry map and confirmed with the ROV altitude + depth information. Approximate volumes were calculated by multiplying areas with the measured thicknesses. The MAF2015 mosaic (Figure 2) covers a total seafloor area of 3,300 m², which includes 2,640 m² of asphalt deposits. The georeferenced full-resolution mosaic can be downloaded at https://doi.pangaea.de/10.1594/PANGAEA.881388.
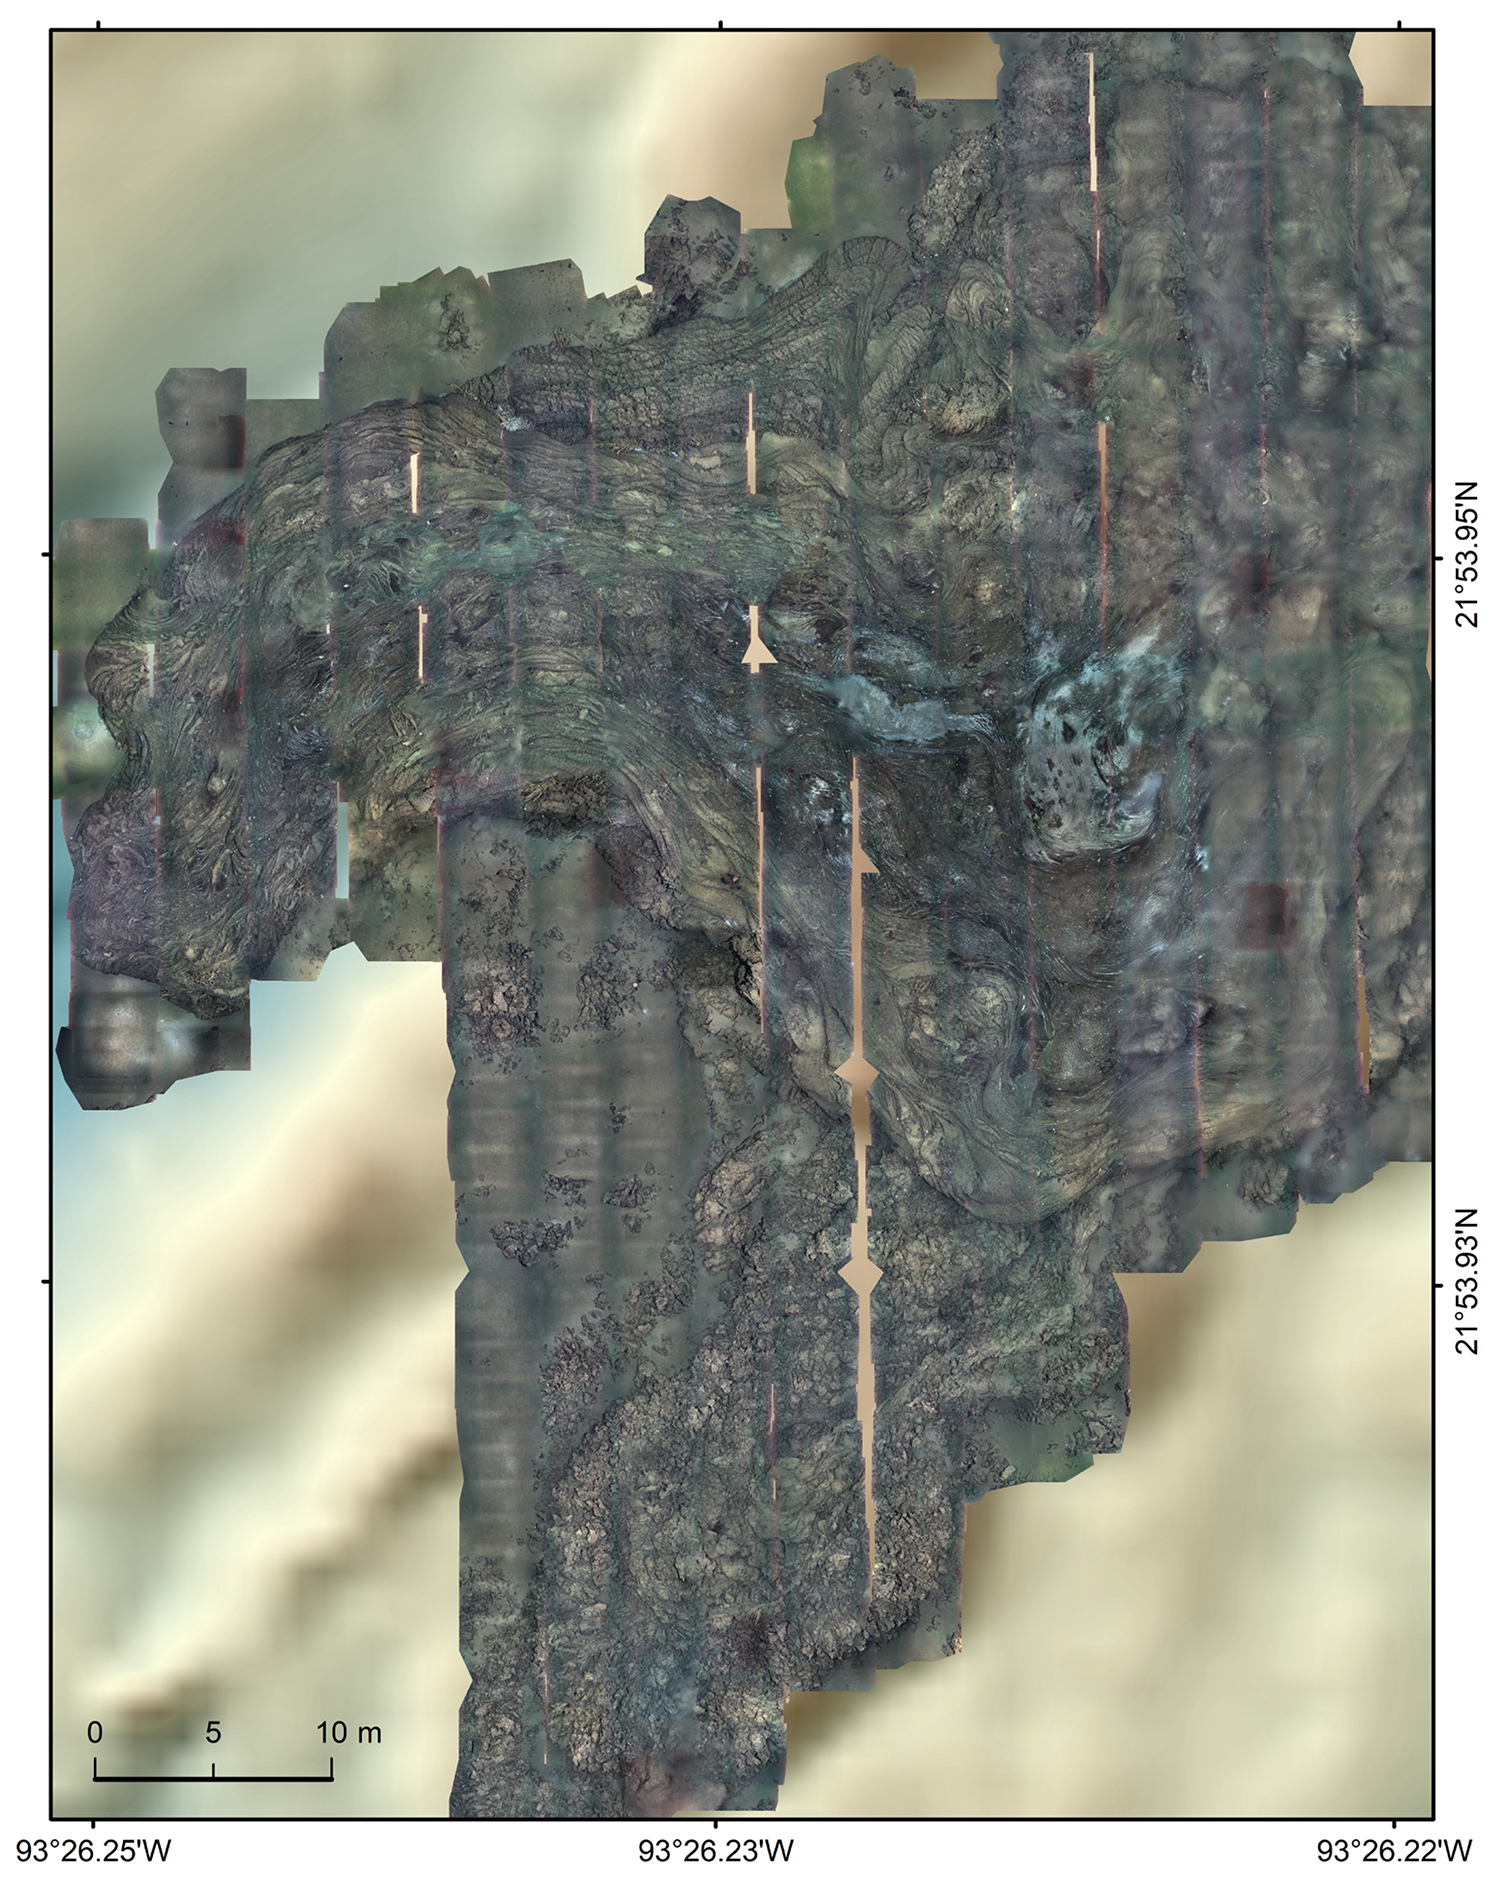
Figure 2. Photomosaic of the main asphalt field of Chapopote Knoll (MAF2015) overlain on area bathymetry. Intricate asphalt flows combine to form large flow units. The main extrusion outlet of the volcano is located beneath or close to the dense white microbial mats. The MAF2015 mosaic covers a total seafloor area of 3,300 m², which includes 2,640 m² of asphalt deposits. The photomosaic was constructed from 999 images with the Large-Area Photo-Mosaicking (LAPM) tool v2 (Marcon, 2014). The full-resolution mosaic is available at https://doi.pangaea.de/10.1594/PANGAEA.881388. > High res figure
|
M67 Mosaic (MAF2006)
In order to identify temporal changes at Chapopote Knoll, we constructed a 34 m long mosaic strip (MAF2006) using video footage acquired in 2006 with ROV Quest 4000 (cruise M67 with R/V Meteor). Brüning et al. (2010) presented a shorter (21.5 m long) version of this mosaic strip as a videomosaic. In order to include the additional images, we reconstructed the mosaic with the LAPM tool (Marcon et al., 2013; Marcon, 2014) using individual frames extracted from the video footage. An illumination correction was applied to the frames before assembling the mosaic (Arnaubec et al., 2015). The georeferencing of the MAF2006 in relation to the MAF2015 was corrected in ArcGIS Pro 10.4 using control points and a spline transformation (ESRI, 2017). The resulting MAF2006 mosaic covers a 175 m² area (Figure 3), and can be downloaded at https://doi.pangaea.de/10.1594/PANGAEA.881313.
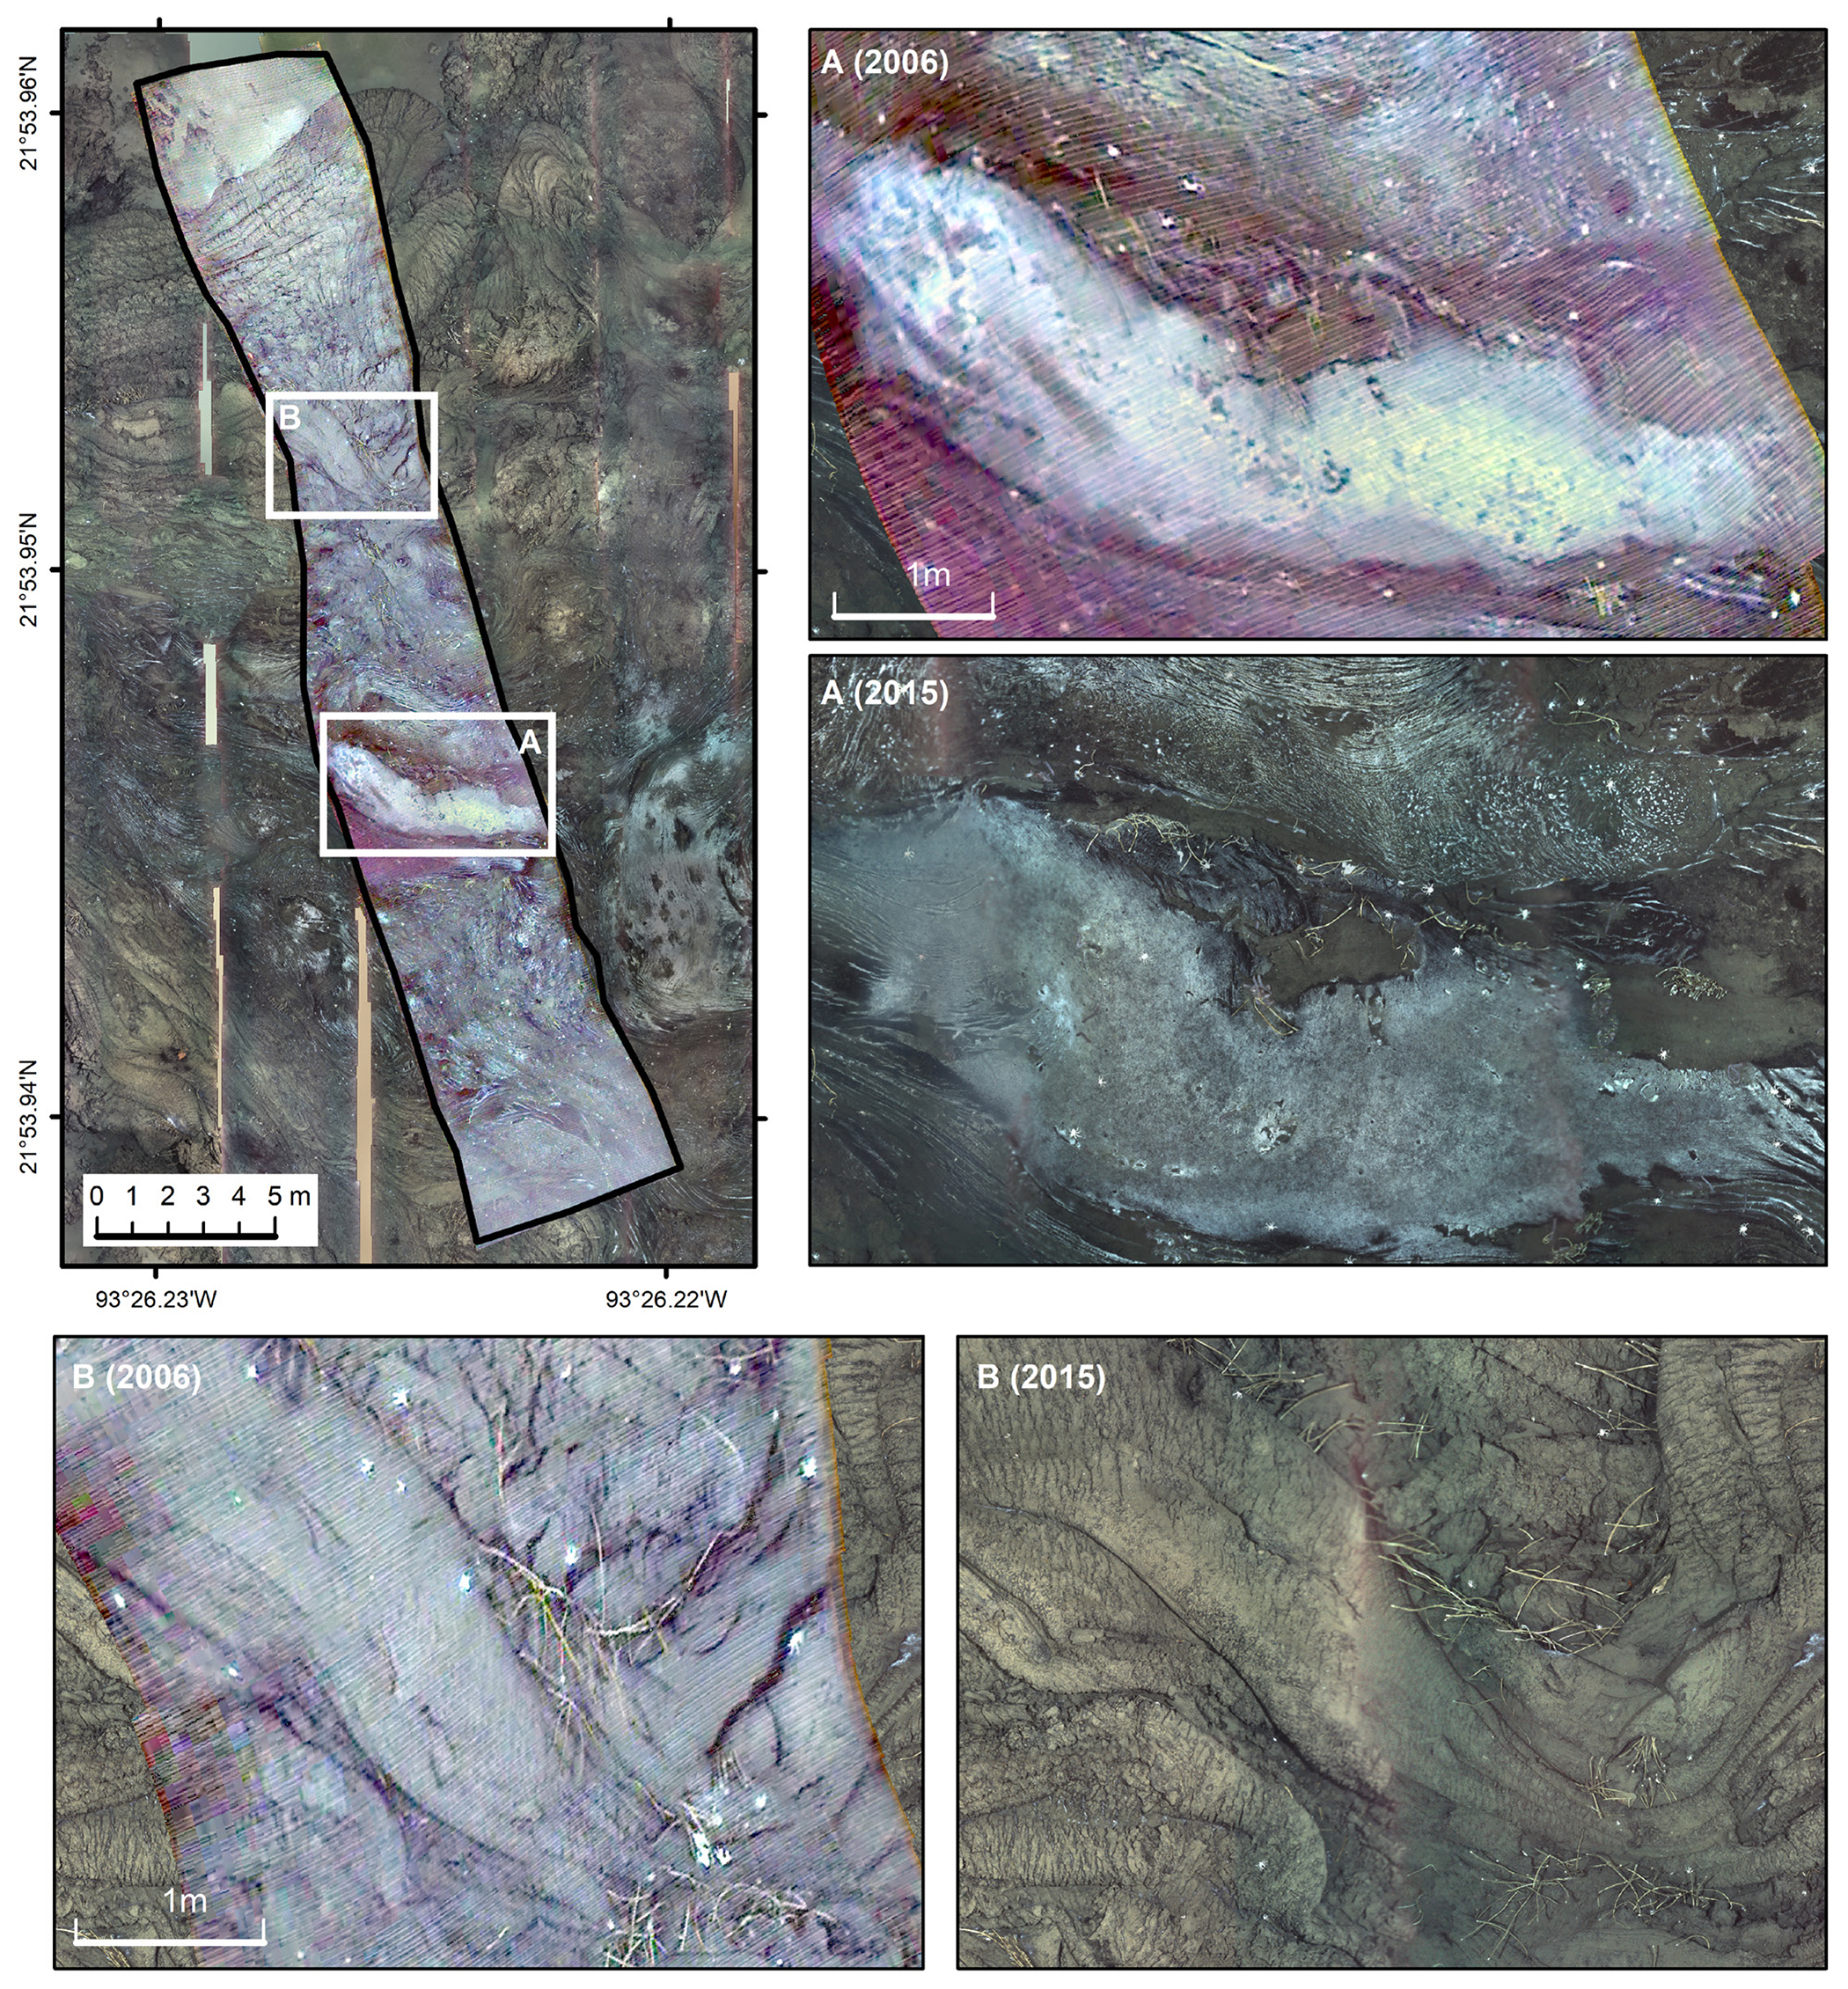
Figure 3. The main asphalt field in 2006 and in 2015. The top-left panel shows the MAF2006 mosaic strip (175 m²) overlain on the MAF2015 mosaic. The white rectangles locate the close-ups shown in A and B. There is no visible change in the area between 2006 and 2015, apart from small-scale distortions caused by the quality difference between the data sets and by the two-dimensional mosaicking process (which assumes that the scene is planar) of three-dimensional features. The full-resolution mosaic is available at https://doi.pangaea.de/10.1594/PANGAEA.881313. > High res figure
|
Asphalt Samples
In order to qualitatively assess the texture and viscosity of the asphalt in different locations of the main asphalt field (MAF), we recovered several pieces of asphalt from the seafloor (Supplementary Table S1). Depending on the texture of the asphalt, samples were collected using the ROV manipulator, the ROV drill, or gravity coring (Sahling, 2017). The sampling locations are shown on Figure 4. The latitude and longitude values of the sampling locations were corrected based on the georeferenced mosaics. The exact locations of the samples taken with the ROV were retrieved from the ROV footage and pinpointed onto the mosaic. The impact points of gravity cores on the asphalt are directly visible on the full-resolution mosaic.
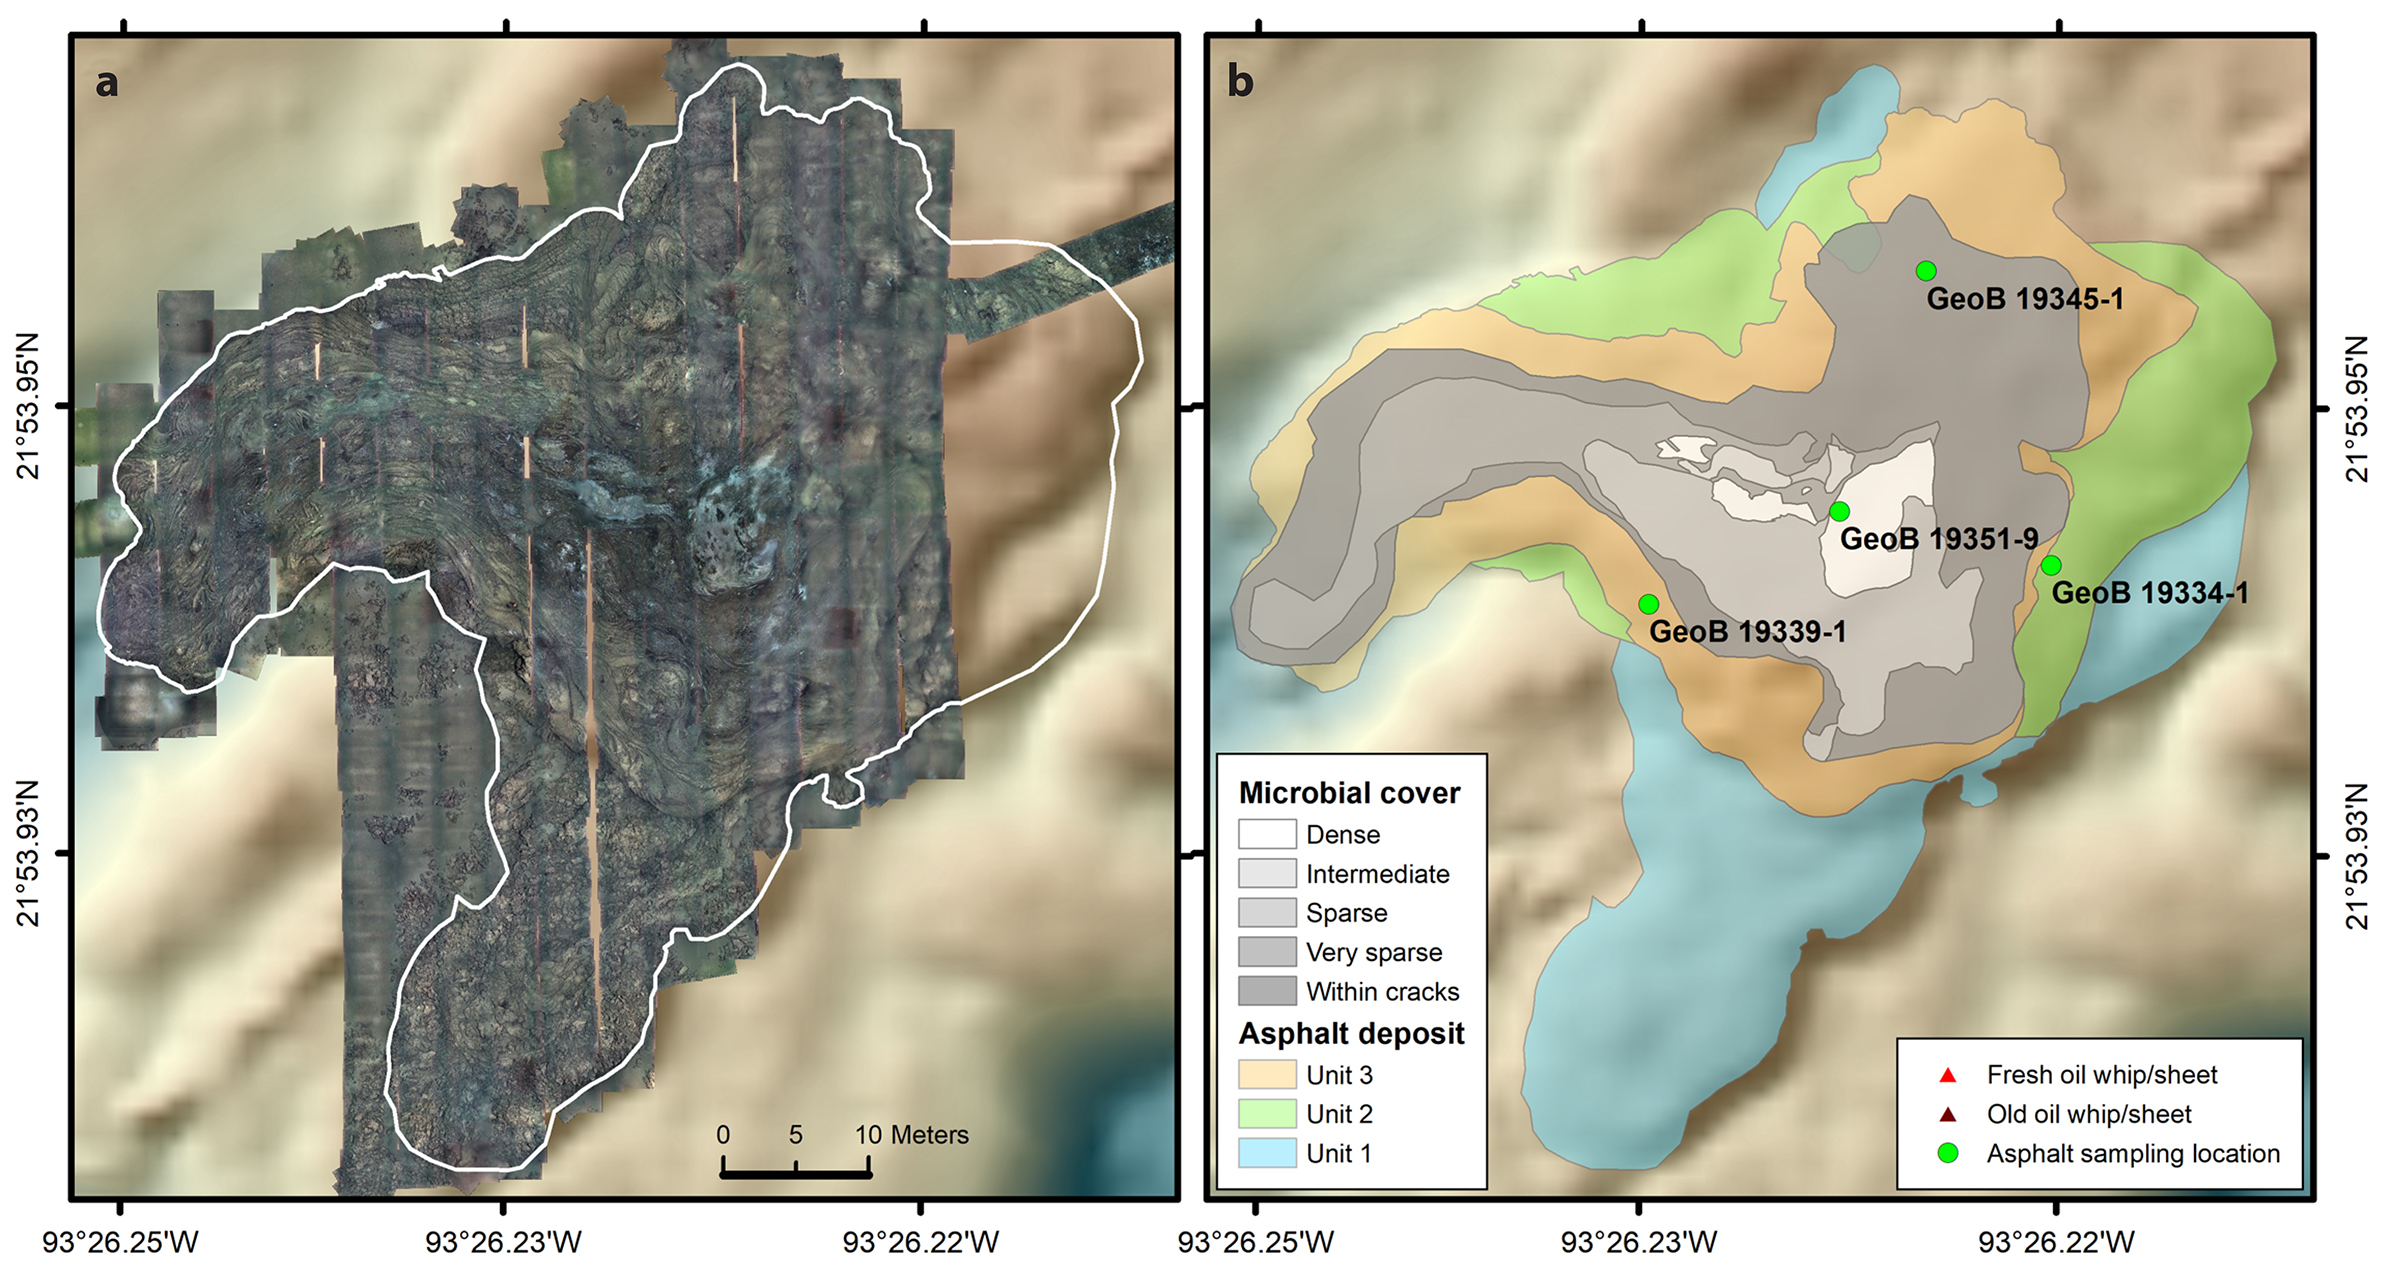
Figure 4. Photomosaic and flow units of the main asphalt field. (a) MAF2015 photomosaic overlain on area bathymetry. The white outline indicates the extent of the MAF deposits. The eastern limit of the field was inferred from the bathymetry (Figure 1) and remotely operated vehicle (ROV) footage. (b) Extent of the main asphalt units and microbial mats. Where buried underneath younger flow units, the limits of Units 1 and 2 were identified through sharp elevation drops visible in the AUV bathymetry (Figure 1). The exact sampling locations of the gravity corer (GeoB 19339-1, GeoB 19334-1, GeoB 1945-1) are known because the impact marks left by the corer on the asphalt are visible on the full-resolution mosaic. The sampling location of the ROV drill (GeoB 19351-9) was retrieved from ROV video footage. > High res figure
|
Results
The Big Picture
The MAF2015 mosaic, which covers 90% of the MAF (2,640 m²), displays a level of detail and coverage not previously achieved in such a setting (Figure 2). Unlike a traditional photo panorama, a photomosaic is assembled using very close-range images (taken from 2.5 m above the seafloor in this case). Thus, it provides a comprehensive overview of the imaged area, but retains a resolution that allows the viewer to zoom in on the image and resolve centimeter- or millimeter-sized features.
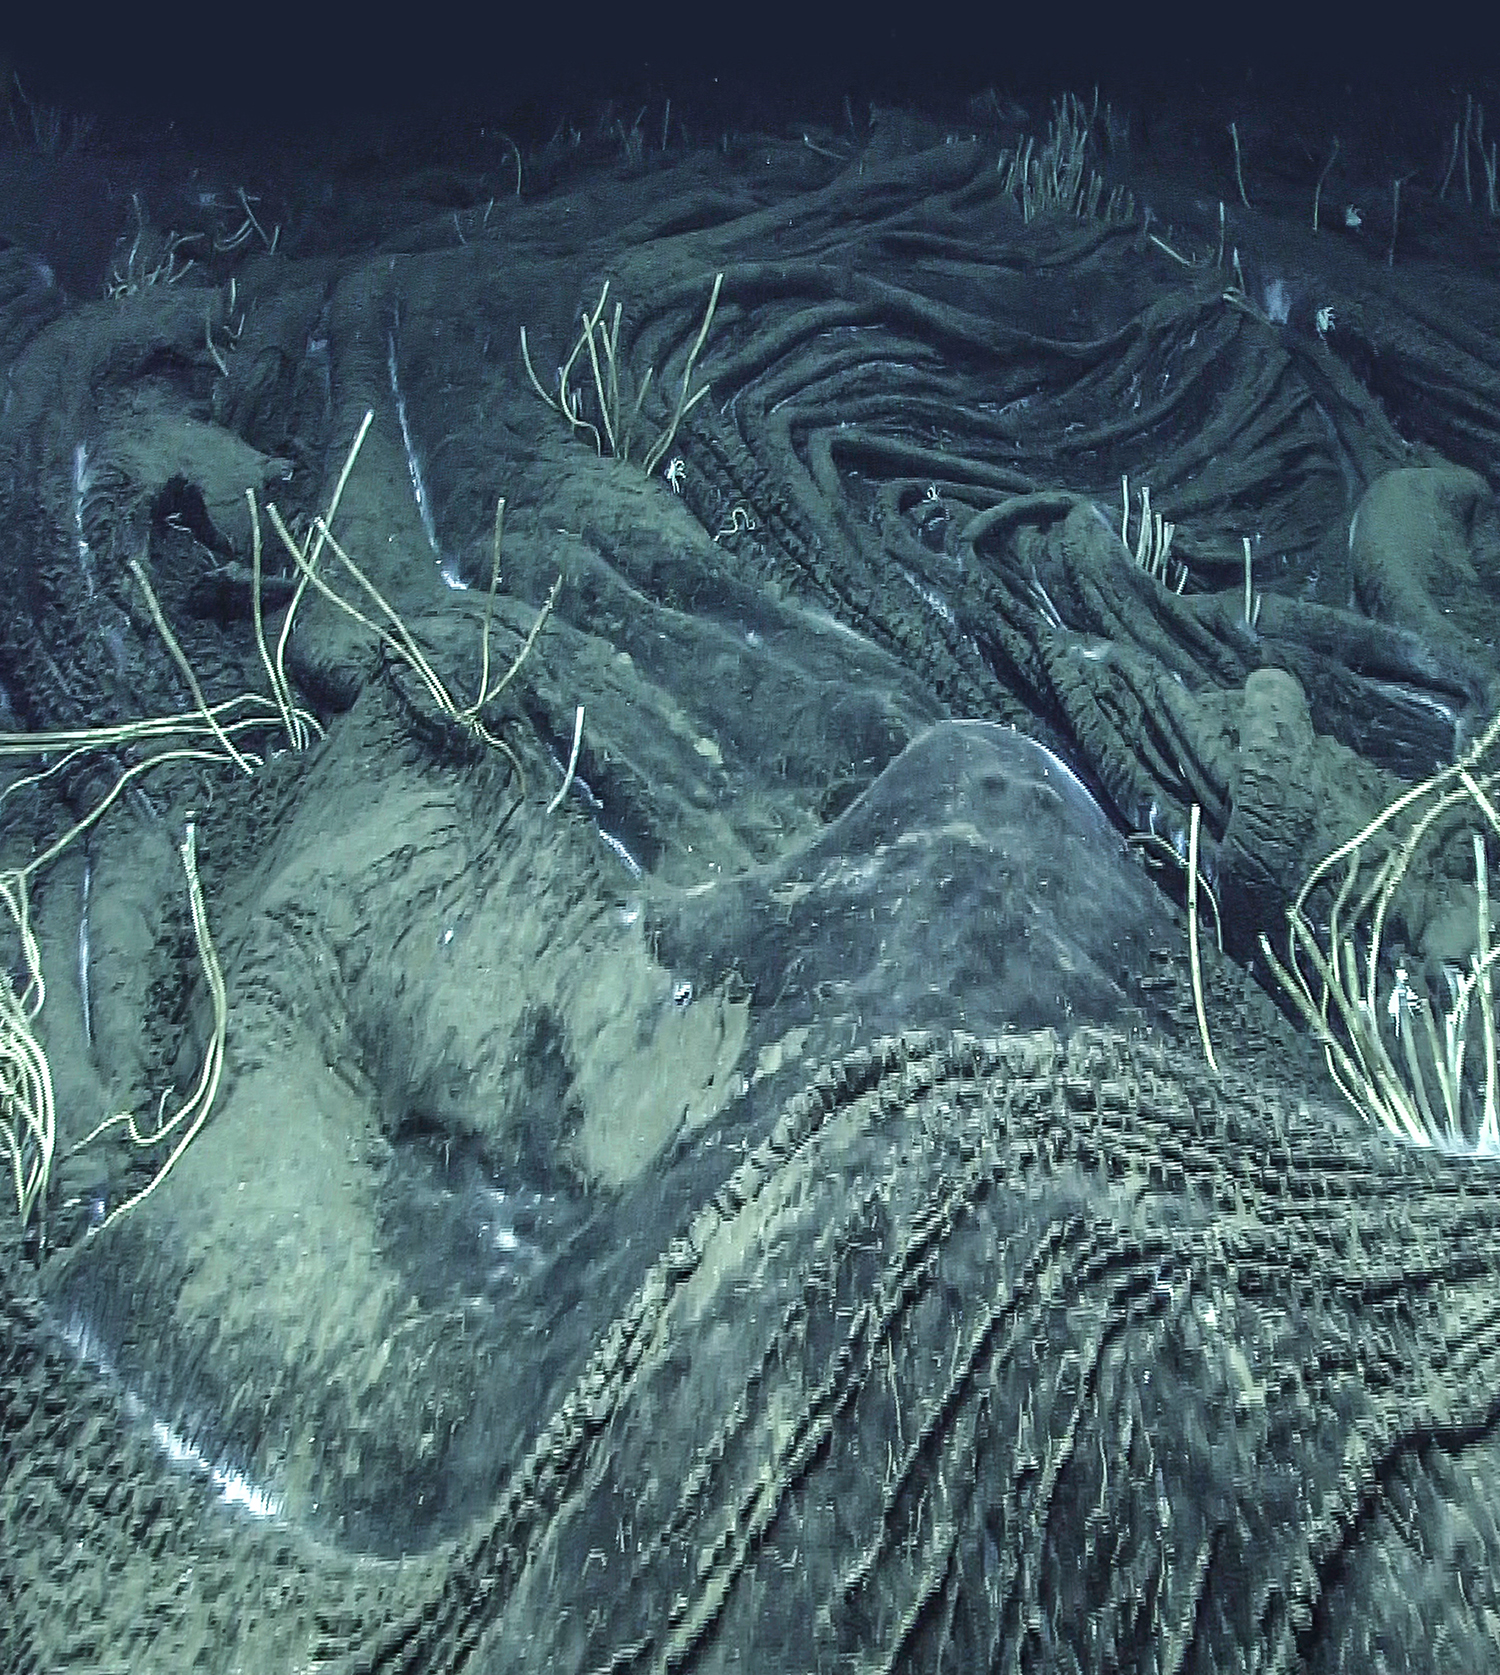
This “big picture” of asphalt volcanism shows the intricate shapes of asphalt flows and that they exhibit textures evocative of basaltic lava called pāhoehoe. Pāhoehoe is characterized by a ropy texture that occurs on the slopes of volcanoes such as those in Hawaii (Harris and Rowland, 2015). One striking observation from the photomosaic is that pāhoehoe-like asphalt flows cover larger areas than previously described (MacDonald et al., 2004; Brüning et al., 2010). Earlier surveys of the MAF identified numerous meter-scale morphologic units that had distinctive lava-like appearance. The present survey results revealed that these features were actually components of much larger flow units that displayed sequential degrees of weathering and aging (hereinafter referred to as flow units).
At least three continuous flow units form the MAF (Figures 4 and 5), two of which exhibit ropy and smooth morphologies typical of pāhoehoe flows. The youngest, least-altered deposits (Unit 3) form a smooth flow unit that stretches predominantly westward from the center of the MAF. Moving downslope from the MAF center (and apex) toward the edges, Unit 3 asphalt gradually shifts from smooth, dark asphalt to an intricate network of pāhoehoe-like flows (Figure 6). The Unit 3 deposits cover an area of approximately 1,630 m², with a thickness ranging from 0.5 m to 1 m. Unit 2, the second oldest flow unit, is characterized by fragmented, deeply fractured asphalt, in which ropy flow shapes remain markedly visible despite their weathered state. This unit covers about 1,670 m² with a thickness of 2 m to 2.5 m. The oldest deposits visible on the photomosaic (Unit 1) show highly fragmented and blocky asphalt, indicative of a much older age of extrusion than the other units. Flow shapes can no longer be discerned because of the advanced alteration of the asphalt, likely caused by the loss of lighter hydrocarbons and microbial degradation, also referred to as weathering (Brüning et al., 2010; Schubotz et al., 2011). Unit 3 deposits are about 2 m thick and cover an area of approximately 1,830 m². These three units appear to have formed as a sequence of three partially overlapping flows. The estimated volume of the whole MAF deposit ranges between 0.8 × 10⁴ m³ and 1 × 10⁴ m³. This is six and two times smaller than the volumes of the Santa Barbara basin asphalt volcanoes known as Il Duomo (5 × 10⁴ m³) and Il Duomito (2 × 10⁴ m³) (Valentine et al., 2010), and two orders of magnitude larger than the asphalt buildups (about 50 m³) described in the Puma Area of the northern Gulf of Mexico (Weiland et al., 2008).
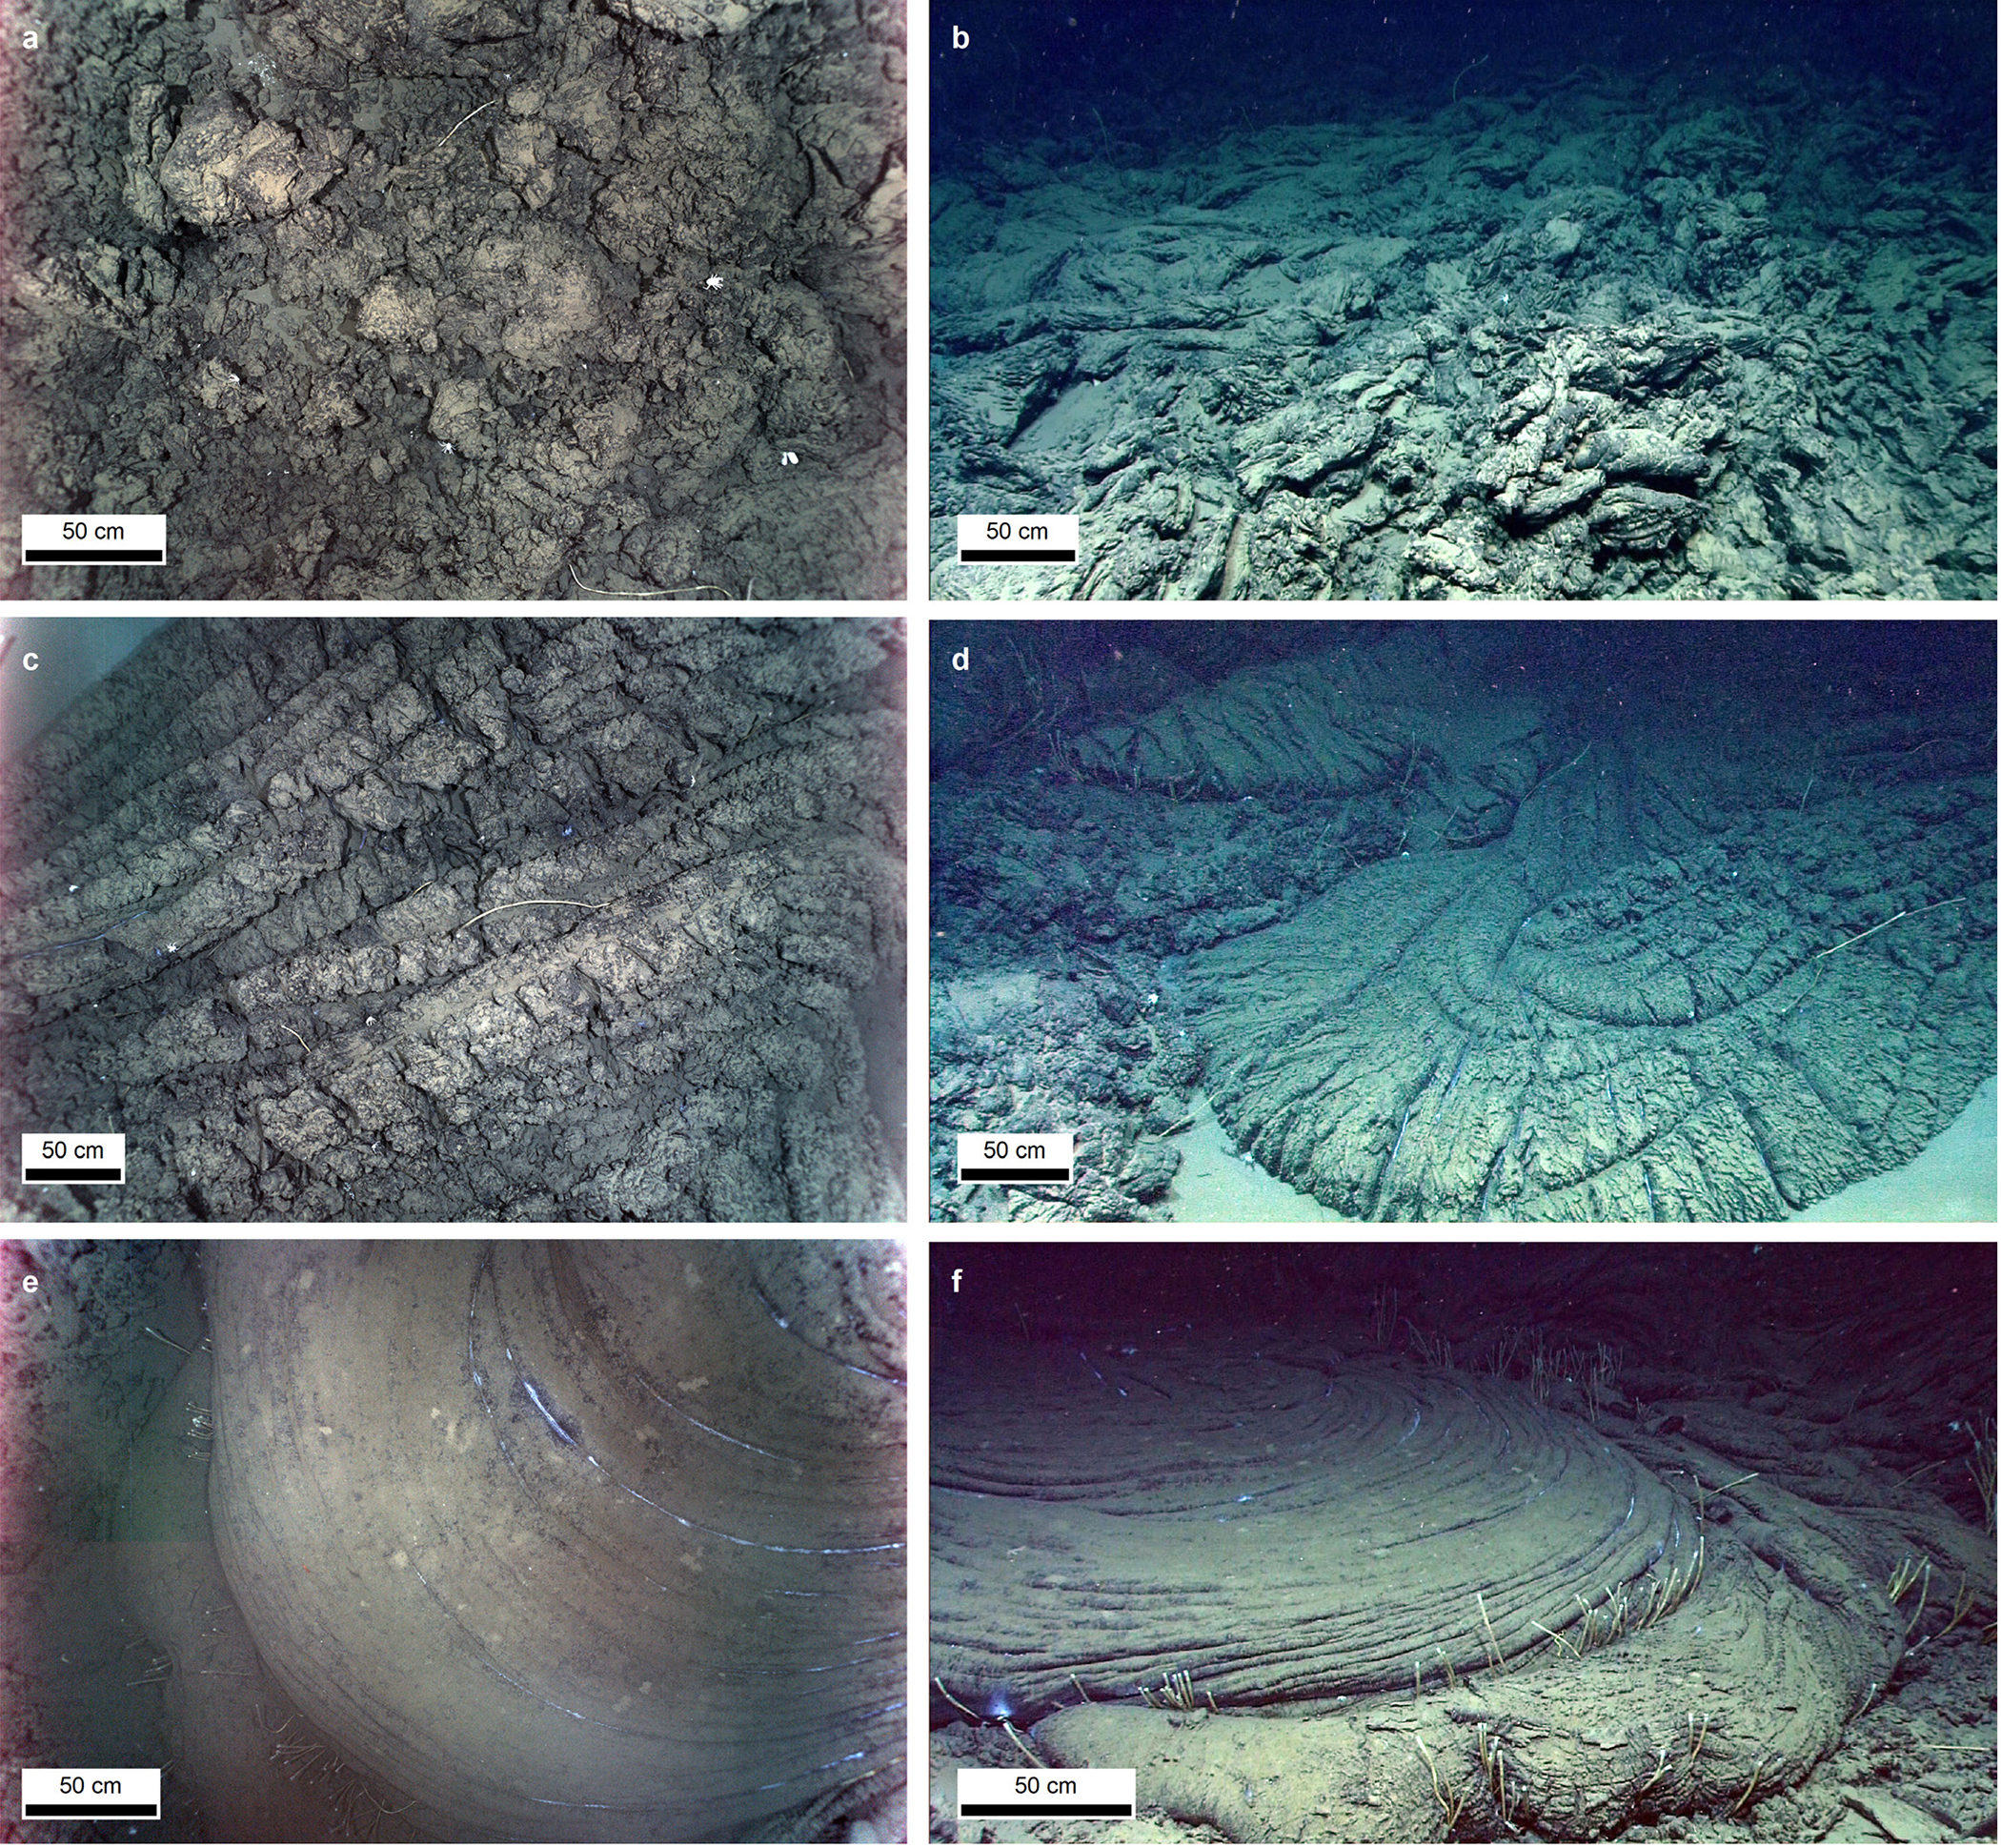
Figure 5. Illustration of the different flow units of the main asphalt field showing lava-like flow shapes. Each flow unit exhibits a very distinct level of alteration. (a) Down-looking and (b) perspective views of Unit 1 deposits. (c) Down-looking and (d) perspective views of Unit 2 deposits and flow shapes. (e) Down-looking and (f) perspective views of Unit 3 deposits and flow shapes overlying older Unit 2 deposits. The scale bars for (b), (d), and (f) apply to the foreground. Original photos taken with ROV Quest 4000, MARUM. > High res figure
|
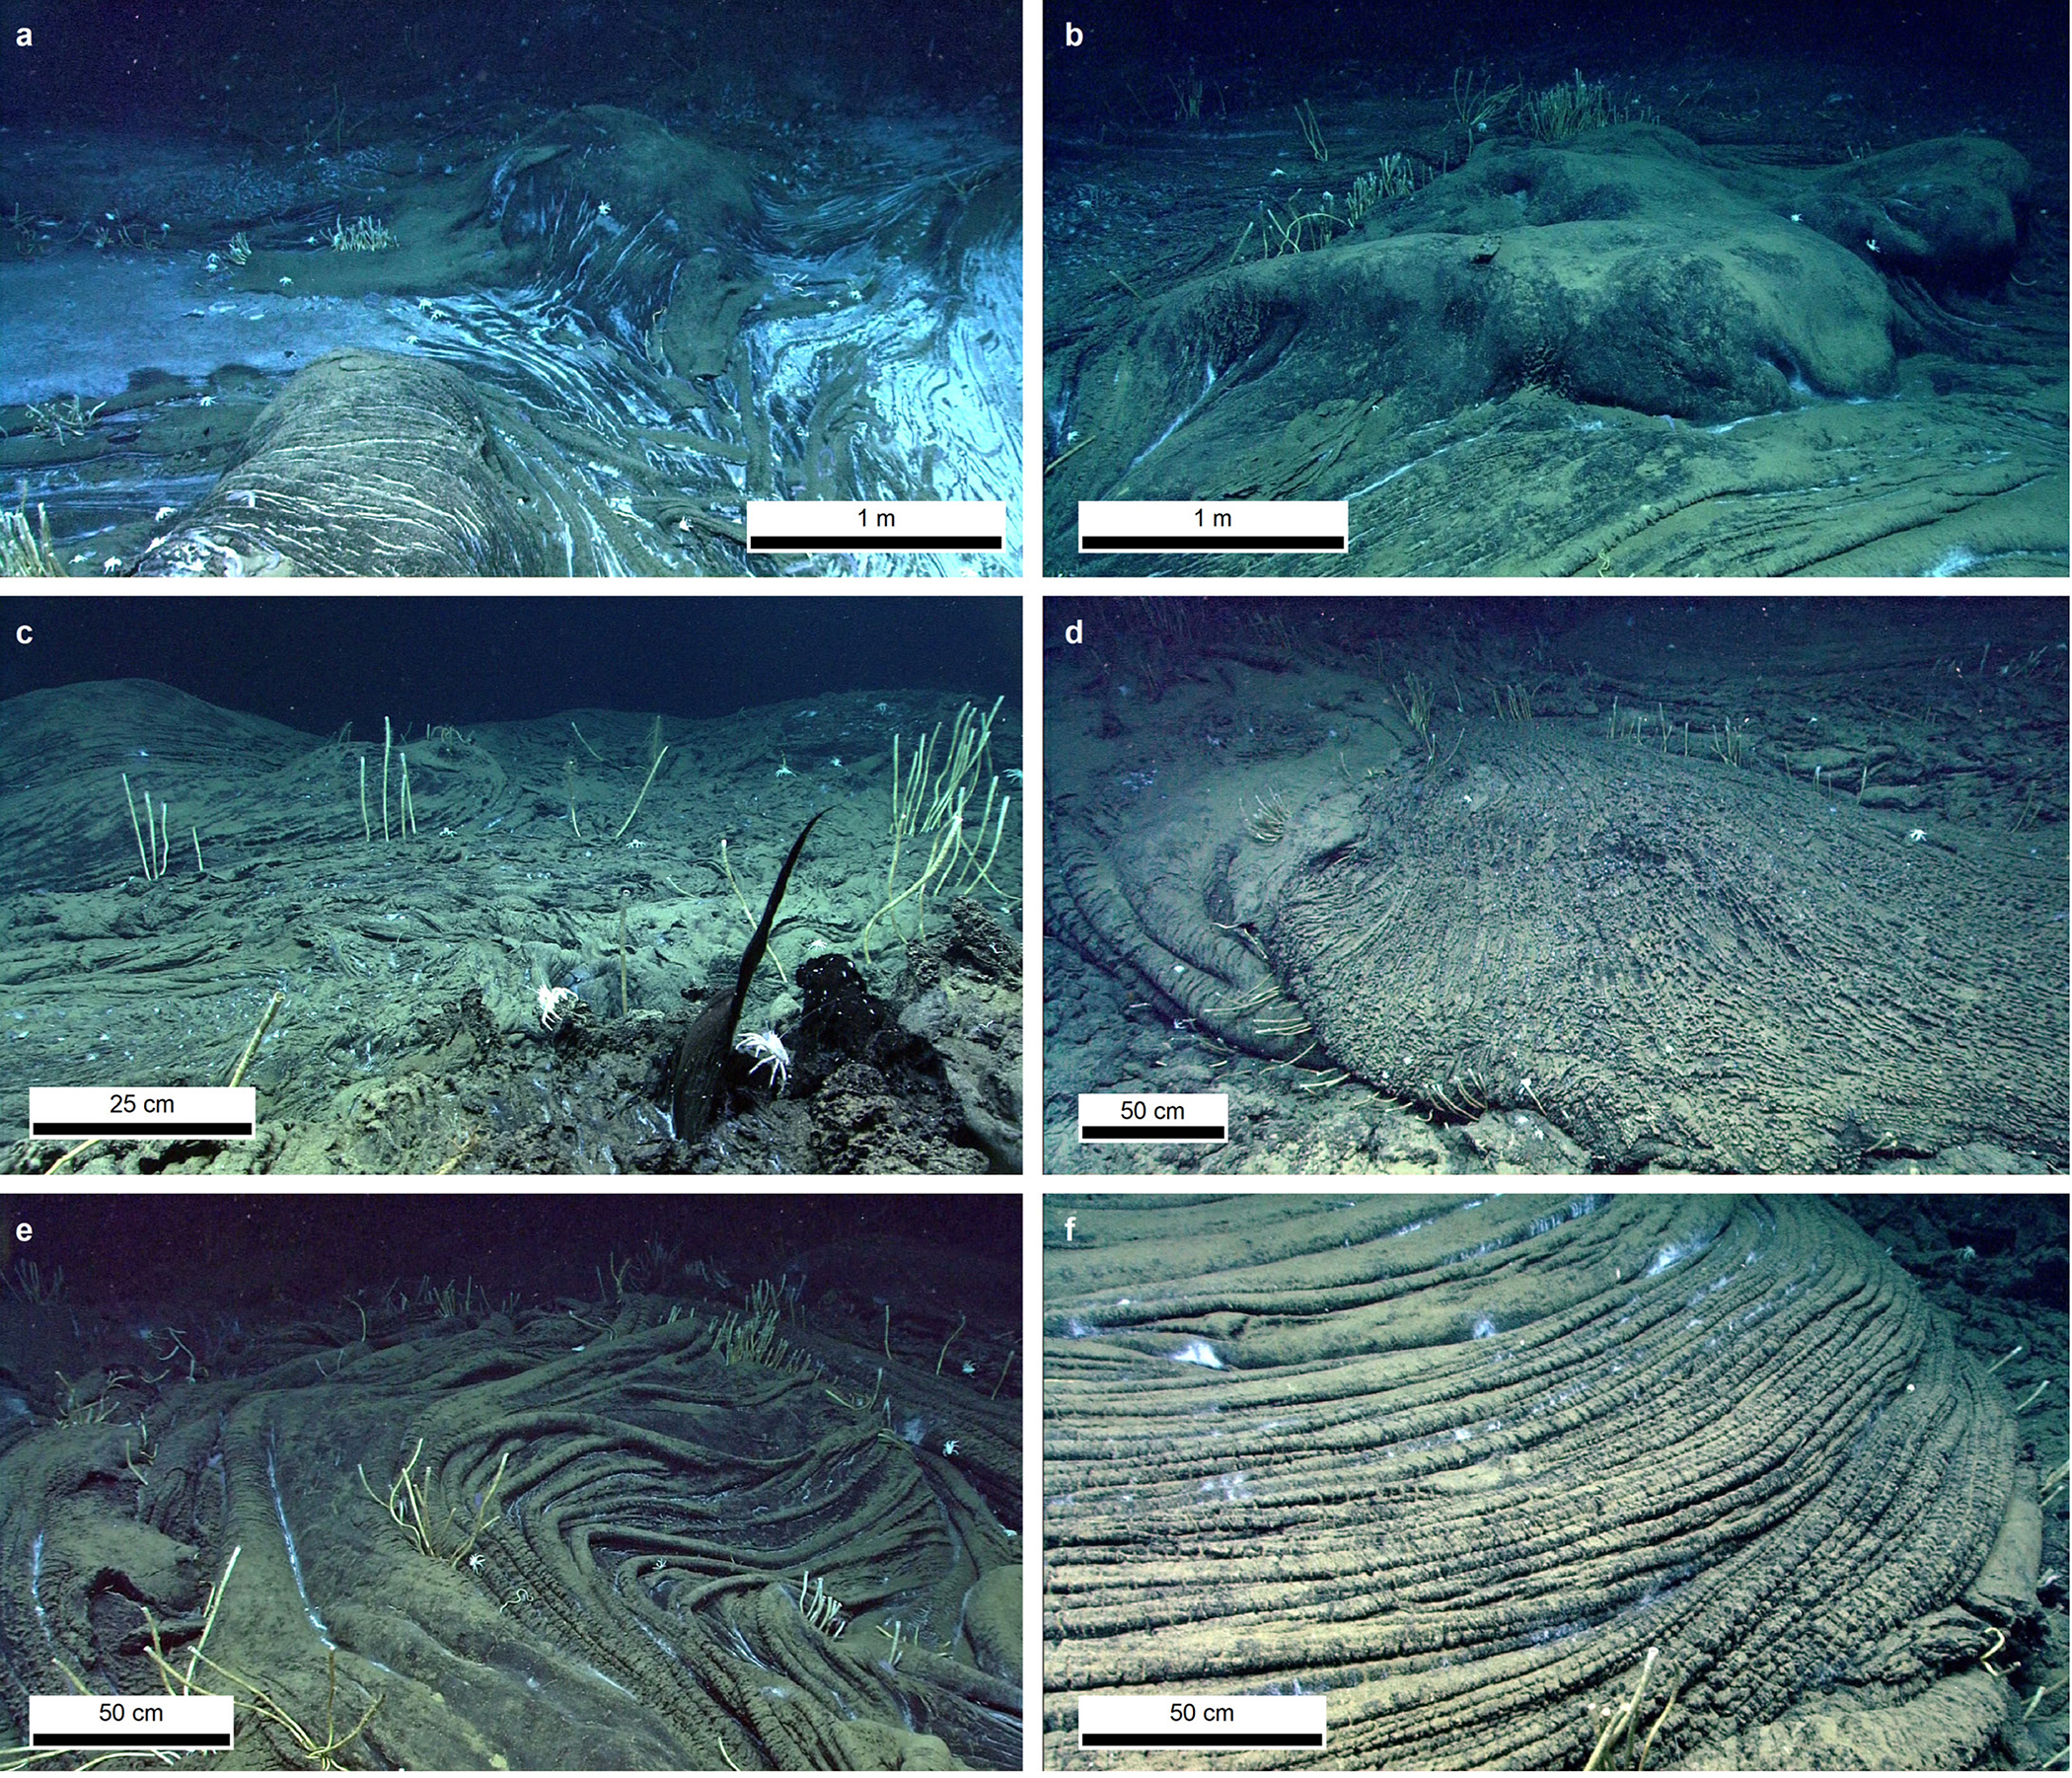
Figure 6. Close-up photos of Chapopote asphalt flow features showing (a) up-domed asphalt between dense bacterial mats, (b) dark and smooth up-domed asphalt with thin sediment cover, (c) extrusion of buoyant heavy oil, aka “oil whip” in foreground, (d) asphalt sheet flow, and (e, f) ropy asphalt. For each image, the scale bar applies to the foreground. Original photos taken with ROV Quest 4000, MARUM. > High res figure
|
White microbial mats were widespread across the MAF (over at least 1,077 m²) but occurred mostly on top of the Unit 3 deposits (Figures 4–6). The density distribution of the microbial mats reflected the age of the asphalt flows. The densest microbial mats (68 m²) were concentrated near the center of the MAF where deposits are the freshest. These mats were likely close to the main eruption outlet. Intermediate- to low-density mats were found mostly along the main flow line of Unit 3. The density of mats decreased gradually from the core toward the edges of the Unit 3 deposits, where mats were only observed within the cracks and folds of the asphalt.
Chemosynthetic and non-chemosynthetic megafauna were common across the MAF, confirming descriptions from previous work (MacDonald et al., 2004; Brüning et al., 2010; Sahling et al., 2016; Rubin-Blum et al., 2017; Sahling, 2017). Tubeworms were the main chemosynthetic organisms visible on the MAF asphalt. Some of the largest tubeworm colonies were observed between the main flow units, or at the flow margins, where weathered asphalt overlies the surrounding sediments. Mussels were not found on the MAF but were observed on some old fragmented asphalt in an area about 50–100 m to the east of the MAF where active gas ebullition occurred (Rubin-Blum et al., 2017; Sahling, 2017). The non-chemosynthetic organisms included, among others, numerous holothurians (grazing on the microbial mats), galatheid crabs and shrimp, as well as a few octopods, urchins, and anemones.
Microbathymetry data (Figure 1) collected by the AUV indicate that the asphalt units mapped in the mosaics apparently partly overlie some additional flow features, which we interpret as older asphalt deposits. However, ROV photo surveys in the area detected no visible asphalt on the seafloor, suggesting that these deposits may be buried under thick sediment cover. These older deposits indicated by the microbathymetry data were more than 3 m thick and extended as far as 90 m and 200 m, respectively, to the southwest and to the south from the outlet of the most recent asphalt extrusion. Based on the shapes of these deposits, we infer that they extend below the visible MAF units. It is, however, unclear whether these older deposits erupted from the same outlet as Units 1–3.
Discussion
Discrete Eruptions
The existence of distinct asphalt flow units is a major discovery, providing new insights into the dynamics of asphalt volcanoes. Indeed, distinct flow units imply discrete eruptive episodes, suggesting that asphalt buoyancy may not be the only mechanism controlling the eruption of asphalt onto the seafloor.
The different weathering states of the visible MAF flow units and their sequential stratification—newer units on top of older units—indicate that they result from at least three major eruptive phases and likely from additional discharges whose flow units are now covered by sediments. The exact magnitude and variability of asphalt discharges that contributed to each visible MAF unit are unknown because of the intricate shapes of the asphalt deposits and the fact that the older visible MAF units (Unit 1 and 2) were largely, although not entirely, covered by the younger ones. Therefore, it is uncertain whether each eruptive phase consisted of a single large eruption or of several small eruptions closely spaced in time. Nevertheless, our observations show that asphalt volcanism is not a continuous process in which viscous asphalt slowly seeps out of the sediments; instead, asphalt erupts during relatively short active phases separated by potentially long intervals of no activity.
A comparison of the newer MAF2015 and older MAF2006 mosaics (Figure 3) supports the conclusion that asphalt volcanism is episodic, showing no noticeable change in the seafloor between 2006 and 2015. Importantly, the shape and size of the microbial mats and of fresh asphalt flow structures remained unchanged at the end of the nine-year period, ruling out continuous seeping of asphalt.
Lava-Like Flow Mechanisms
The Chapopote flow shapes resemble several subtypes of pāhoehoe lava flows, with flow Units 1–3 representing three different levels of alteration of the same pāhoehoe flow type. This resemblance between the submarine Chapopote asphalt flows and on-land pāhoehoe lava flows indicates similarities in the effusion or discharge of asphalt and basaltic pāhoehoe lava. After eruption, the outer lava solidifies due to cooling at the surface, while the inner core remains hot and ductile. The viscosity also increases with distance from the extrusion outlet as lava cools. At low effusion rates, folding and spalling occur as the influx of hot viscous lava is slowed down by the viscosity increase of the already extruded lava and as the surface-to-volume ratio decreases due to the outer lava cooling and contracting faster than the core of the flow. These phenomena lead to the ropy structure that is typical of pāhoehoe flows (Harris and Rowland, 2015).
The pāhoehoe shapes visible on the photomosaic imply that the Chapopote asphalt flows are formed by a similar mechanism, in which the asphalt stiffens with time after extrusion from the sediments. The conspicuous ropy shapes of the asphalt indicate that, upon exposure to the bottom water, the asphalt’s viscosity and volume are altered. Like pāhoehoe lava flows, a viscosity gradient is created between the outer surface and the inner core of the asphalt, forming a rind of relatively rigid asphalt around a more ductile core. However, the mechanisms behind the viscosity changes of the asphalt differ from those at play in basaltic lava flows.
One major difference between the morphology of lava flows and asphalt extrusions is the commonly observed accumulation of stacked layers and filaments that can form prominent features across the MAF and at other asphalt sites (Brüning et al., 2010). These accumulations are initiated by the extrusion, sometimes through brittle or weathered material, of plugs of viscous, buoyant asphalt that float upright in the water while remaining cohesively tethered to the substratum due to their high viscosity (e.g., Figure 6c). Plugs can take the form of elongated drops, whips, sheets, or domes, which over time lose their positive buoyancy and slump onto the seafloor (Vernon and Slater, 1963; Brüning et al., 2010). This process has no corollary in lava morphology and is evidence that the interior of asphalt flows can remain ductile well after the exterior has weathered and hardened and the asphalt temperature has equilibrated with seawater (4°C).
The fact that asphalt remains ductile long after it reaches temperature equilibrium with seawater suggests that the viscosity gradients of the MAF flow units are not controlled by temperature, as in the case of lava. Although heat loss through exposure to cold seawater is a process that could cause rapid degassing of the asphalt and contribute to the viscosity increase, all available data suggest that the asphalt does not erupt in a hot state. Temperature measurements in the bottom water and the shallow sediments above and around the MAF revealed no residual temperature anomaly (Sahling, 2017). Ding et al. (2008) showed that the Chapopote asphalt originates from isolated shallow reservoirs located between 100 m and 200 m depth in the sediments. Based on the measured gradient of 0.065°C m–1 (Sahling, 2017), the temperatures in the reservoirs are at most 13°C higher than the bottom water temperature (4°C); hence, the temperature of the erupted asphalt is likely to be between 4°C and 17°C, which precludes the possibility of quenching effects caused by rapid cooling of hot asphalt.
Instead, the available data suggest changes in asphalt composition are the primary controls of the viscosity variations of the MAF asphalt. At least two mechanisms supporting this interpretation were identified previously: the continued loss of lighter or more soluble constituents (e.g., degassing of light hydrocarbons; Brüning et al., 2010) and microbial biodegradation (Schubotz et al., 2011). The loss of lighter hydrocarbons is supported by our observations of degassing holes in the fresh asphalt (Supplementary Table S1), as well as by the high density of microbial mats (indicative of methane release) and of buoyant asphalt plugs (Figures 4–6) in the freshest asphalt deposits. The occurrence of plugs is a sign that the inner core of the asphalt deposits is relatively enriched in lighter hydrocarbons compared to the outer rind.
The asphalt samples collected with the ROV and the gravity corer (GC) exhibited various degrees of viscosity and levels of stickiness, which provide evidence that the asphalt composition and viscosity change over time as the asphalt weathers (Supplementary Table S1). Samples from Unit 3, where flows are freshest, were ductile and sticky. In contrast, older asphalt samples from Unit 2 were solid and only slightly viscid. The oldest Unit 1-type samples were solid, very brittle, and had no residual stickiness. Finally, the longest core sample (GeoB 19345-1) confirmed that the asphalt in the deeper sections (down to 40 cm below the seafloor) of Unit 3 is softer and more viscid than the asphalt that is close to the surface. These samples verify the existence of a composition gradient in the younger Unit 3 flow between the outer layer and its core.
Flow Timescales
Freshly erupted asphalt may flow like hot basaltic lava, albeit at a slower rate. The pitch drop experiment, known as the world’s longest running experiment, showed that the viscosity of asphalt is extremely high, about 230 billion times that of room-temperature water (Edgeworth et al., 1984), which is five to nine orders of magnitude higher than viscosities of hot basaltic lava (Harris and Rowland, 2015). This high viscosity of asphalt implies that, in order to form similar pāhoehoe flow morphologies, the flow velocity of cold asphalt would have to be substantially slower than that of lava.
Assuming that heavy hydrocarbons behave as Newtonian fluids even at low temperatures (i.e., their viscosity does not depend on the amount of shear stress), we can assess the flow velocities of the visible MAF units (Supplementary Table S2) with Jeffreys’ equation for the velocity of Newtonian fluids:
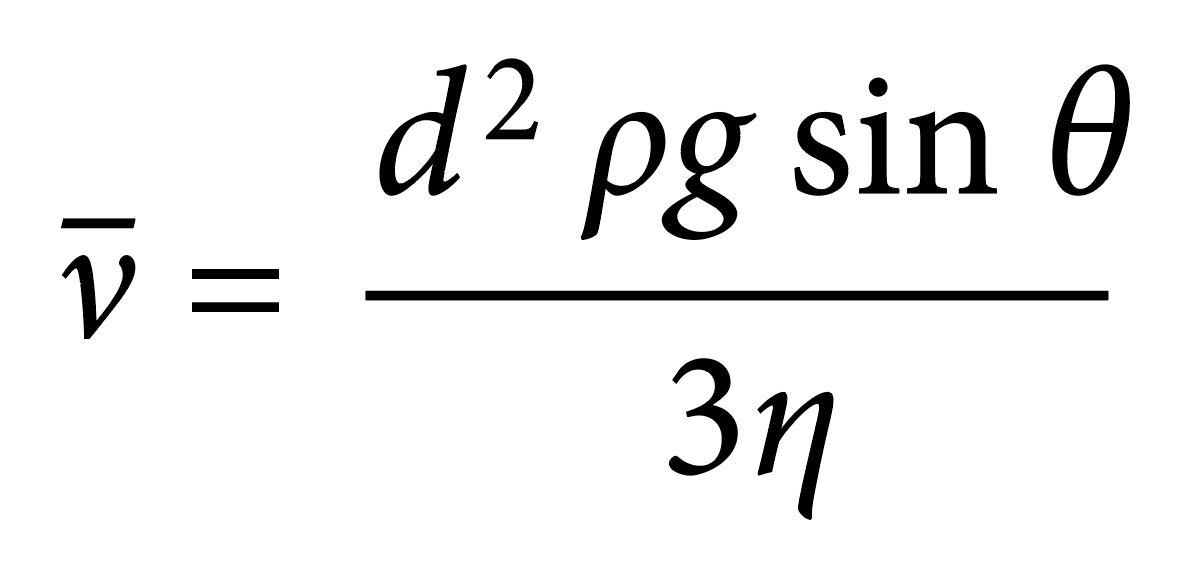
(Jeffreys, 1925; Harris and Rowland, 2015). Following the same notations as Harris and Rowland (2015), ν– is the mean flow velocity, d is the thickness of the asphalt, g is the gravitational acceleration, θ is the angle of the slope, and η is the asphalt viscosity. Using published values of pitch viscosity at temperatures ranging from 9°C to 18°C (Pochettino, 1914; Hatschek, 1928), we estimated the time required for each unit to flow to its current maximum extent (refer to Supplementary Table S2 for details of the calculations). The calculated flow durations range from a few months for the warmer asphalt (18°C) to several centuries if the asphalt is cold (9°C), which corresponds to flow velocities of 27 cm day–1 and 0.6 mm day–1, respectively. If we extrapolate the asphalt viscosity values published by Hatschek (1928) to reflect the temperature at the seafloor (4°C; refer to Supplementary Table S2 for details of the calculations), the estimates of flow duration increase by one order of magnitude, up to 1,200 years (0.1 mm day–1) for Unit 3 (Supplementary Table S2). Our calculations do not consider the exponential asphalt viscosity increase (Hatschek, 1928; Edgeworth et al., 1984) that is caused by cooling of the warmer (9°–17°C) asphalt in the cold seawater (4°C). Therefore, the duration estimates for the asphalt at temperatures between 9°C and 18°C are likely to be significantly underestimated. Also, if we consider that asphalt may not behave like a Newtonian fluid (Tia and Ruth, 1987) at low temperatures, the flow duration estimates for the cold asphalt may also be underestimated.
Our estimates of asphalt flow velocities (1.2 × 10⁻⁴ to 2.7 × 10⁻¹ m day–1) strongly depend on the temperature of the asphalt; the flow velocities of asphalt with a temperature at the time of extrusion that is close to the maximum reservoir temperature (2.1 × 10⁻² to 2.7 × 10⁻¹ m day–1 at 17°C) are about two orders of magnitude higher than those of ambient seawater temperature asphalt (1.2 × 10⁻⁴ to 1.5 × 10⁻³ m day–1 at 4°C). Unfortunately, an active asphalt eruption has never been observed so we cannot constrain the temperature range of the asphalt at the time of extrusion (4°–17°C) any further. Despite this broad range, our results indicate that flow velocities of the visible MAF units (1.2 × 10⁻⁴ to 2.7 × 10⁻¹ m day–1) were between two and six orders of magnitude lower than the published values of pāhoehoe lava flow velocities, which range from 24–792 m day–1 (Rowland and Walker, 1990).
Unfortunately, the time interval separating successive eruptions cannot be estimated from the current data available on asphalt volcanoes. However, we know that the quiet intervals are sufficiently long to enable chemosynthetic fauna to settle and thrive (MacDonald et al., 2004; Sahling et al., 2016) until the asphalt is strongly biodegraded and depleted in light hydrocarbons, or is covered by later eruptions. The recruitment and growth of chemosynthetic communities may take decades to centuries (Nix et al., 1995; Fisher et al., 1997; Bergquist et al., 2000; Smith et al., 2000). The flow units extend tens of meters from the apparent source; the slow release of light hydrocarbons from ductile interiors generate chemosynthetic habitat over time and distance. At hydrocarbon seeps, anaerobic oxidation of hydrocarbons in sediments by bacterial-archaeal consortia yields H2S (Boetius et al., 2000), which is the source of energy for the symbionts in Sibloginid tubeworms (Cordes et al., 2003). Anoxic conditions can occur either within the interior of asphalt or at the interface between asphalt flow units and underlying sediment (Figure 5f). In the Gulf of Mexico, tubeworms were commonly observed extending their tubes into asphalt fissures or under the margins of the flows where they extend out onto seafloor sediments (MacDonald et al., 2004; Brüning et al., 2010).
Analysis of carbonate radiocarbons at the Santa Barbara mounds indicates that they formed about 31,000–44,000 years ago. However, apart from one small microbial mat on top of Il Duomito, chemosynthetic organisms were not observed on the asphalt of these mounds. This indicates that the rate of light hydrocarbon release from the Santa Barbara mounds is lower than the rate at Chapopote, a sign that the MAF is younger than the Santa Barbara deposits. However, the older Chapopote deposits (below the visible MAF deposits) may have ages similar to those of the Santa Barbara mounds.
The Trigger?
The question of how much time there is between eruptions leads to the question of what triggers the eruptions. In general, the sporadic character of Chapopote eruptions implies discrete events. Because of this, asphalt extrusion seems unlikely to be controlled by the natural buoyancy of the asphalt, which would instead cause the asphalt to seep continuously from the sediment. In Santa Barbara Basin, Valentine et al. (2010) suggest that tectonic activity at the Pacific/American plate boundary controls asphalt volcanism. Unlike the Santa Barbara asphalt volcanoes, Chapopote is an intraplate site that has a different tectonic regime (Franco et al., 2013) in which fracturing of the overlying sediments related to salt movement may be responsible for asphalt eruptions. Indeed, it is known that subsurface faulting facilitates asphalt accumulation in a shallow reservoir beneath Chapopote Knoll (Ding et al., 2008), and that shallow low-intensity intraplate seismicity (5–35 km deep, M ≤ 6) related to salt tectonics regularly shakes the Campeche area (Franco et al., 2013). However, this hypothesis cannot be confirmed solely based on the data presented here, and further investigations will be required to fully understand the mechanisms at play.
Conclusion
Despite significant steps forward in understanding the formation of the Chapopote asphalt flow fields, research on asphalt volcanoes is still in early stages. In this study, we provide evidence that asphalt extrusion is not a slow, continuous process but likely occurs sporadically during phases of intensified activity. During these active periods, viscosity gradients in the extruded asphalt result in asphalt flows on the seafloor that look similar to basaltic lava flows on land. The timescales of these processes depend partly on the extrusion temperature of the asphalt (4°–17°C), which is unknown. Nevertheless, the periods separating eruption events are likely to last decades or more, allowing chemosynthetic communities to settle and thrive on the asphalt between eruptive phases.
In our view, future research on the topic should focus on constraining the age of the different flow units, identifying the asphalt weathering and alteration processes after extrusion from the sediments, and understanding what mechanisms trigger the eruptions. The imagery data presented here provide the first large-scale view of an asphalt volcano. In addition to improving our general understanding of the dynamics of asphalt volcanism, it gives scientists means to put a face on this recently discovered and little known form of volcanism. We believe imagery data to be among the best ways to communicate scientific findings to non-specialists, and we hope that our seafloor images will foster interest in this topic.