Advancing Ocean Biomolecular Observatories
Understanding and predicting ocean ecosystem changes, such as those caused by anthropogenic and climactic influences (Huntington et al., 2020), are central to the missions of both NOAA and the NOAA Pacific Marine Environmental Laboratory (PMEL). Over the past 50 years, such changes have been tracked in both the Arctic and the East Pacific Oceans through the PMEL Ecosystems & Fisheries-Oceanography Coordinated Investigations (EcoFOCI) and Ocean Carbon programs, respectively. These programs harness an array of moored instruments, CTD surveys, Biogeochemical-Argo floats, and net tows in order to understand ecosystem change (see Stabeno et al., 2023, and Feely et al., 2023, both in this issue). For the biological component of these observatories, traditional manual techniques are time intensive, expensive, and condition dependent. Thus, they are deployed in limited scope out of necessity, often only focusing on key commercial species, and are unable to provide a holistic view of ecosystem health and food web biodiversity. Over the past decade, the complexity of change in the ocean has been testing the capabilities of our ocean-observing platforms to capture and track ecosystem community dynamics. Therefore, there is an urgent need to scale ocean biodiversity monitoring efforts to better capture ecosystem responses to rapidly changing ocean conditions.
Recent advances in environmental DNA (eDNA) approaches, driven by the sequencing revolution, provide a powerful new suite of biomolecular ocean observations to characterize marine biodiversity (Beng and Corlett, 2020). The ability to detect biota, from microbes to mammals, from a single liter of seawater provides a promising tool for scaling up monitoring efforts. In response, the NOAA ’Omics Working Group developed a cross-NOAA strategic plan for ’omics (NOAA, 2021) that focuses on tool development (Goodwin et al., 2020) to advance and operationalize eDNA approaches for marine biodiversity observations in support of core NOAA mission objectives. This plan highlights the need to enhance eDNA metabarcoding approaches for surveying ecosystem biodiversity. Additionally, a national eDNA strategy is being developed to promote the coordination of eDNA use for management purposes across federal agencies (Kelly et al., 2023). Although tremendous advancements in eDNA metabarcoding have been made since its first marine application (Karsenti et al., 2011), a suite of challenges must be surmounted to effectively deploy this tool.
“Ensuring accurate and robust data processing, analysis, and visualization of captured sequences is fundamental to operationalizing eDNA for ocean biomolecular observations.”
|
Current Efforts of the PMEL Ocean Molecular Ecology Group
To assess and predict how rapidly changing ocean conditions influence marine ecosystems at scale, the Ocean Molecular Ecology (OME) group at PMEL pairs biomolecular observations with data from EcoFOCI, Carbon, and Earth-Ocean Interaction observing platforms. Such ’omics monitoring efforts (Galaska et al., 2023, in this issue) are important for establishing ecosystem baselines, providing holistic biodiversity monitoring needed to track and predict the effects of changing ocean conditions on species distribution, abundance, and food web dynamics. Metabarcoding, applied to both eDNA and traditional bulk plankton tows, is a critical tool for this effort so that species assemblages can be characterized through the sequencing of select marker genes from a mixed community of organisms.
Improving Biomolecular Approaches to Address Limitations
Recently, substantial advancements have been made in biomolecular approaches to facilitate robust application of eDNA for marine biodiversity observation. Although eDNA metabarcoding provides tremendous promise for scaling up the spatial and temporal resolution of marine surveys, a suite of challenges needs to be addressed to ensure effective implementation.
Over the past decade, NOAA scientists and others have led the development of quantitative eDNA metabarcoding frameworks, improving our ability to delineate signal from noise and generate robust abundance estimates needed to address key NOAA objectives like stock and ecosystem assessments (Shelton et al., 2023). Over the next decade, efforts are needed to improve such mechanistic frameworks by better characterizing both eDNA dynamics (i.e., fate, transport, and species-specific characteristics) and laboratory biases (i.e., subsampling and amplification efficiencies) to more accurately and consistently derive abundance estimates (Rourke et al., 2021; Takahashi et al., 2023). Further, given the effect of methodology on observed biodiversity, the NOAA ’Omics Strategic Plan (NOAA, 2021) highlights the need to harmonize sampling and analysis processes to mitigate inter-lab variability and allow for integrated eDNA assessments. Ongoing intercalibration efforts, with data management guidelines including standards, will allow NOAA to leverage the unique spatial and temporal resolution of marine biodiversity assessments across line offices and ocean basins.
Critical to the efficacy of eDNA approaches is marker gene selection and curation of robust reference databases, allowing for the accurate taxonomic identification of species. Both of these challenges are inherently linked as primer design for target genes relies on available reference data. Over the past three decades, systematic efforts have developed and supported microbial reference databases, with the SILVA small subunit rRNA 16S marker database currently representing over 510,000 unique taxa at 99% sequence similarity (Glöckner et al., 2017). In the past two decades, significant progress has been made with the sequencing of a wide diversity of metazoan life (e.g., Census of Marine Life, Barcode of Life Database) and development of a broad array of marker genes to identify target organisms (e.g., review by Takahashi et al., 2023). However, extensive metazoan reference barcoding efforts have been deployed in only a few regions for a handful of marker genes, and are particularly biased to vertebrates (e.g., Bemis et al., 2023). Despite 243 million sequences available in the National Center for Biotechnology Information (NCBI) nt (nucleotide) database covering ~273,000 metazoan species, only a small fraction of the total diversity of life is represented, and there is still a significant need to improve sequence databases through dedicated reference barcoding efforts.
REVAMP
Ensuring accurate and robust data processing, analysis, and visualization of captured sequences is fundamental to operationalizing eDNA for ocean biomolecular observations. Given that disseminating ’omics data in a timely manner is a primary goal of the NOAA ’Omics Strategic Plan (NOAA, 2021) and central to NOAA’s mission, the development of robust and accurate tools to streamline ’omics data processing and visualization is integral for the routine deployment of eDNA approaches in ocean observatories. To relieve the data analysis bottleneck delaying data dissemination, there have been substantial efforts to streamline and standardize the bioinformatics methods for metabarcoding tools, with successful pipelines developed (e.g., Tourmaline [Thompson et al., 2022], Anacapa [Curd et al., 2019]). Although these tools have greatly improved sequence processing, there remains a need for bioinformatic pipelines to provide fully integrated data exploration, visualization, and hypothesis generation capabilities. To address this challenge, we present Rapid Exploration and Visualization through an Automated Metabarcoding Pipeline (REVAMP), which provides streamlined end-to-end data processing from raw sequencing data files (fastq format) to data visualization. This pipeline rapidly explores and analyzes ecological patterns in metabarcoding data in a reproducible and accurate manner.
The REVAMP repository, with extensive documentation and example files, can be found on GitHub: https://github.com/McAllister-NOAA/REVAMP. A detailed explanation of the REVAMP workflow has been provided with the REVAMP documentation (v.1.0.5 software release available at https://doi.org/10.5281/zenodo.8195015). Briefly, the REVAMP workflow (Figure 1) recovers unique amplicon sequence variants (ASVs) by processing raw reads through Cutadapt (Martin, 2011) and DADA2 (Callahan et al., 2016). Taxonomy is then assigned based on the common ancestor of the best BLASTn hits in the NCBI nt database (Camacho et al., 2009). Alternatively, REVAMP can integrate the output of SILVAngs, which is highly effective for microbial assignments to a curated taxonomy (Glöckner et al., 2017). Data exploration and visualization are an integral part of the REVAMP pipeline, as these play an important role in pattern observation and hypothesis generation for follow-up testing. Integral software for generating the figures produced by REVAMP include KRONA plots (Ondov et al., 2011), phyloseq (McMurdie and Holmes, 2013), and vegan (Oksanen et al., 2020), among others (see GitHub repository).
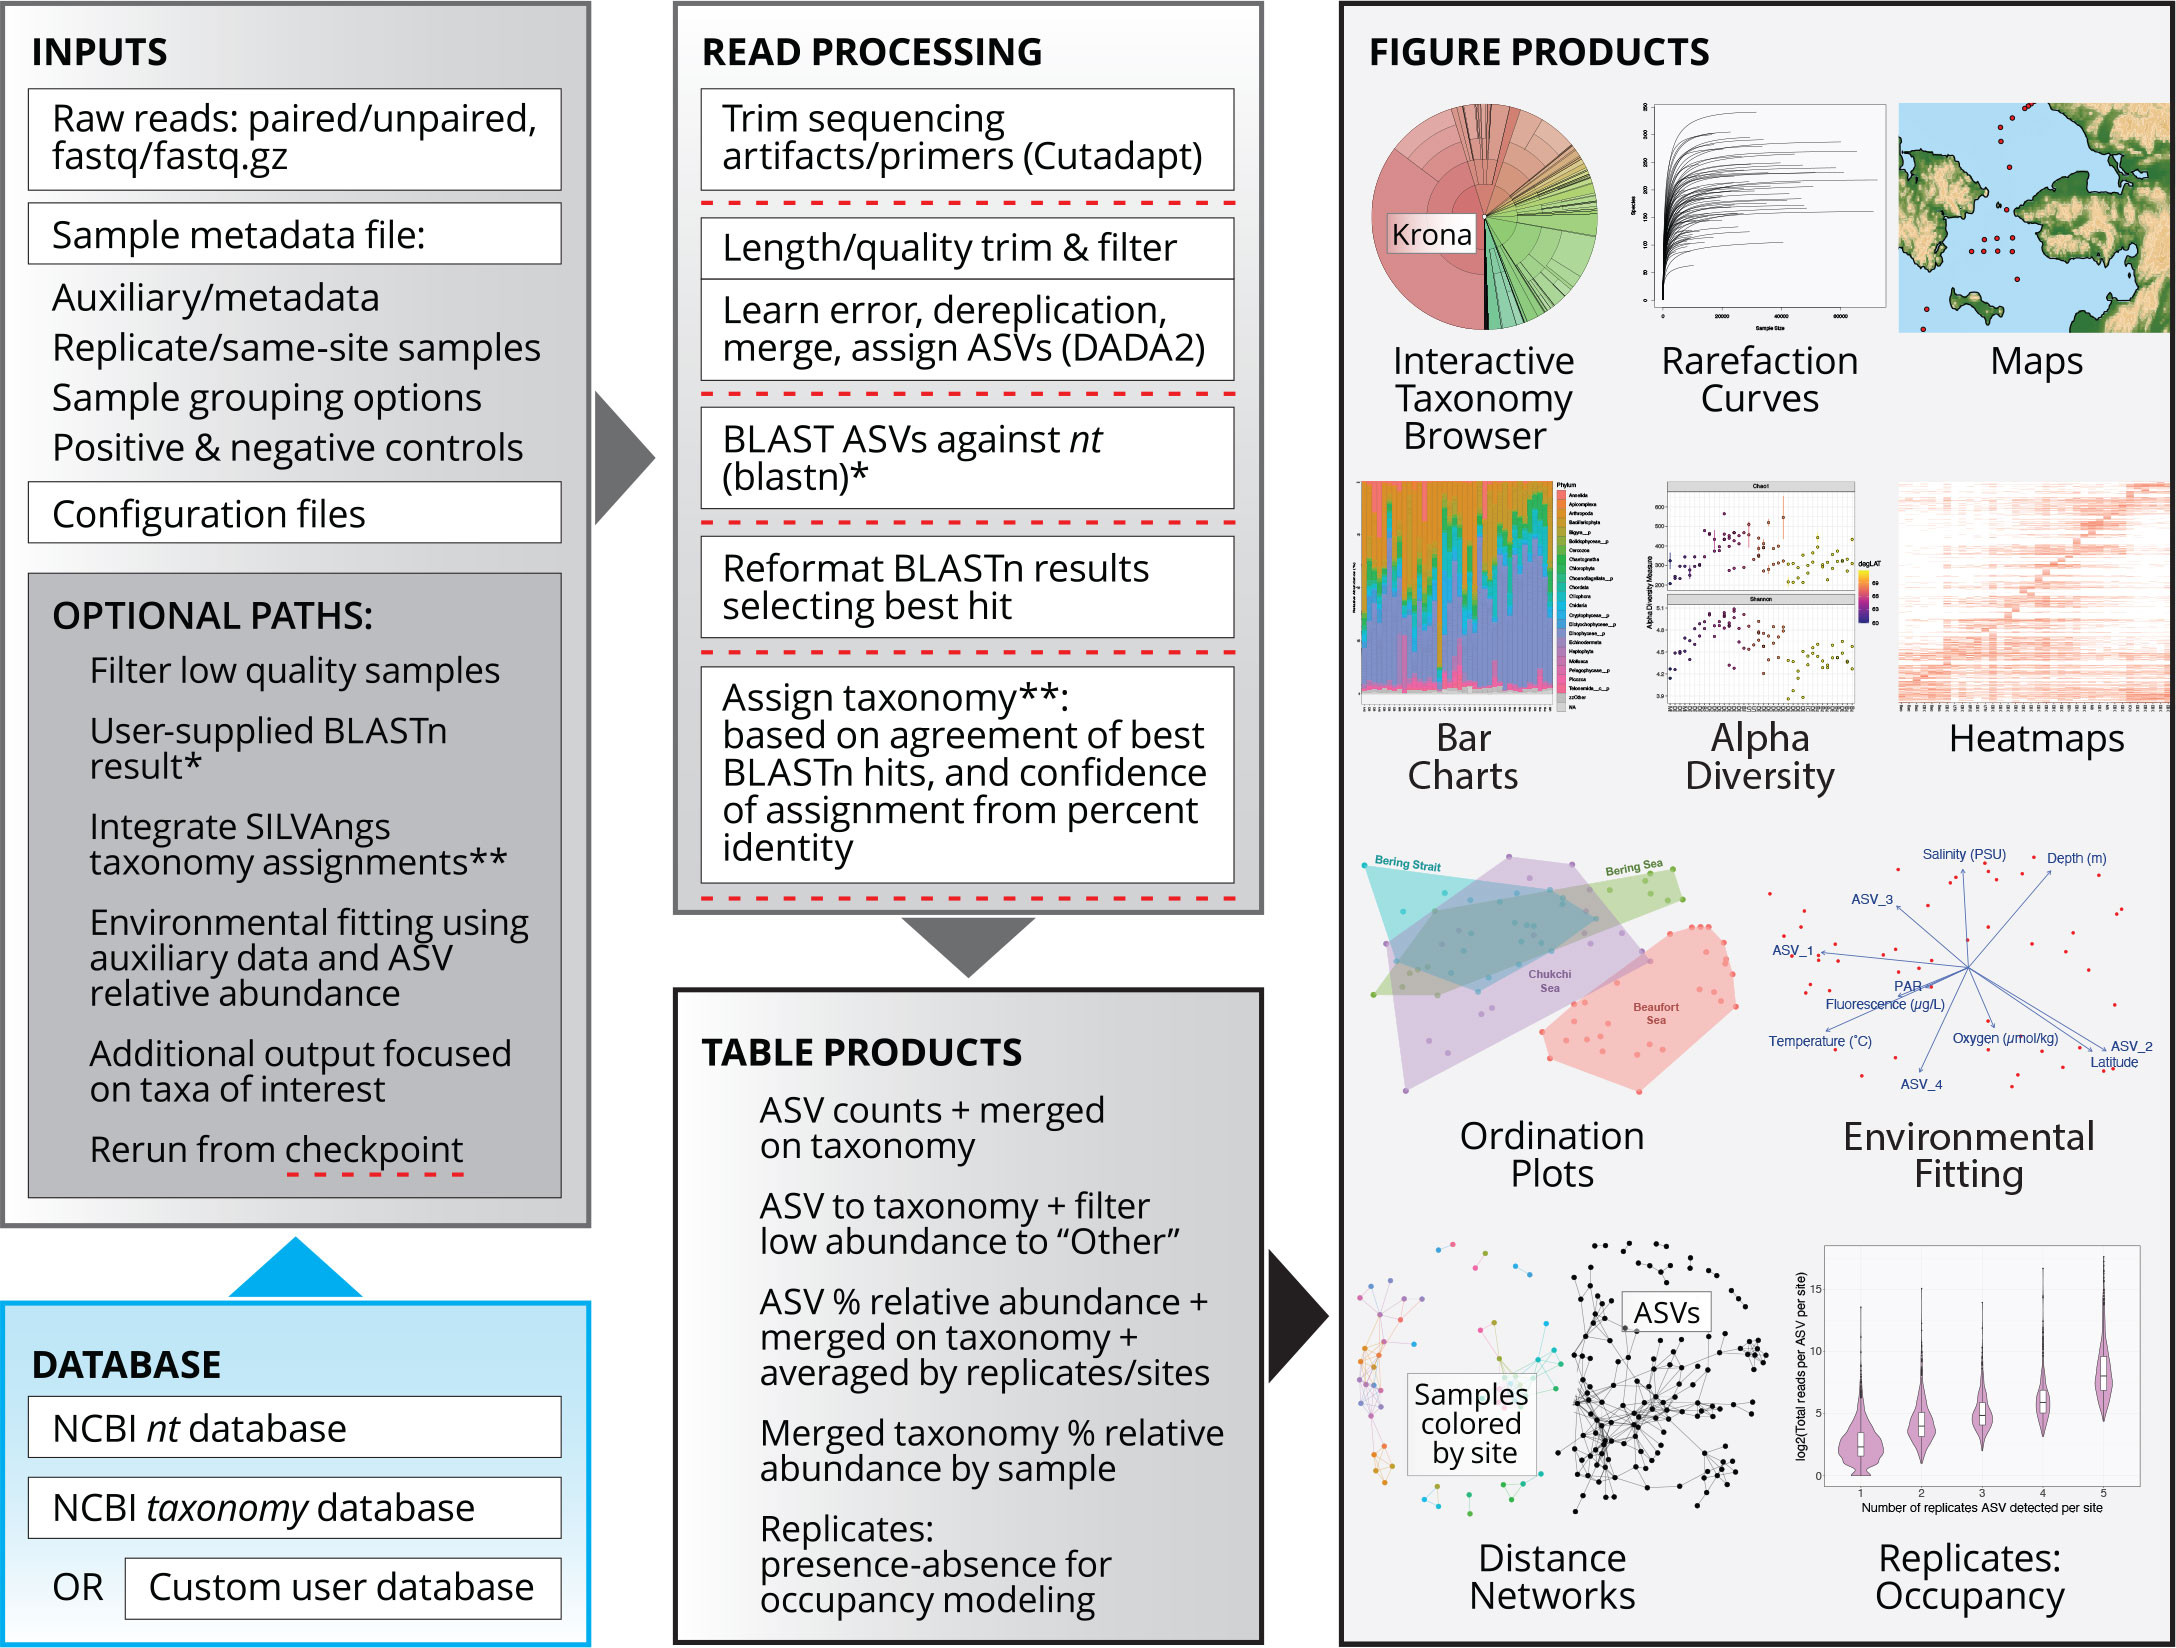
FIGURE 1. REVAMP workflow from inputs to table and figure products. Independent checkpoints in the pipeline are indicated with dashed red lines. Asterisks indicate locations where optional inputs can be inserted into the workflow. > High res figure
|
We used REVAMP to conduct data analysis for the eDNA data set collected with EcoFOCI in Alaska and the Arctic (Galaska et al., 2023, in this issue). This data set consisted of 84 samples sequenced for two markers, the universal 16S marker (Parada et al., 2016) and nuclear metazoan 18S marker (Machida and Knowlton, 2012) (median 51.5k raw reads per marker per sample). The run with REVAMP took approximately 3.5 hours on six processors with maximum 55 GB memory (for BLASTn against the full nt database); it generated 985 hierarchically organized figures (plus legends) per marker of marine biodiversity patterns in comparison to ocean condition observations, allowing for rapid exploration of the data. Historically, this kind of extensive data exploration, using the same bioinformatics tools without an appropriate pipeline, can take two to three weeks. Thus, REVAMP has created a reproducible and rapid solution that can be ported to a cloud environment for ease of use and public access in the future.
Assessments of Marker Gene Choice and Taxonomic Resolution Over the Past 30 Years of Sequencing
Although REVAMP provides a critical tool for processing and analyzing metabarcoding data, the accuracy of taxonomic assignments made by this tool are a function of both how comprehensive reference databases are and the appropriateness of marker gene choice. Thus, improving reference databases and primer design will enhance our ability to resolve unique sequences (i.e., ASVs) to the species level. One way to assess how these affect eDNA and metabarcoding resolution and accuracy is to compare the change in the percentage of unique sequences that can be resolved to species level or higher over time. To accomplish this, we analyzed data sets through REVAMP for three commonly used marker gene regions: Machida nuclear 18S (Machida and Knowlton, 2012), MiFish universal teleost 12S (Miya et al., 2015), and Kelly metazoan 16S (Kelly et al., 2016). Each data set was iteratively analyzed using cutoff dates spaced at six-month intervals from 1995 to 2022, with taxonomic assignments made based on a modified reference database that only included sequences uploaded prior to that cutoff date (Figure 2; see https://github.com/McAllister-NOAA/BLAST_dateFiltering). Accuracy was assessed at each time point based on whether or not the taxonomy matched the current (as of 12/2022) assignment for each ASV. Each panel took approximately 18 hours of processing time using six processors.
Trends observed in Figure 2 are a function of reference database completeness and resolution of a given marker set. The addition of novel reference species to the NCBI database is a primary driver of increasing power for species identification (Gold et al., 2021; Keck et al., 2022). However, the addition of novel reference sequences can also lead to declines in species-level resolution if a novel reference sequence is identical to a closely related species (Keck et al., 2022). The Machida 18S marker (Figure 2a,b) and the MiFish 12S marker (Figure 2c) exhibit improving species-level accuracy (purple line) from 1995 through 2019, suggesting that these markers continue to be improved as they gain more complete reference databases. In contrast, the effectiveness of the Kelly 16S marker has decreased since 2010, suggesting that this marker has a high degree of sequence similarity across species and that reference database building efforts will not improve its efficacy (Figure 2d).
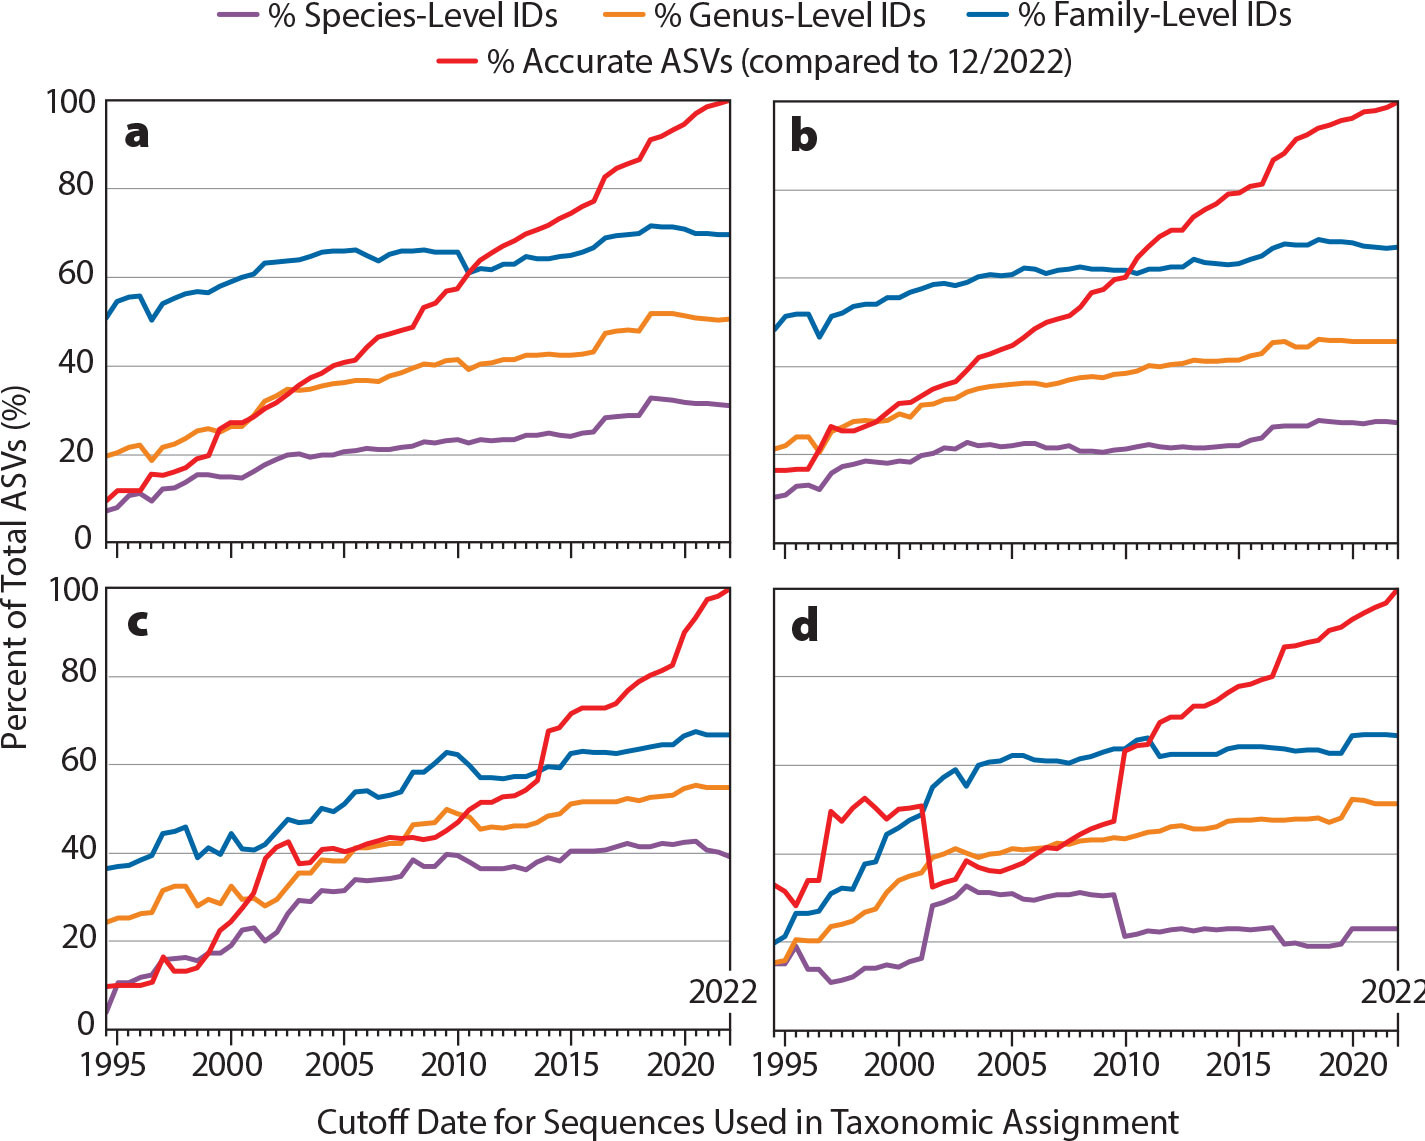
FIGURE 2. Assessment of depth and accuracy of amplicon sequence variant (ASV) assignments over time. Iterations of cutoff date, excluding newer reference sequences at six-month intervals, were run for four different data sets: (a) Machida 18S marker gene on the Alaska/Arctic data set (Galaska et al., 2023, in this issue); (b) Machida 18S marker on a data set from the Olympic Coast National Marine Sanctuary (OCNMS) in Washington (Paight et al., 2021); (c) MiFish 12S marker on OCNMS data set; and (d) Kelly 16S marker on OCNMS data set. > High res figure
|
When considering the regional impact of reference sequencing efforts, we compared the Machida 18S marker between the temperate Pacific and Arctic data sets. Over time, this marker performed comparably between these regions, suggesting that reference barcoding efforts have been similarly effective in both regions (Figure 2a,b). It is clear from these analyses that further examination of these trends by marker and in different regions are warranted so that effective markers can be chosen to maximize resolution and accuracy. Furthermore, this work highlights the importance of regularly reevaluating markers with updated reference databases to ensure appropriate marker gene selection.
Building more thorough and regionally focused reference databases for the Northeast Pacific and the Arctic are primary focal points for the PMEL OME group, in collaboration with other NOAA colleagues and the Smithsonian Institution. This work will improve the results presented in Galaska et al. (2023, in this issue), for which taxonomic assignments can be updated with each new iteration of the reference database.
Conclusions
With a rapidly changing ocean environment, the keys to successful operationalization of an ocean biomolecular monitoring framework are the accuracy and speed of knowledge dissemination. Reproducible bioinformatics tools like REVAMP reduce the time lag between raw data generation and production of biological ecosystem information from weeks to hours. Rapidly exploring patterns in eDNA data across multi-stressor gradients allows us to understand and predict ecosystem dynamics in response to changing ocean conditions, providing a key bioinformatic resource that will better serve NOAA objectives. As the PMEL OME group improves reference databases in the Northeast Pacific and the Arctic, REVAMP can be used to examine the efficacy of reference databases and marker choices. As a flexible pipeline generating hundreds of visualizations, REVAMP is a valuable tool for rapid biodiversity evaluation, and will be incorporated into NOAA ’omics bioinformatics toolkits as we operationalize eDNA efforts.
Acknowledgments
We would like to thank Zachary Gold and two external reviewers for their helpful feedback on the manuscript. We also thank Sarah Battle for her logo design and figure streamlining help. This publication represents NOAA Pacific Marine Environmental Laboratory Contribution No. 5528; also partially funded by the Cooperative Institute for Climate, Ocean, and Ecosystem Studies (CICOES) under NOAA agreement NA20OAR4320271, Contribution No. 2023-1294.
Data Availability
Data availability for the Alaska/Arctic data set is discussed by Galaska et al. (2023, in this issue), with reads available at the NCBI’s Sequence Read Archive (SRA) under BioProject PRJNA982176. Raw sequence reads for the additional data set from the OCNMS were previously deposited under BioSamples SAMN23524382-SAMN23524565. Additional data and analysis products for marker assessment in Figure 2 were deposited on FigShare (https://figshare.com/projects/REVAMP/170406).