INTRODUCTION
Biodiversity (the variety of life in a particular habitat or ecosystem) is essential to maintaining ecosystem functions and services (Magurran, 1988; Sala and Knowlton, 2006). These functions and services are increasingly overused and are affected by climate change in coastal and marine ecosystems, leading to changes in species composition, distribution, biomass, and abundance. These changes have drawn international attention to the evaluation of biodiversity to help manage marine living resources (Bohnsack and Ault, 1996; Bengtsson, 1998; Jackson et al., 2001; Cheung et al., 2009; Fautin et al., 2010; Barnosky et al., 2011; Lafferty and Eckerberg, 2013; Sala et al., 2021). In the United States, declining fisheries yields and coral reef cover resulted in the establishment in 1990 of the Florida Keys National Marine Sanctuary (FKNMS). In 1997, a network of no-take marine zones was established to control effects of over-exploitation, to minimize spatial use conflicts between divers and fishers, and to attempt to minimize further declines in the biological diversity and abundance of marine organisms (Bohnsack and Ault, 1996; Ault et al., 1998; Bohnsack et al., 1999). Although no-take marine zone management tools are designed to promote conservation and recovery of biological communities (Allison et al., 1998; Zupan et al., 2018; Claudet et al., 2020), we lack a clear understanding of their efficacy in the FKNMS.
To better understand the effectiveness of different management approaches as well as the environmental context for changes in biodiversity in the FKNMS, we examined reef-fish abundance, biomass, and diversity indices (i.e., richness, Simpson diversity,1 and functional diversity) based on observations collected over 19 years (1999–2018) inside and outside no-take marine zones designated as Sanctuary Preservation Areas (SPAs), Research Only (RO), and Ecological Reserves in the FKNMS. These areas are closed to fishing and extractive uses. This study is an update to previous assessments of reef-fish community composition and spatial distributions in the FKNMS (Bohnsack et al., 2004; Kramer and Heck, 2007; Bartholomew et al., 2008; Ault et al., 2013; Montenero et al., 2020).
The hypotheses that guided the study were that reef-fish diversity is greater within no-take marine zones than outside these zones, and that reef-fish diversity is higher where habitat structure is more complex. The reef-fish abundance, biomass, and diversity indices were computed using data collected during repeated, extensive routine field surveys (Brandt et al., 2009; Smith et al., 2011). The results were examined in the context of habitat structure (relief and depth) and level of protection offered by no-take marine zones. The analysis presents a US Marine Biodiversity Observation Network (MBON) case study (Duffy et al., 2013; Muller-Karger et al., 2014) that illustrates the application of species abundance, biomass, and biodiversity metrics to address issues of policy and management concern.
1 Simpson’s Diversity Index is a measure of diversity that takes into account the number of species present, as well as the relative abundance of each species. As species richness and evenness increase, diversity increases.
Study Area: The Florida Keys National Marine Sanctuary
The FKNMS (Florida, USA) includes the third largest barrier reef in the world (Lee and Williams, 1999; Kruczynski and Fletcher, 2012) and encompasses about 10,000 km2, stretching from the city of Miami to the Dry Tortugas archipelago. Our study included 23 no-take marine zones (Figure 1): 18 SPAs (average 0.85 km2, range = 0.16–5.15 km2), four RO areas (average 0.45 km2, range = 0.3–0.7 km2), and the Western Sambo Ecological Reserve (18.7 km2). Collectively, these zones account for less than 0.4% of the area of the sanctuary. The Dry Tortugas Ecological Reserve was not included in the analyses because of limited data available from that area and the marked differences in habitat strata relative to the rest of the Florida Keys (Ault et al., 2013).
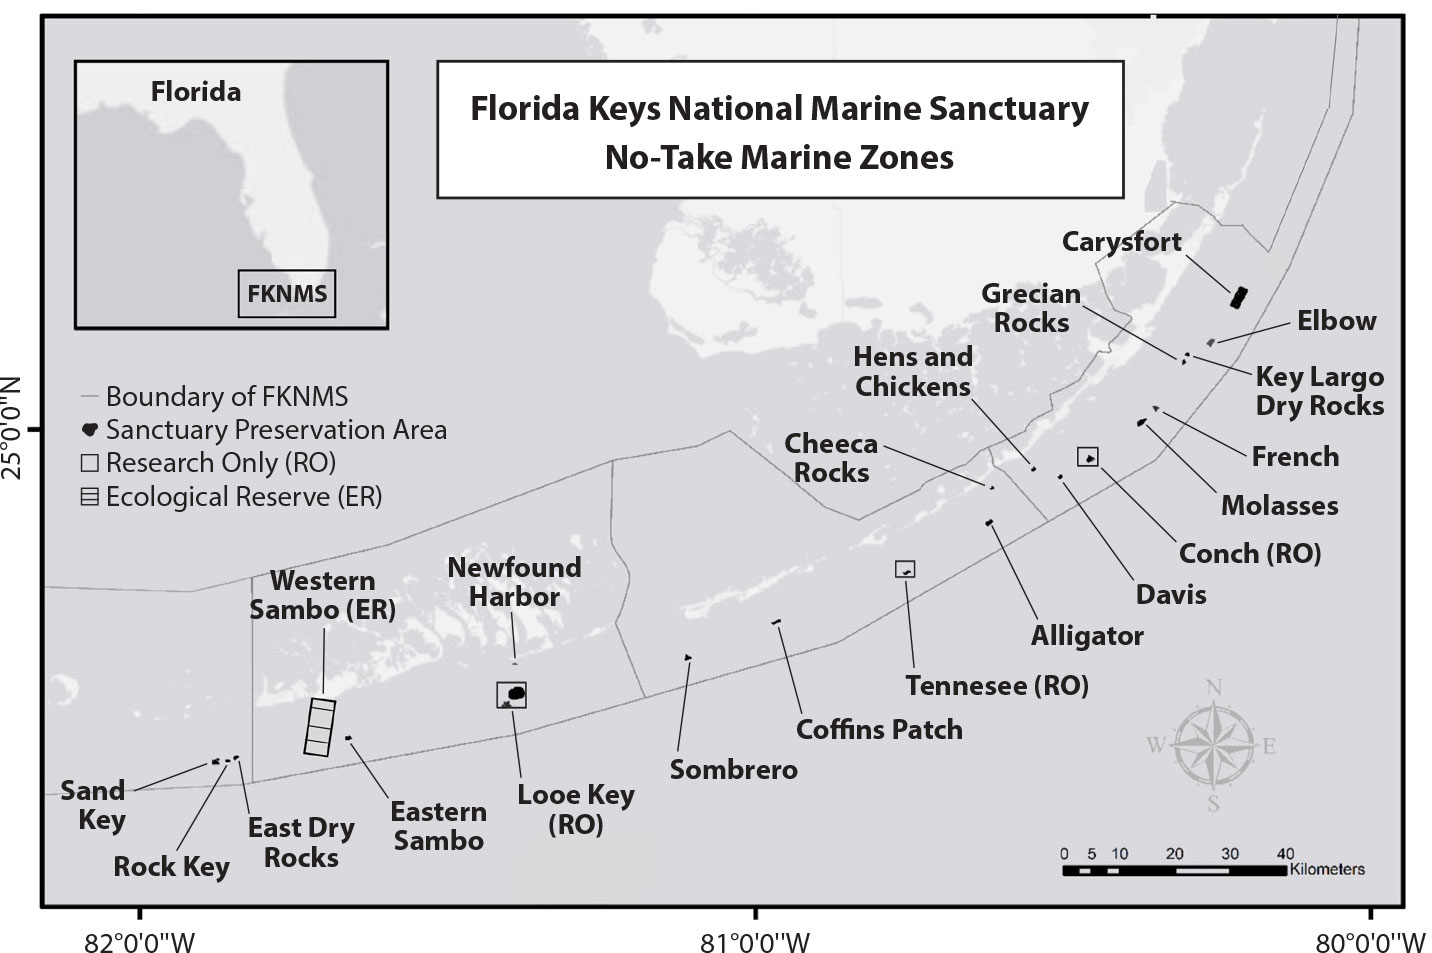
Figure 1. Map of the Florida Keys National Marine Sanctuary, showing no-take marine zones. There are 18 Sanctuary Preservation Areas, three Research Only areas, and one Ecological Reserve. > High res figure
|
The FKNMS contains diverse marine fauna and flora that include species common to the tropical Caribbean, the subtropical waters of the Gulf of Mexico, and the east coast of North America (Kruczynski and Fletcher, 2012). The three primary types of reef structures found in the Florida Keys are spur and groove reefs (also referred to as high-relief reefs), linear reefs, and patch reefs (Shinn et al., 1989). Spur and groove reefs have shallow ridges (spurs) separated by deep channels (grooves) that are oriented perpendicular to the shoreline. Linear reefs are oriented parallel to the shoreline, and patch reefs are isolated coral boulders (Walker et al., 2008).
MATERIALS AND METHODS
Survey Design and Data Collection
We used reef-fish data collected by US federal and state agencies in the FKNMS as part of a multi-agency Reef Visual Census (RVC; Ault et al., 2002; Brandt et al., 2009, 2010; Smith et al., 2011). The RVC surveys were conducted annually between May and October by trained scuba divers from 1999 to 2012, and then every two years through 2018. Data were obtained from the NOAA National Marine Fisheries Service Southeast Fisheries Science Center (NOAA, 2021).
The RVC followed a habitat-based, two-stage, randomly stratified survey design. The first stage consisted initially of a Primary Sampling Unit (PSU) defined as a 200 m × 200 m map grid (40,000 m2). Increased habitat mapping of the coral reef tract allowed the survey design to change to a 100 m × 100 m (10,000 m2) map grid starting in 2014. A Secondary Sampling Unit (SSU) was defined as a 15 m diameter circular plot (177 m2) within the PSU. At each SSU, two divers used a 10-minute stationary point count method, listing all species observed in the first five minutes, followed by recording the abundances in size categories of fish in the second five minutes (Figure 2; Bohnsack and Bannerot, 1986). Each PSU was randomly selected by stratum (i.e., habitat type), and the number of PSUs sampled by strata and no-take marine zones varied among years (Supplementary Tables S1–S4). However, the survey design itself did not vary fundamentally over the years.
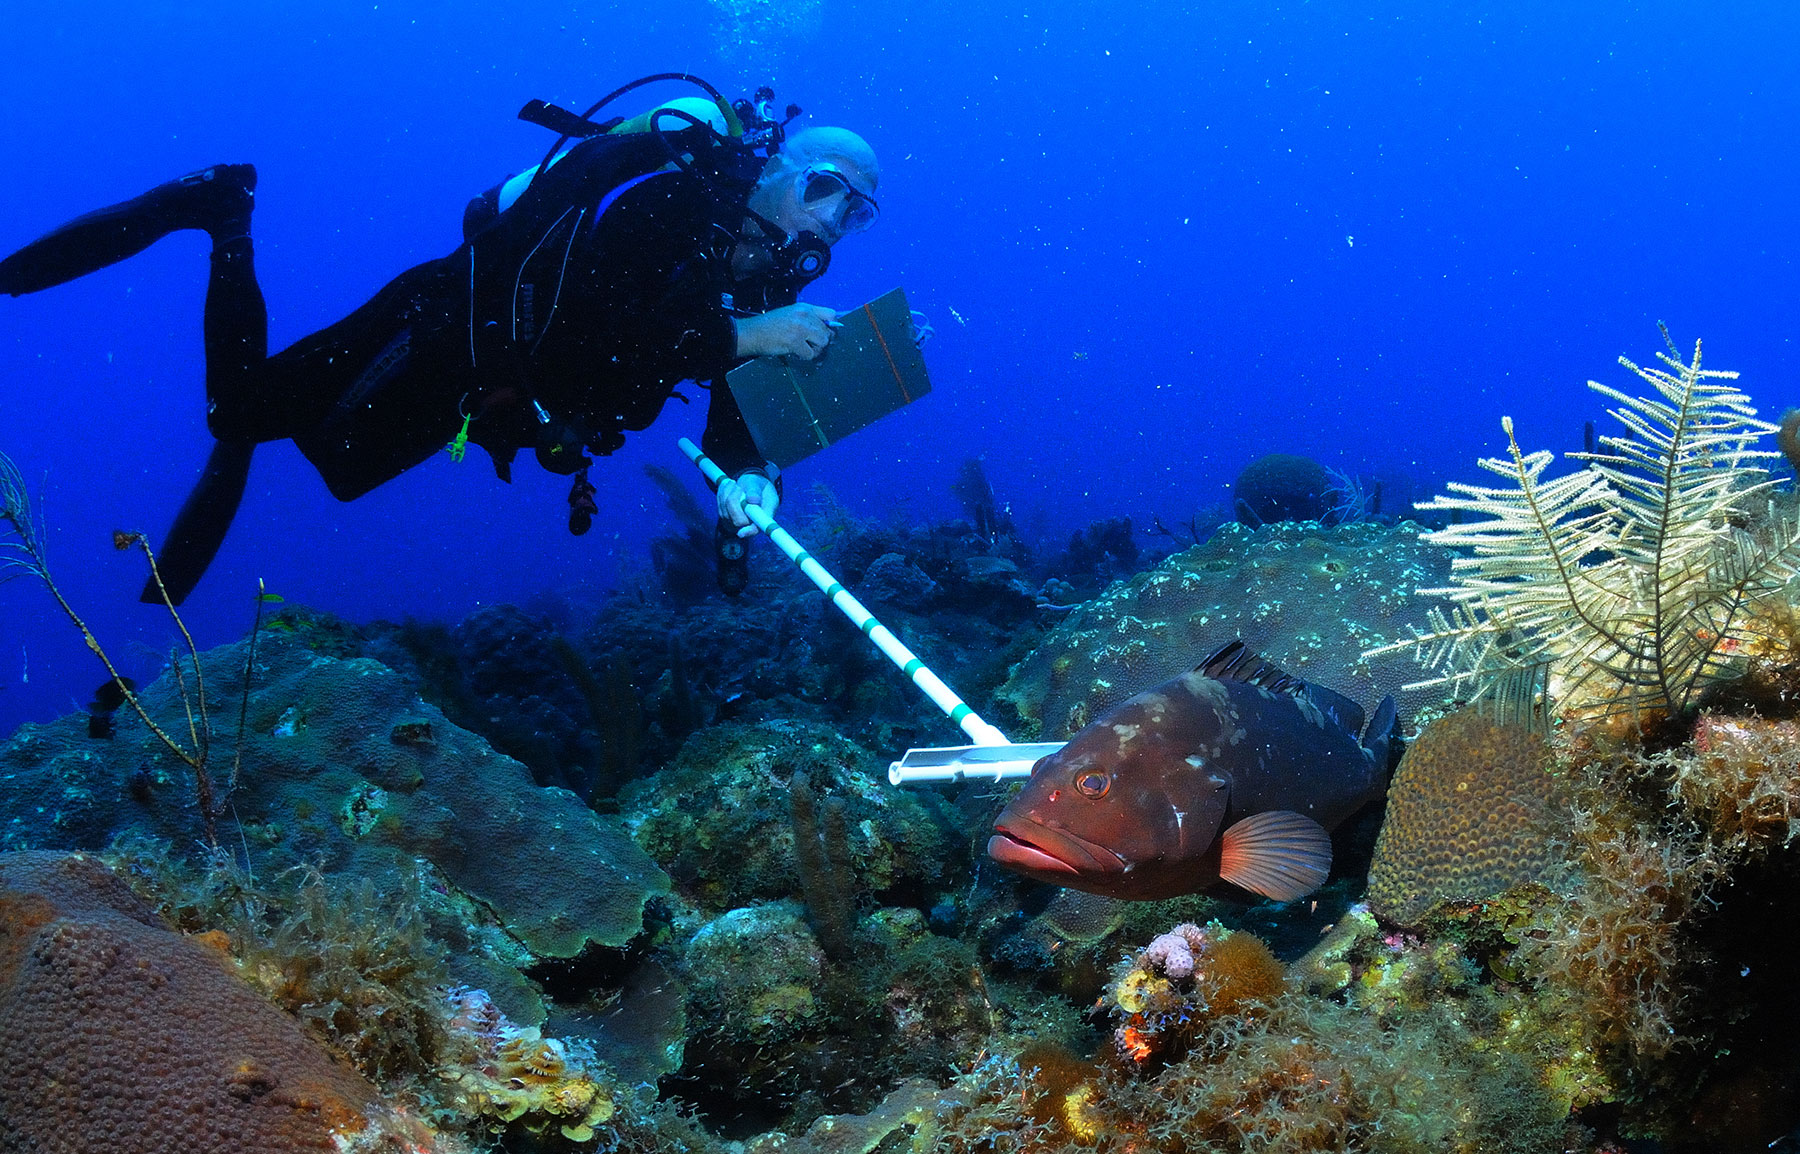
Figure 2. University of Miami fisheries scientist Jerald (Jerry) Ault uses a reference tool/t-stick to estimate the length of a red grouper (Epinephelus morio) as part of NOAA’s National Coral Reef Monitoring Program. Professor Ault contributed to the design of the Reef Visual Census surveys. Photo credit: Jiangang Luo, University of Miami. > High res figure
|
Reef-fish taxonomic, biometric, and abundance data, and benthic variables (depth, whether the reef was high relief, linear, or patch reef) for each SSU were averaged to produce the PSU-level variables. To detect variability in species abundance, biomass, and diversity metrics through time and space, indices were computed for each PSU sampled each year. For this study, we increased statistical power by aggregating observations from all PSUs across all no-take marine zones and unprotected areas, and also across the three habitat types (i.e., high-relief, linear reefs, and patch reefs; Tables S1–S4). Abundances reported here are averages per PSU for each region, and biomass is reported as grams per meter squared.
A greater proportion of sites focused on hard-bottom reef habitats located between 1 m and 30 m depth (habitats with some structural relief) versus soft-bottom (i.e., sand), because hard-bottom habitats were expected to have higher fish densities (Smith et al., 2011). In addition, the RVC surveys were designed to optimize the observation of conspicuous and diurnally active reef fishes, specifically, economically and ecologically important ones (Bohnsack and Bannerot, 1986). Crevice-dwelling and cryptic species were not as effectively sampled.
The analyses did not include a measure of fish detectability. Therefore, our results likely represent an underestimate of fish abundance, biomass, and diversity, but any bias should be consistent across time (Buckland et al., 2011), allowing for an assessment of relative temporal changes. We omitted taxa that were not identified to the species level (7% of the data set). This allowed the computation of abundance, biomass, and biodiversity indices based on 66 families with a total of 320 species (Table S5). In total, 5,672 sampling events across all years were used to calculate indices.
For this study, we aggregated data for each survey year across the FKNMS and also separately for the no-take marine zones and unprotected areas. The larger groupings of protected versus unprotected areas across the entire FKNMS allowed us to meet the minimum of 110 sampling events needed to detect 320 species based on an analysis of a species accumulation curve. We tested whether there was sufficient sampling for the biodiversity analyses by examining the species accumulation curve and confidence intervals using function specaccum in the vegan package (Oksanen et al., 2017).
We also examined differences in reef-fish abundance, biomass, and diversity indices among the types of no-take marine zones, specifically grouping the smaller SPA and RO areas together to compare with the larger Western Sambo Ecological Reserve.
We grouped the data by habitat type (i.e., strata). The RVC survey design partitioned the Florida Keys into seven cross-shelf habitat strata (Smith et al., 2011) defined by bottom depth, reef morphology, and topography, characteristics hypothesized to be drivers of variance of fish density. The strata included High-Relief Reef (HRRF; >2 m vertical relief), Forereef Deep Linear Reef (FDLR; 18–33 m), Forereef Medium Linear Reef (FMLR; 6–18 m), Forereef Shallow Linear Reef (FSLR; <6 m), Inshore Patch Reef (INPR), Midchannel Patch Reef (MCPR), and Offshore Patch Reef (OFPR; Brandt et al., 2009). These seven habitat strata were grouped into three larger classes: high-relief reefs (included HRRF), linear reefs (included FSLR, FMLR, and FDLR), and patch reefs (included INPR, MCPR, and OFPR). This allowed us to meet the minimum of 110 sampling events needed to detect 320 species based on the species accumulation curve.
Abundance, Biomass, and Biodiversity
The data were extracted using the functions GetPSUAbundance and GetPSU-Biomass in the RVC package (Ganz, 2015). Abundance was defined as the count per SSU extrapolated for an entire PSU. Biomass was extracted from the NMFS RVC data set, which had been computed using species-specific allometric growth relationships to convert observations of length (mm) to weight-at-age (grams) for each individual fish and integrated for all species for each PSU (see Menza et al., 2006).
Species richness can be used to track changes in reef-fish assemblages over time. Species richness was calculated as the number of species detected at each PSU. Simpson diversity, also referred to as the Gini-Simpson index, takes into account both richness and evenness. Simpson diversity is the probability that two individuals randomly selected from a sample belong to different species (Simpson, 1949). Species richness and Simpson diversity were computed using the functions specnumber and diversity in the vegan package (Oksanen et al., 2017) in units of effective number of species (ENS) or “Hill numbers” (Hill, 1973; Jost et al., 2018; Table S6). ENS is a computation of the number of equally common species that give a particular value of an index (i.e., true diversity). It allows comparison of nonlinear diversity indices for communities with different population levels. In a community with equally common species, Simpson diversity is equal to the number of species (i.e., species richness) in effective number of species.
We also computed metrics of functional diversity based on a species-trait matrix (Tables S7–S8). Functional traits influence fish assemblages through the life history of each species (average maximum length), trophic position (trophic group, trophic breadth), behavior (water column position, diel activity pattern, gregariousness), and habitat associations (preferred substrate, habitat complexity). A species-trait matrix was developed using these eight traits for the 320 species detected along the FKNMS reef tract (Table S8). These traits have been used in previous studies of temperate and tropical reef-fish functional diversity (Stuart-Smith et al., 2013; Bates et al., 2014; Duffy et al., 2016). Functional distances were derived following Lefcheck et al. (2014), using the Functional Diversity package (Laliberté et al., 2014). In a community with no redundancy in traits among species (completely functional distinct), functional diversity is equal to Simpson diversity in effective number of species.
Statistical Analyses
To examine the differences between protected and unprotected areas, we computed the mean and standard error (SE) of abundance, biomass, and biodiversity indices by level of protection across years, and separately for protection zones by strata (i.e., high-relief reef, linear reef, and patch reef). We examined whether the indices changed over time using simple linear regressions (SLR; Quinn and Keough, 2002). A permutation-based multivariate analysis of variance (MANOVA) was used to test for differences in abundance, biomass, and biodiversity measures based on strata (Anderson, 2001) We then performed a nonparametric Kruskal-Wallis analysis of variance (ANOVA) on Ranks to test the significance of each index against strata and level of protection (Kruskal and Wallis, 1952). Where significance was detected (p ≤0.05), we proceeded with post-hoc analysis using Dunn’s test for multiple comparisons to determine which variables differed from each other (Tables S9–S10; Dunn 1964). The Dunn test allows for an unequal number of groups (Zar, 2010) and was calculated with function dunnTest in the FSA package (Ogle, 2017).
Lastly, we used a generalized additive model (GAM; Wood, 2006; Zuur et al., 2009) to evaluate the relative contribution to variance in biodiversity metrics by time (year), space (latitude and longitude), habitat (strata and depth), and zone (whether the sampling area was in a no-take marine zone; Luckhurst and Luckhurst, 1978; Bohnsack and Ault, 1996; Bohnsack et al., 2004, 2009; Gratwicke and Speight, 2005). The explanatory variables included categorized factors that were modeled parametrically to determine their mean effects, and continuous covariates were modeled using nonparametric smoothing functions. The full GAM was defined as:
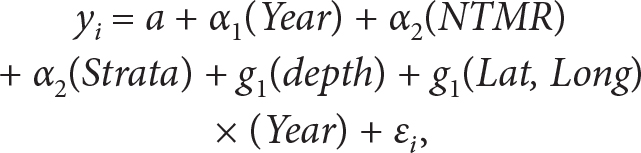
where yi is the response variable (the index) for sample i; α’s are the estimated mean effects for each year, strata, and no-take marine zone; and g’s are the nonparametric smoothing functions for the continuous covariates’ depths, latitudes, and longitudes. Following Lefcheck et al. (2014) and Hepner (2017), we incorporated a smoothing function to account for potential interactions between space and time (i.e., separate latitude smoothers for each year). Thin plate regression spines were applied to all continuous covariates. The intercept, a, scales the model prediction to the level of the response variable because each smooth estimate (g) is constrained to average to zero over the entire data set. The ε is the residual error at PSU i and is assumed to be independent and identically distributed with a mean of zero and common variance.
To assess the explanatory power of each variable, we calculated the partial deviances by iteratively running the GAM and sequentially removing suites of predictors from the full GAM model corresponding to indicators of space, time, environment, or management (i.e., 24 permutations). We then averaged the deviances for all models for which a predictor variable appeared and calculated the standard error. Essentially, the partial deviances are the proportion of total explained deviances of the model explained by each predictor: time, space, habitat, and no-take marine zone. This approach is analogous to variance partitioning in linear regression models (Legendre and Legendre, 1998).
All analyses were performed in R (R Core Team, 2020) and the code is available on GitHub (Medina, 2021). Maps were developed in ArcGIS (ESRI, 2020).
RESULTS
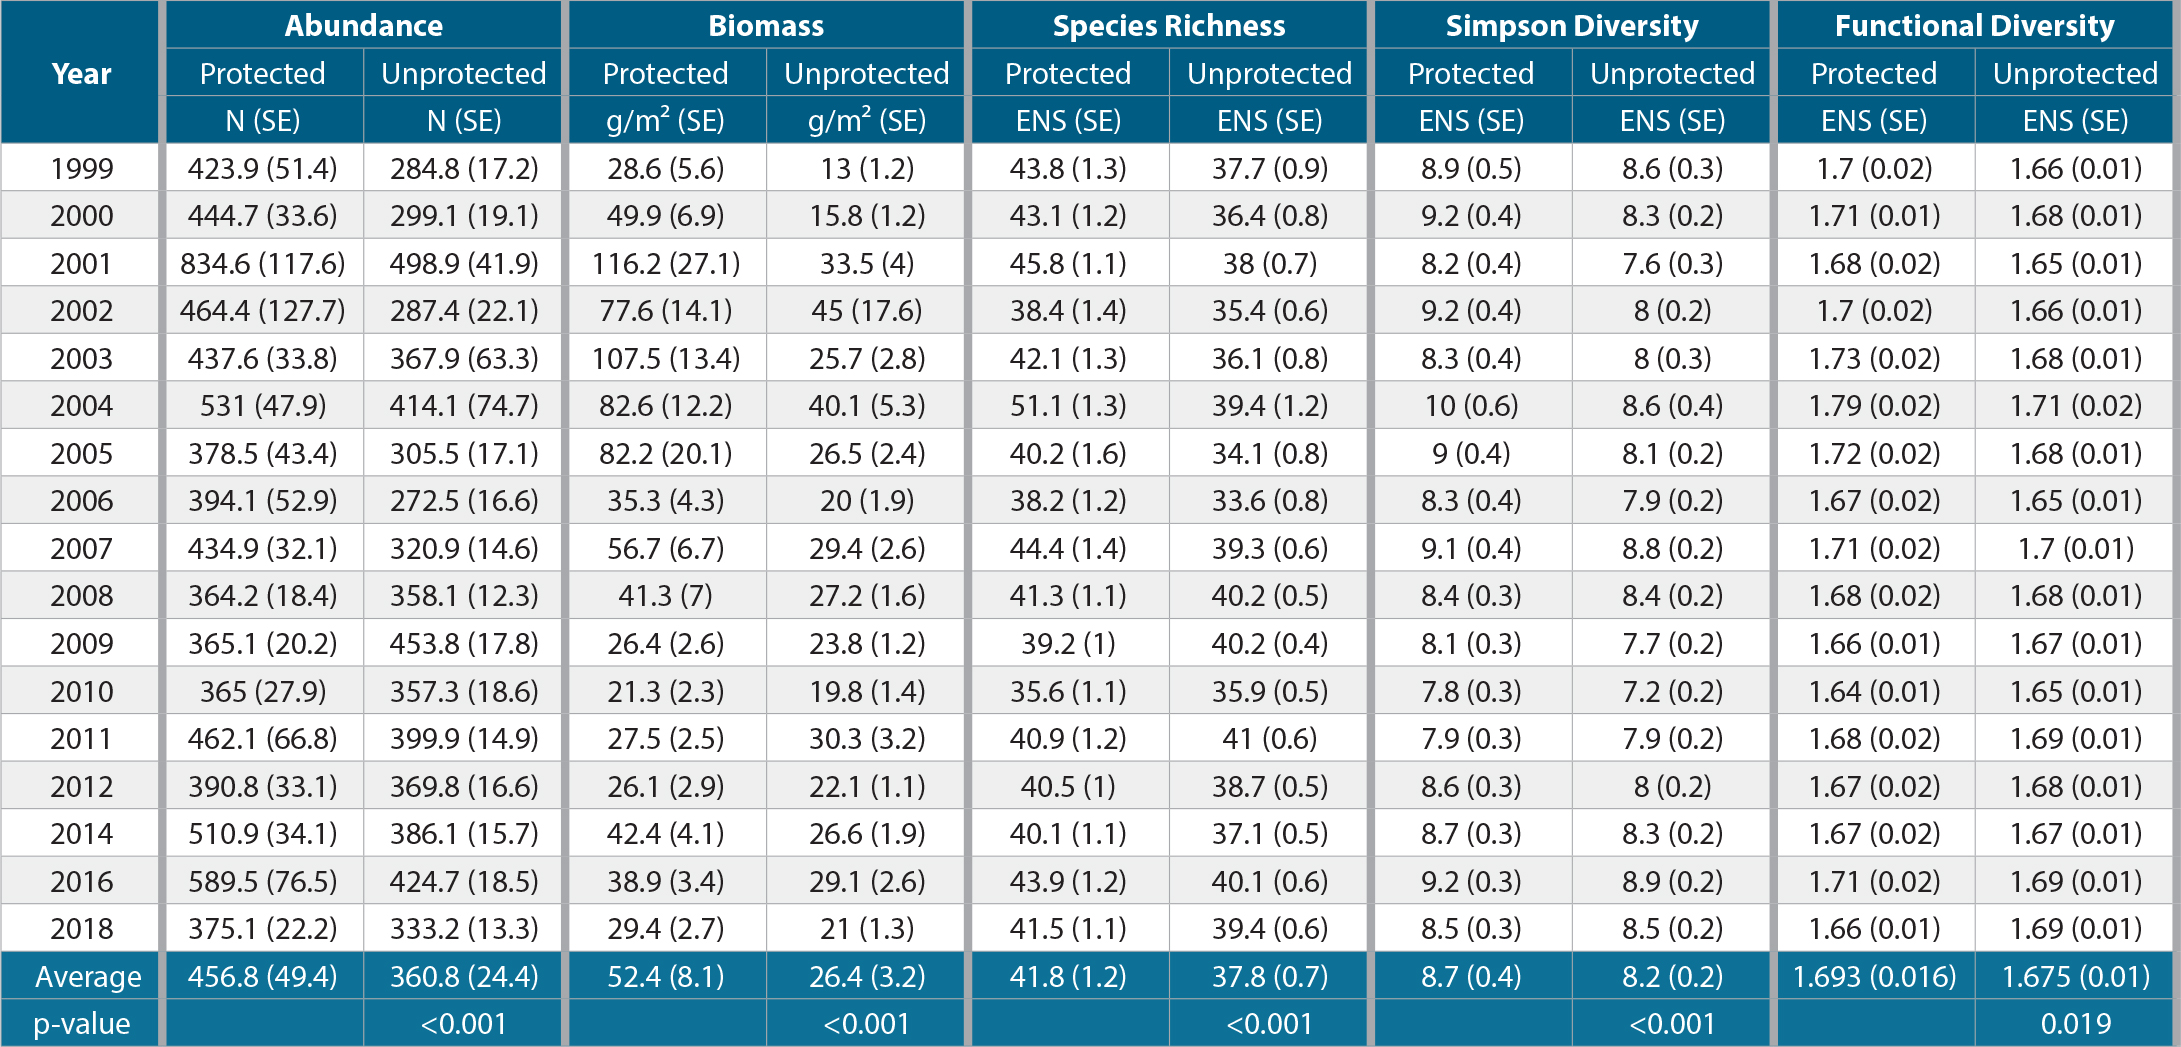
Between 1999 and 2018, we observed significantly greater reef-fish abundance per PSU, biomass per unit area, and diversity indices in no-take marine zones of the FKNMS than in unprotected areas outside these zones (Table 1; Figure 3). Over the period of observation, reef fish were on average ~20% more abundant in no-take zones than in unprotected areas. Biomass was on average ~50% higher in no-take zones. No-take marine zones had an average of 10% greater richness and 6% greater Simpson diversity, but this difference was not significant in some years. Functional diversity was about the same within and outside no-take zones. However, after about 2008–2009, these biodiversity metrics decreased on average for no-take zones, and the differences compared to unprotected zones became less pronounced and generally not significant (Table S11).
Table 1. Yearly average and standard error (SE) for abundance, biomass, species richness, Simpson diversity, and functional diversity in no-take marine zones (protected) and outside no-take marine zones (unprotected) in the Florida Keys. The overall averages for each index and their standard errors are reported, along with p-values from a two tailed t-test evaluating the overall differences in protected vs. unprotected areas for each index (bottom of the table). Abundance is the number of individuals per Primary Sampling Unit (PSU); biomass is in units of grams per meter squared. The biodiversity indices are shown as the effective number of species (ENS). > High res table
|
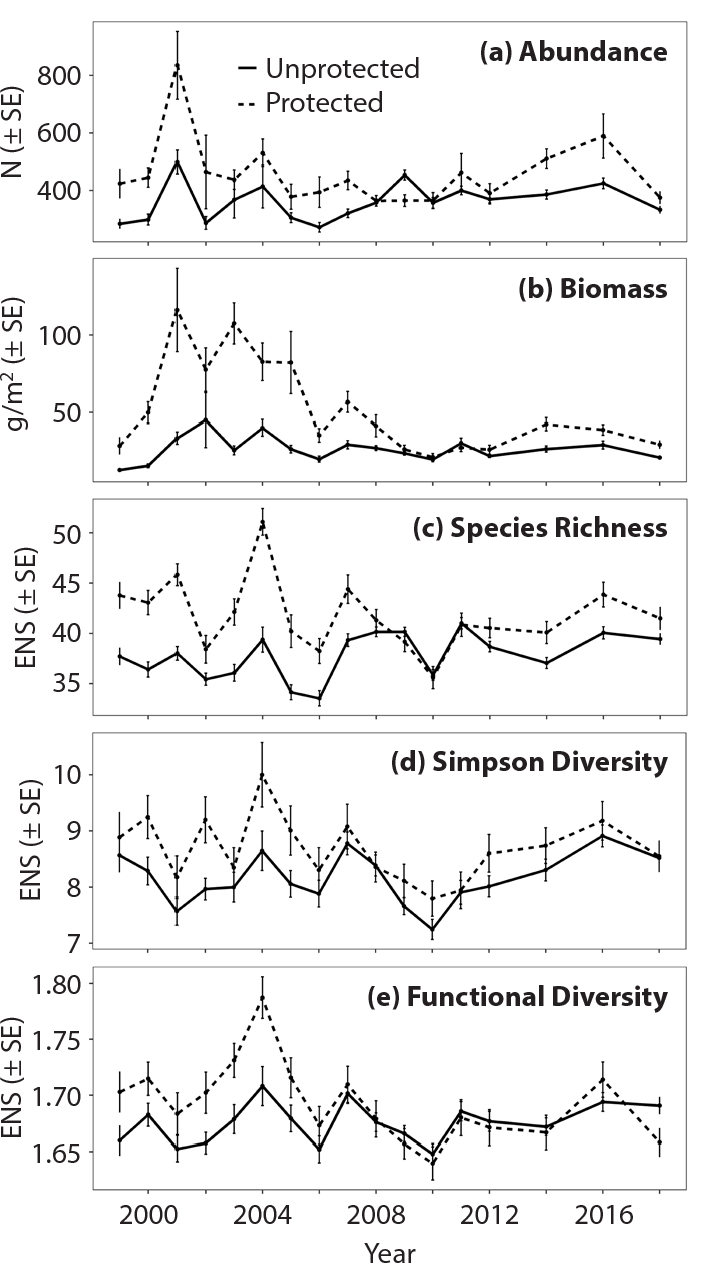
Figure 3. Average reef-fish abundance, biomass, species richness, Simpson diversity, and functional diversity grouped by no-take marine zones (protected) and outside (unprotected) in the Florida Keys from 1999 to 2018. The unit for abundance (a) is the number of individuals (N), and for biomass (b), grams per meter squared. (c)–(e) Species richness, Simpson diversity and functional diversity are presented in units of effective number of species (ENS). SE = Standard Error. > High res figure
|
All indices, when averaged across the entire time series, were significantly different by strata (Tables S9 and S12). Abundance, biomass, and species richness were greatest in high-relief reef habitats (Figure 4). Abundance of reef fish was on average about 20%–30% higher in high-relief reefs compared to the linear and patch reefs throughout the series (see Figure 4, including errors bars). Similarly, species richness was about 20% higher in high relief reefs compared to linear and patch reefs throughout the series. In comparison, biomass was over twice as high in high relief reefs than in the other strata between about 2000 and 2007, but decreased afterward to only 20%–30% higher than in linear and patch reefs (Figure 4). Simpson diversity was greatest in high-relief reef for all sampling years except 2007, when patch reef had slightly greater Simpson diversity. However, Simpson diversity varied in significance throughout the time series by strata, with high-relief reef and patch reef often not significantly different. Similarly, functional diversity showed considerable variation by strata, with high-relief reef and patch reefs often not significantly different (Figure 4). There were no apparent trends in functional diversity over time, but it appeared to be higher in high-relief reefs and in patch reefs compared to linear reefs.
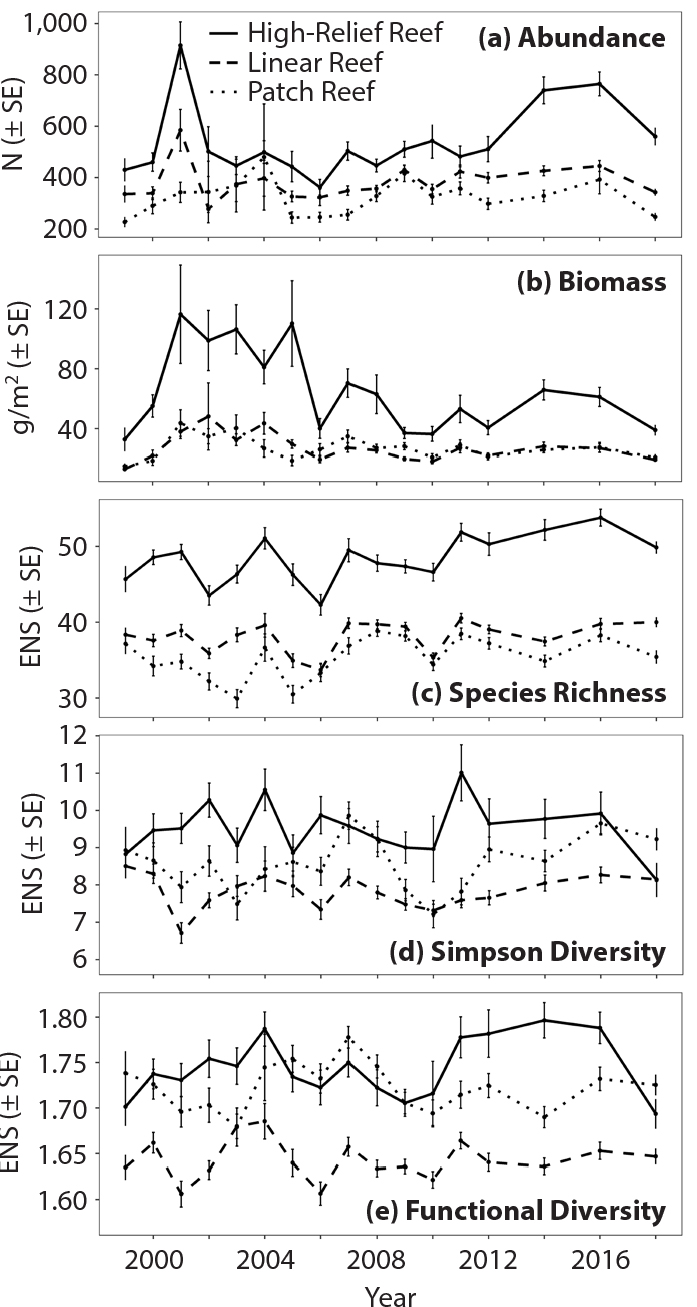
Figure 4. Average reef-fish abundance, biomass, species richness, Simpson diversity, and functional diversity grouped by strata (habitat). The unit for abundance (a) is the number of individuals (N) per PSU and for biomass (b), grams per meter squared. (c)–(e) Species richness, Simpson diversity, and functional diversity are in units of effective number of species (ENS). SE = Standard Error. > High res figure
|
On average, reef-fish abundance, biomass, and species richness were highest in high-relief habitats in both protected and unprotected zones (Figure 5). High-relief habitats exhibited an increase in reef-fish abundance and species richness at a similar rate in both protected and unprotected areas over time after 2006 (Abundance Protected Simple Linear Regression/SLR: slope = 16.9, p = 0.11, Abundance Unprotected SLR: slope = 25.1, p = 0.05, Richness Protected SLR: slope = 0.40, p = 0.13, Richness Unprotected: slope = 0.49, p = 0.10). Linear reefs in both protected and unprotected areas showed a small but nonsignificant increase in species richness (SLR: slope = 0.03, p = 0.75). Patch reefs also showed a slight increase in richness in unprotected areas (SLR: slope = 0.25, p = 0.05; Figure 5).
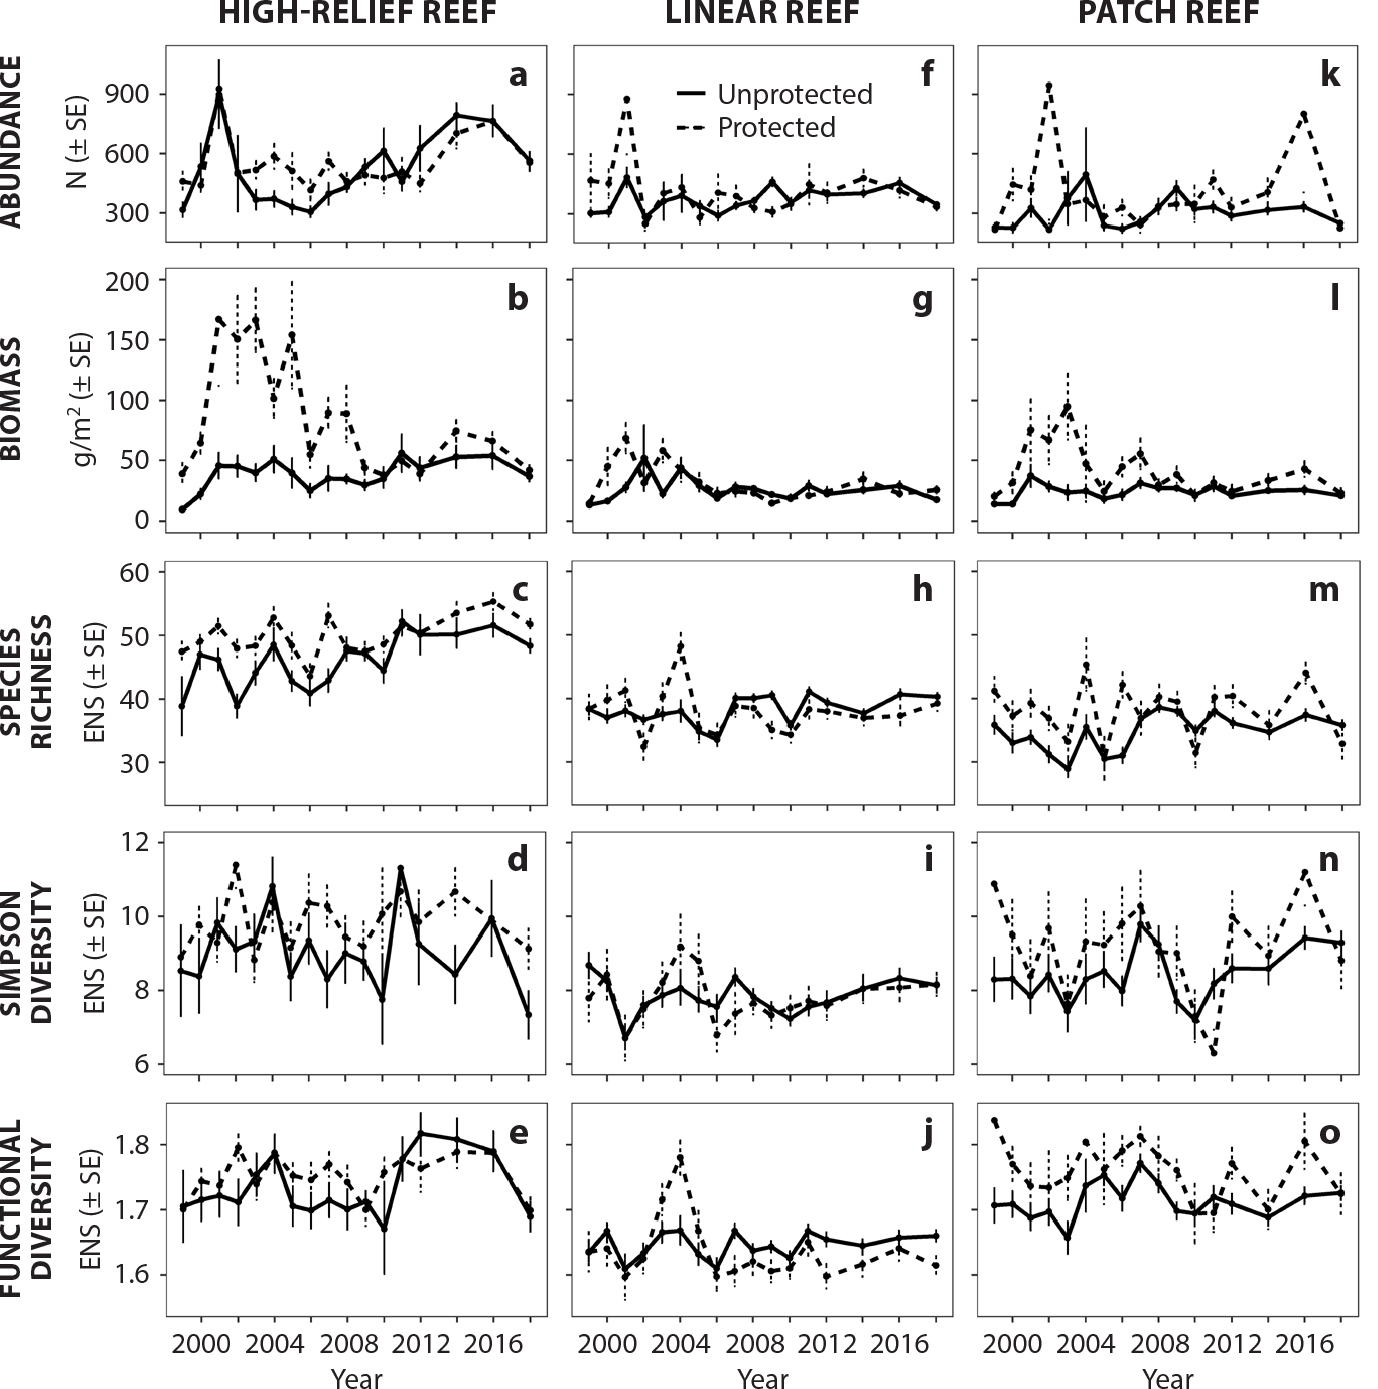
Figure 5. Average reef-fish abundance, biomass, species richness, Simpson diversity, and functional diversity grouped by strata (habitat) and no-take marine zones (protected) and outside (unprotected). Panels (a)–(e) are grouped by high-relief reef habitats. Panels (f)–(j) are grouped by linear reef habitats. Panels (k)–(o) are grouped by patch reef habitats. The units for panels (a), (f), and (k) are the number of individuals (N) per PSU; panels (b), (g), and (i) are in grams per meter squared; and panels (c)–(e), (h)–(j), and (m)–(o) are in units of effective number of species (ENS). SE = Standard Error. > High res figure
|
Biodiversity metrics were also computed by averaging indicators across all the SPA and RO areas (but separately within the Western Sambo Ecological Reserve) to compare them to unprotected areas, with all being segregated by habitat strata (Figure 6). Reef-fish abundance, biomass, and species richness were highest in the high-relief reef areas of the SPA/RO zones. Abundance and biomass of reef fish were generally not different between strata in the larger Ecological Reserve (Figure 6). Simpson diversity and functional diversity were generally similar in high-relief reefs and patch reefs across years in the SPA/RO. These indices showed more similarity between them but also more variability across years in the Ecological Reserve (Figure 6). One source of uncertainty was the smaller sample size for each habitat type within the Ecological Reserve (Table S4).
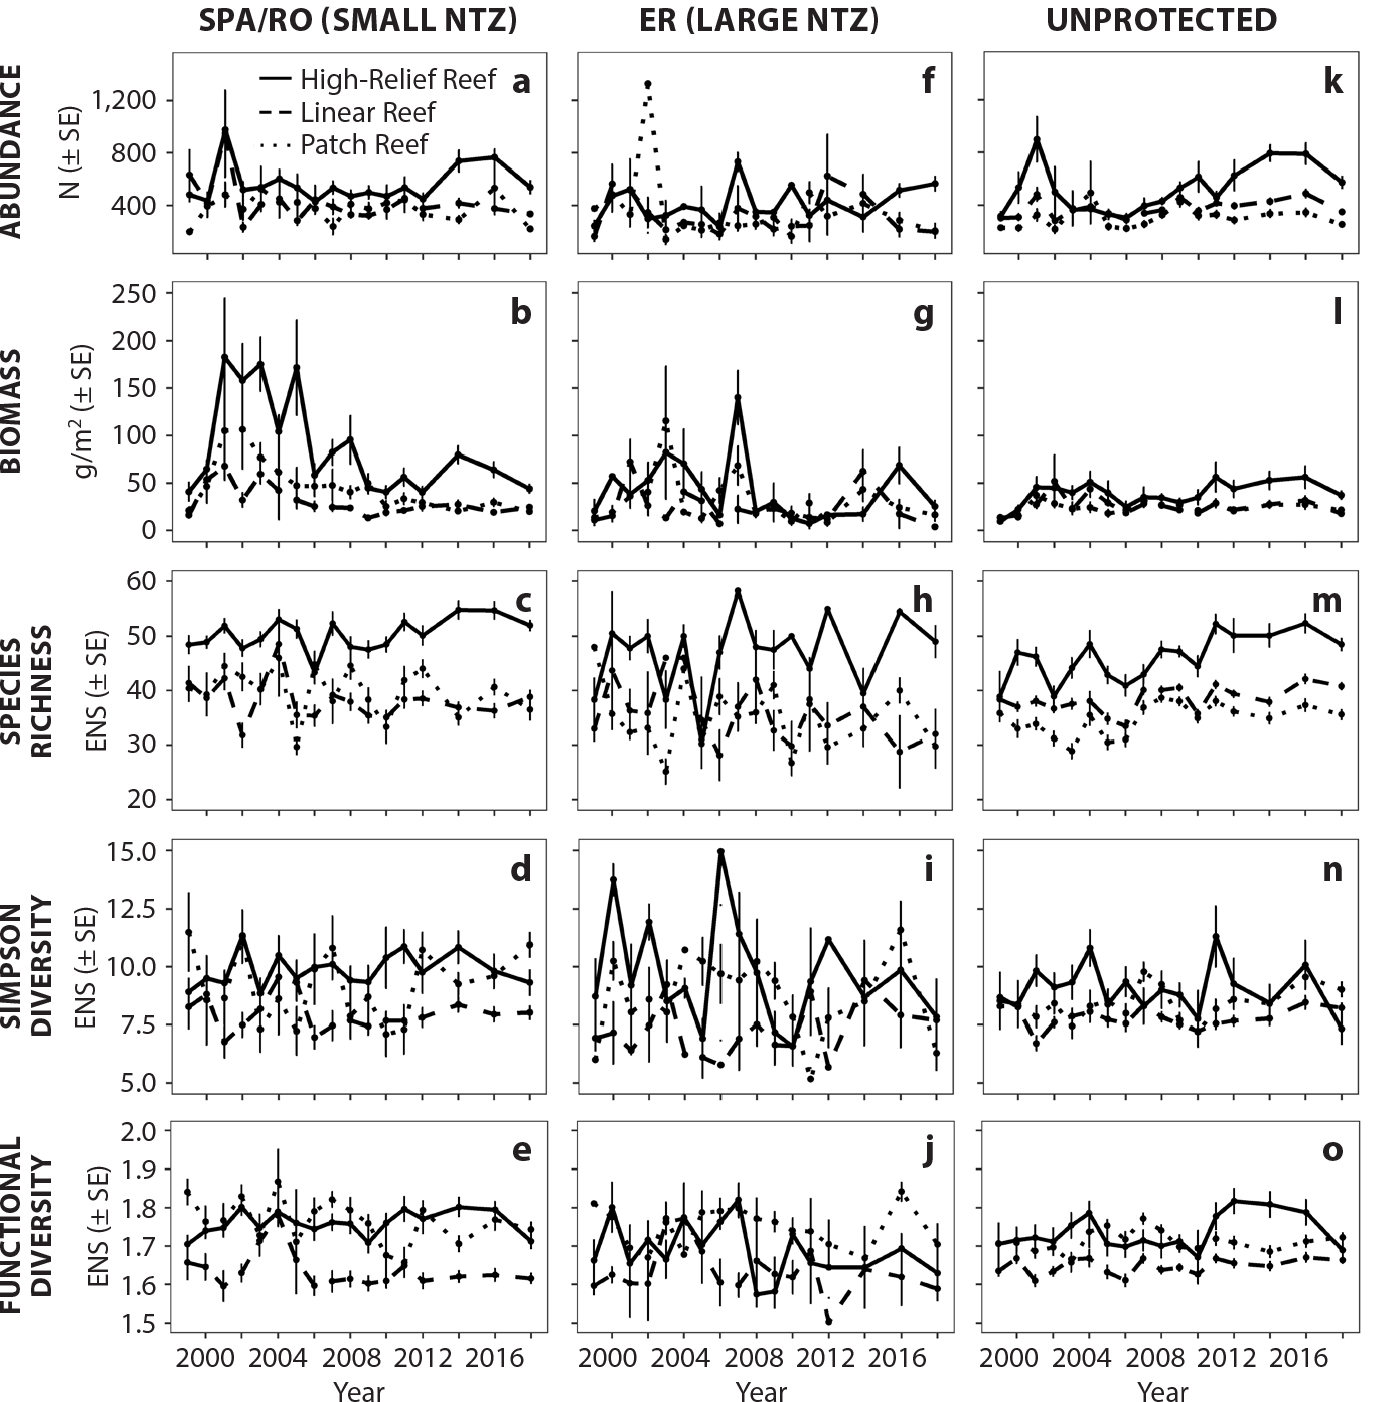
Figure 6. Average reef-fish abundance, biomass, species richness, Simpson diversity, and functional diversity grouped by strata (habitat) and type of no-take marine reserve. Panels (a)–(e) are grouped by the smaller Sanctuary Preservation Areas (SPA) plus Research Only (RO) no-take marine zones (NTZs). Panels (f)–(j) are grouped by the Western Sambo Ecological Reserve (ER) of the Florida Keys National Marine Sanctuary, and panels (k)–(o) are areas outside the no-take zones. The units for panels (a), (f), and (k) are the number of individuals (N) per PSU. Panels (b), (g), and (l) are in grams per meter squared. Panels (c)–(e), (h)–(j), and (m)–(o) are in units of effective number of species (ENS). SE = Standard Error. > High res figure
|
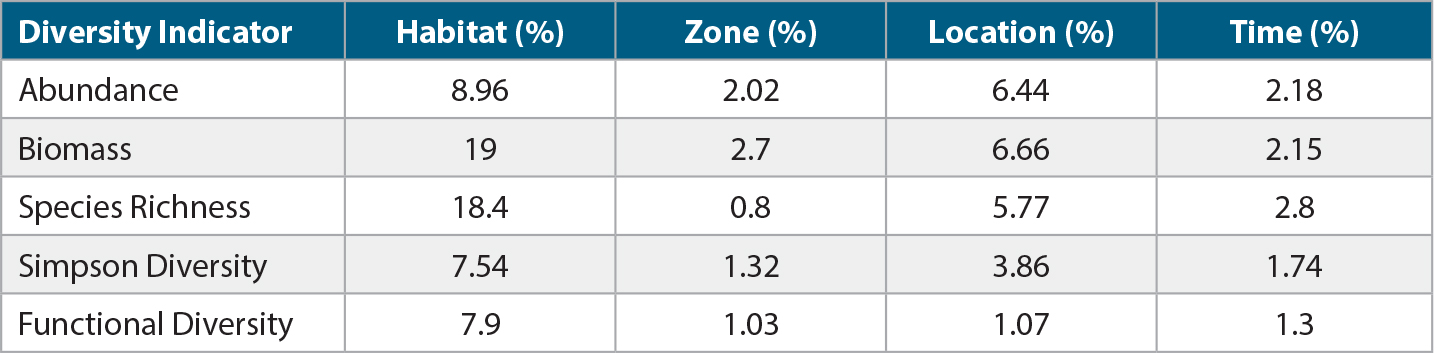
The GAM results indicated that habitat type accounted for the largest variation in community response variables (i.e., habitat strata, level of protection, location, and time), but none of the input variables explained much of the variation in community responses (Table 2). This further emphasizes that there were no major differences among reef-fish abundance, biomass, and diversity between strata and protection status. Habitat type accounted for ~9% of reef-fish abundance deviance, 19% of biomass, ~18% of species richness, and ~8% of Simpson and functional diversity. Location (latitude and longitude) was second highest in accounting for deviance in these response variables. Time and level of protection accounted for the smallest proportion of the total explained deviance.
Table 2. Partial deviance for each indicator based on the GAM model. The indicators represent the sampling areas by habitat (strata and depth), zone (no-take marine zone or unprotected), location (latitude and longitude), and time (year sampled). > High res table
|
DISCUSSION
Our goal was to assess differences in abundance, biomass, and diversity of reef fishes across habitat strata and protection level in the FKNMS. We found that the no-take marine zones, in aggregate, showed higher reef-fish abundance, biomass, and diversity (i.e., richness, Simpson diversity, and functional diversity) than unprotected areas, particularly before 2006 (Figure 3). These findings are consistent with those of Bohnsack (1997), Ault et al. (2006), Bohnsack et al. (2009), and Harford et al. (2016). While the protected areas had higher values of these metrics when the surveys began, the differences in these metrics between the aggregated protected zones and the unprotected zones declined over time. This is particularly apparent for all indices after 2008 when, in general, there was no significant difference between no-take marine zones and unprotected areas (Figure 3). In general, biodiversity metrics for reef fishes in the FKNMS did not change dramatically from 1999 through 2018.
The overall decline of biomass in observations aggregated over all of the protected areas may reflect separate, interacting processes. Coral reefs throughout the FKNMS have lost significant live coral cover and structural complexity over time (Palandro et al., 2003; Soto et al., 2011; Ruzicka et al., 2013; Vega-Rodriguez et al., 2015). Also, no-take zones can create unintended consequences by concentrating fishing effort at their boundaries. It is likely that fishing surrounds the entire perimeter of the small SPA and RO no-take zones in the Florida Keys on a routine and frequent basis (each of these areas is only a few tens of meters in diameter, if even that much). When fishing effort concentrates at the boundaries of these zones, the spillover of exploitable biomass from within a protected area to an unprotected area can become unsustainable and alter trophic dynamics within a marine protected area (MPA; McEachron, 2020). For example, Walters (2000) conducted a series of ecosystem simulations and found that interactions between fish dispersal and fishing effort at MPA boundaries can lead to reductions of up to 50% of the biomass of exploited species, and to increases in biomass of unexploited species, well within the interior of an MPA. Declining biomass measures within protected areas may reflect net negative trophic dynamics, in addition to habitat loss.
High-relief reefs had the highest biodiversity metrics in both protected and unprotected areas (Figures 5 and 6) and accounted for the majority of explained variance in fish abundance, biomass, and diversity metrics (Table 2). Habitat relief explained the greatest amount of deviance for biomass (19%). Of the 320 species detected in the RVC survey, we found that 193 (60%) species in the species-trait matrix had strong associations with medium or high habitat relief. These patterns are consistent with our understanding that fish need access to refuges and foraging grounds (Luckhurst and Luckhurst, 1978; Bohnsack and Bannerot, 1986; Öhman and Rajasuriya, 1998; Gratwicke and Speight, 2005), both of which increase in proportion to structural relief. Future studies may further illuminate how habitat complexity, including relief, texture, and other environmental variables, may influence reef fish composition and diversity measures by using additional benthic variables available in the RVC data set.
We further sought to examine whether reserve size and type affected reef-fish diversity, abundance, and biomass. In some locations, large protected areas, or zones with high involvement of stakeholders seeking to conserve resources, and zones with limited stressors, have higher reef-fish diversity (Giakoumi et al., 2018; Turnbull et al., 2018, Rasheed, 2020). In the Florida Keys, Bartholomew et al. (2008) found that overall reserve size and placement had no effect on the recovery rate of fish populations. Our findings, based on a longer time series, are consistent with Bartholomew et al. (2008) in that we found no clear evidence that the larger Ecological Reserve led to higher reef-fish abundance, biomass, or diversity than the smaller no-take zones (Figure 6). This in spite of the fact that, on average, the SPA/RO are only about 0.45 km2 compared to the 18.7 km2 size of the Western Sambo Ecological Reserve. The highest abundance, biomass, and species richness were consistently (i.e., across years) found in the high-relief reefs of the smaller SPA/RO (Tables S13–S14; Figure 6).
We found substantial variability in metrics derived from the RVC data, in part due to differences in sampling effort between these different elements of the sanctuary. One example is the low number of sites sampled in 2004 (Table S2), a year when Florida had an active and destructive hurricane season. Another example is the increase in the standard error as we decreased sample size by segregating data by level of protection and habitat strata (Figure 6; Table S4). The RVC surveys offer an extremely valuable resource for monitoring conditions in the FKNMS. We recommend that, as possible, surveys be conducted annually, and that effort remain consistent from year to year.
The higher biodiversity metrics of SPAs and ROs and the higher consistency across time may have been the result of averaging over 22 small, diverse no-take marine zones spread over a distance that exceeds 200 km and over a degree in latitude along the Florida Keys reef tract, spanning a broad range of oceanographic regimes. Although location was the second highest factor in accounting for deviance in our GAM examining the individual SPAs and ROs, their spatial variability, and whether and how this is related to the geography and oceanography of the region, was beyond the scope of this study—but should be considered in future research.
CONCLUSION
High-relief reefs in the FKNMS have the highest fish biomass, abundance, and species richness compared to linear and patch reefs. There were no strong differences in abundance and biodiversity by type of protection afforded by SPAs, RO, or Ecological Reserves in the FKNMS. Reef fish biomass per unit area was higher in protected zones between 1999 and about 2010, particularly in high relief reefs, but the difference in biomass between protected and unprotected areas between about 2008 and 2012 was not significant. Abundance, biomass, and diversity indices were significantly greater in protected areas compared to unprotected when the protected areas were established. However, in general, since 2006–2008, the difference in these metrics between protected and unprotected areas has decreased. Results suggest that size of the no-take zones did not lead to more abundance, biomass, or diversity of reef fish. All areas in the FKNMS require some conservation and restoration action given the degradation observed over time in coral reef cover and the widespread occurrence of coral disease. Conserving reefs helps maintain higher fish biomass. Habitats with higher complexity (such as high-relief reefs) may be considered high priority in defining policy options related to biodiversity conservation and restoration. The results also highlight the importance of continuing the monitoring of reef-fish assemblage and habitat substrate throughout the sanctuary in order to respond to rapidly changing conditions. Monitoring provides information that is critical to understanding changes and the drivers and pressures causing them, as well as impacts on ecosystem services (e.g., diversity and abundance of harvestable fish) and management options that may affect them. Although not tested specifically in this study, the findings may also inform planning for the size and networking of future conservation zones, especially given previous scientific findings showing better performance of larger protected areas in achieving conservation and restoration goals (Edgar et al., 2014; Krueck et al., 2017).
ACKNOWLEDGMENTS
We thank two anonymous reviewers and Guest Editor Francisco Chavez for their comments. Their recommendations improved the substance and flow of the paper. We thank Jeremiah Blondeau at the Southeast Fisheries Science Center, NOAA, for helping us access and understand the RVC survey design and package. We also thank the NASA Earth Science Division Applications Program, the NOAA Ocean Exploration Program, NOAA National Marine Fisheries Service, the US Integrated Ocean Observing System (IOOS), and the National Ocean Partnership Program (NOPP) for supporting the project through funding for the Marine Biodiversity Observation Network (NASA grants NNX14AP62A and 80NSSC20K0017; NOAA IOOS/ONR grant NA19NOS0120199).
AUTHOR CONTRIBUTIONS
Megan Medina and Cara Estes shared co-first authorship and made equal contributions to the publication. Megan Medina contributed initial analyses and writing of the original manuscript. Cara Estes included new observations and updated the analyses and graphics. Benjamin Best contributed with analyses and software programming. Christopher D. Stallings provided intellectual guidance, support in the statistical analyses, and interpretation of results. Lucas McEachron contributed material and interpretation of results. Frank E. Muller-Karger provided overall guidance, writing, and interpretation of results.
CONFLICTS OF INTEREST
The authors declare no conflict of interest.