INTRODUCTION
The ocean contains approximately 60 times more carbon than the atmosphere. About 20%–35% of the carbon dioxide (CO2) emitted by burning fossil fuels has been absorbed by the ocean (Khatiwala et al., 2009). Changes in the ocean state, such as those that occurred during the last glacial maximum (LGM) and subsequent deglaciation, could significantly affect the carbon cycle by releasing absorbed carbon to the atmosphere in the future. The glacial atmospheric CO2 concentration was lower than the pre-industrial value mainly because of increased carbon storage in the ocean via a more active biological pump in the Southern Ocean and/or more efficient carbon storage in the strongly stratified deep ocean (Hain et al., 2010; Adkins, 2013). During the deglaciation, dissipation of old deep water that was rich in respired carbon in the Southern Ocean contributed to CO2 release to the atmosphere by the upwelling branch of the Atlantic overturning circulation (Skinner et al., 2010).
Although proxy-based reconstructions have provided important insights into past ocean circulation, they do not always tell consistent stories because each proxy has its own bias. Recent advances in analytical instruments and coordinated international programs such as GEOTRACES have provided abundant high-quality data and contributed to a better understanding of proxy behavior in the modern ocean. Furthermore, the spatial coverage of marine sediment cores has greatly improved over recent decades, thanks to international programs such as the Ocean Drilling Program (ODP)/International Ocean Discovery Program (IODP) and the International MArine Global changE Study (IMAGES). Lastly, tremendous progress in climate modeling has revealed the physical and biogeochemical processes involved in climate variability. In particular, proxy-enabled models make it possible to simulate proxy fields, which in turn can be compared to proxy reconstructions (Arsouze et al., 2009; Menviel et al., 2012; Rempfer et al., 2012; Roche and Caley, 2013; Friedrich et al., 2014), allowing evaluation of the capacity of climate models to predict deepwater circulation changes.
The objective of this paper is to revisit the behavior of neodymium (Nd) isotopic composition of seawater as a tracer of water mass provenance and to apply this tracer to a major climate transition, the Mid-Pleistocene transition (MPT, about one million years). In the modern ocean, the Nd isotope composition of seawater follows the global thermohaline circulation (Figure 1), but factors other than water mass mixing influence its distribution. Using a compiled seawater data set and comparing it with other hydrography parameters, it is possible to identify the oceanic regions significantly affected by local Nd inputs. Processes that may modify Nd isotopic signals recorded in marine sediments are reviewed using compiled archival data. Finally, we use Nd isotopes to infer changes that occurred during the MPT.
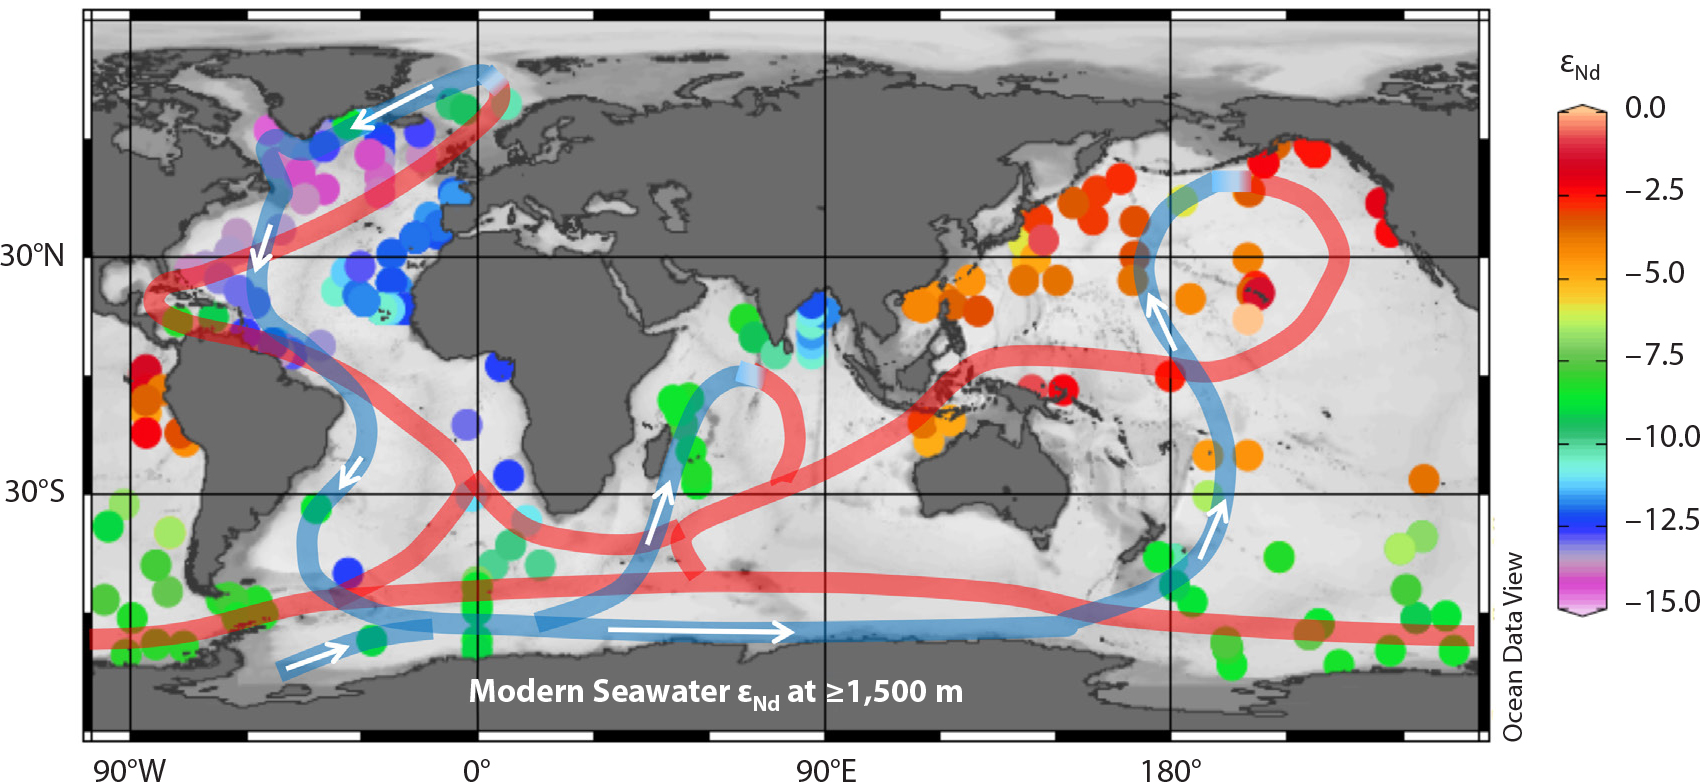
FIGURE 1. Distribution of deepwater Nd isotopic composition in the modern ocean (Tachikawa et al., 2017) and schematized global thermohaline circulation (Broecker, 1991). The colored dots indicate εNd values at 1,500 m depth in the water column or at a water depth closest to 1,500 m but deeper than 1,500 m if εNd data are not available. The blue and the red curves indicate deep and surface flows, respectively. The figure was created using Ocean Data View (ODV; Schlitzer, 2015). > High res figure
|
DISTRIBUTION OF MODERN SEAWATER Nd ISOTOPIC COMPOSITION
Neodymium is among the rare earth elements (REE) that are characterized by coherent chemical and physical properties. It has seven isotopes, and one of them, 143Nd, is an α-decay product of 147Sm, with a half-life of 1.06 × 10¹¹ years. Samarium and Nd are fractionated during melting and crystallization, resulting in 143Nd/144Nd ratios that change in rocks as a function of age and lithology. Continental material is the major Nd source to the ocean (Figure 2), and the seawater Nd isotopic signature reflects the 143Nd/144Nd values of continents surrounding the ocean basins. Because of the relatively small range of 143Nd/144Nd, the isotopic ratio is typically expressed by the notation εNd.
εNd = [(143Nd/144Nd)sample/(143Nd/144Nd)CHUR – 1] × 104,
where CHUR is a chondritic uniform reservoir with a 143Nd/144Nd ratio of 0.512638 (Jacobsen and Wasserburg, 1980) or of 0.512630 (Bouvier et al., 2008). The advantages of the Nd isotopic composition of seawater, as compared to the carbon isotopic composition (13C/12C or δ13C) of seawater, another frequently used water mass tracer, is that the former experiences negligible biological fractionation and is not influenced by air-sea exchange.
In modern deep waters (≥1,500 m), the lowest εNd values of about –15 are found in an area surrounded by an old craton in the Labrador Sea and area. In contrast, the highest values close to 0 are observed in tropical and North Pacific waters as a result of abundant young volcanogenic material found there (Jeandel et al., 2007; Figure 1). The Southern Ocean and Indian Ocean present deepwater εNd values intermediate between the North Atlantic and the tropical and North Pacific Oceans, which is consistent with the pattern of global thermohaline circulation (Figure 1). The spatial heterogeneity of deepwater εNd values is also coherent with the estimated residence time of Nd in the ocean of 360 to 700 years (Tachikawa et al., 2003; Siddall et al., 2008; Rempfer et al., 2011), less than the mean mixing time of the deep ocean, which is about 1,500 years in the modern ocean (Broecker and Peng, 1982).
Net Nd sources to the ocean include partial dissolution of atmospheric inputs and of river sediments as well as river water after Nd removal in estuaries (Tachikawa et al., 2003; Figure 2). In reconciling both Nd concentration and isotopic distribution, water-sediment interaction along continental margins, called “boundary exchange,” has been considered the most important Nd source to the ocean (Lacan and Jeandel, 2005; Arsouze et al., 2009; Rempfer et al., 2012). The precise mechanism of boundary exchange, however, has not yet been fully identified, and it may include submarine groundwater discharge (Johannesson and Burdige, 2007) as well as benthic flux (Abbott et al., 2019, and references therein). In the open ocean, away from continental inputs, reverse scavenging transports Nd isotopic signatures vertically from shallower toward deeper water masses by dissolved/particulate interaction (Bertram and Elderfield, 1993; Figure 2). Even if this process is essential for producing observed depth profiles of seawater Nd concentration, the main control on deepwater εNd values in the open ocean is estimated to be the mixing of water masses characterized by distinct isotopic signatures (von Blanckenburg, 1999; Frank, 2002; van de Flierdt et al., 2016; Tachikawa et al., 2017).
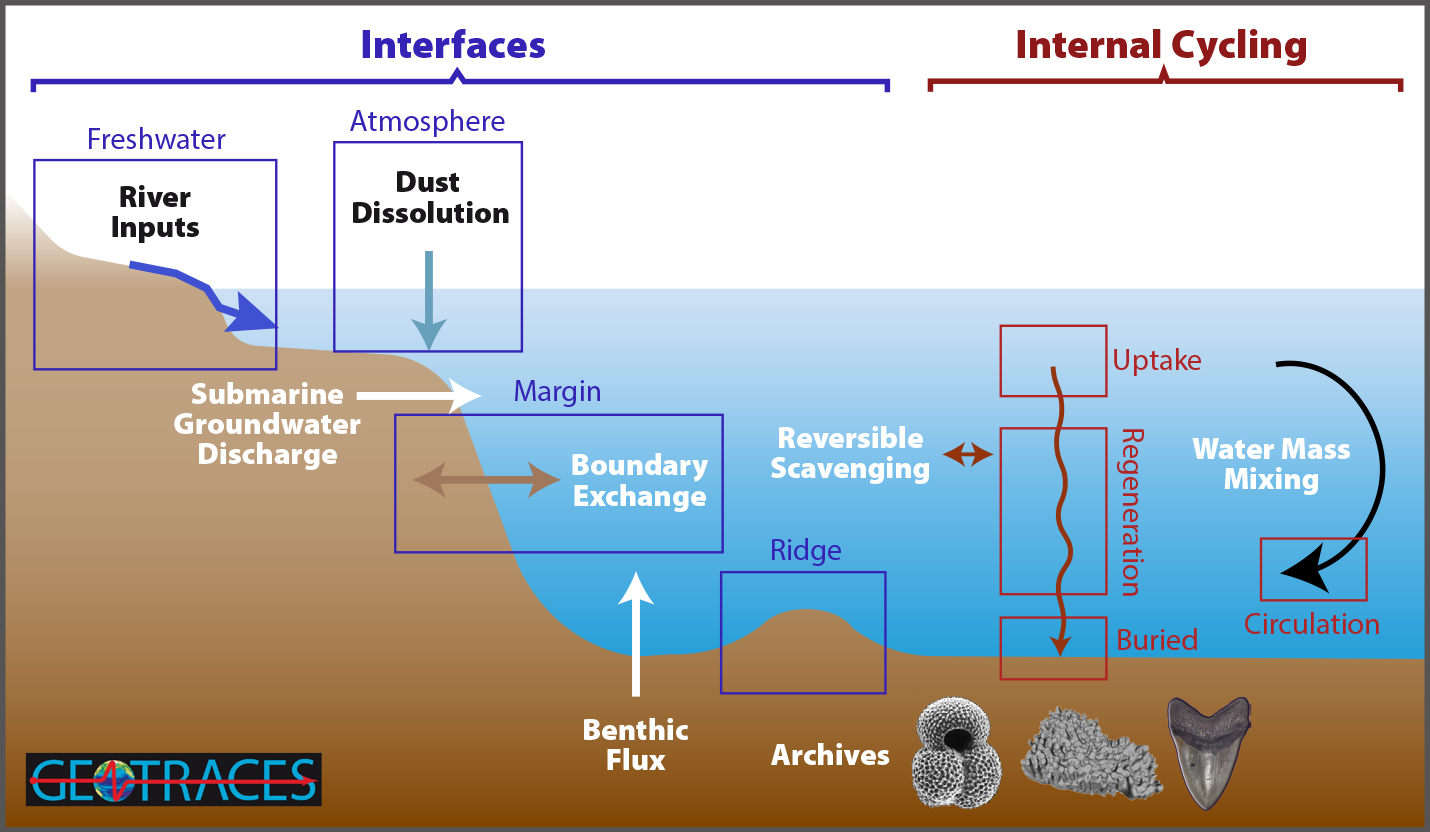
FIGURE 2. Neodymium sources and processes affecting oceanic Nd concentration and isotopic composition as well as possible marine sedimentary records of Nd isotopic composition. Figure based on data from GEOTRACES (http://www.geotraces.org/) modified to summarize the oceanic Nd cycle. > High res figure
|
IS Nd ISOTOPIC COMPOSITION A RELIABLE TRACER OF OCEAN CIRCULATION?
In order to identify oceanic regions significantly affected by local/regional lithogenic inputs that may mask water mass mixing effects, a compiled deepwater εNd database was compared with the values derived from empirical equations that predict seawater εNd from hydrography parameters (temperature, salinity, concentration of silicate, phosphate, and oxygen; Tachikawa et al., 2017). Assuming that the offset from the predicted values indicates the local/regional lithogenic influence on deepwater εNd values, regions with strong local/regional effects were compared with the open ocean (Figure 3a,b). The most striking global feature is the positive offset in the tropical Pacific (Figure 3a,b) that is due to the strong influence of boundary exchange (Lacan and Jeandel, 2001; Grenier et al., 2013). In this region, abundant labile volcanogenic matter releases radiogenic Nd to deep water. Moreover, the deep water in this area is poorly ventilated, increasing the importance of local Nd sources relative to water mass mixing effects.
Predicted εNd seawater signatures can be compared to marine archives of fish teeth/debris, deep-sea corals, and authigenic fractions associated with foraminiferal tests or bulk sediments (Tachikawa et al., 2017; Figure 3c). The archival εNd values from the major part of the Atlantic Ocean (except for the northern North Atlantic; Elmore et al., 2011) show general agreement with the predicted values, suggesting that this proxy is reliable. In contrast, some areas of the Pacific Ocean are characterized by positive offsets (Figure 3c). One possible reason for the offsets is the contribution of porewater Nd (Du et al., 2016; Skinner et al., 2019) that is more evident in the Pacific because the Nd isotopic composition of porewater could be significantly higher than that of the bottom water (Figure 3d). The detrital fraction can contain exchangeable Nd such as volcanogenic matter, Fe-Mn coating, and clay minerals that release Nd to porewater during early diagenesis (Abbott et al., 2019; Du et al., 2016).
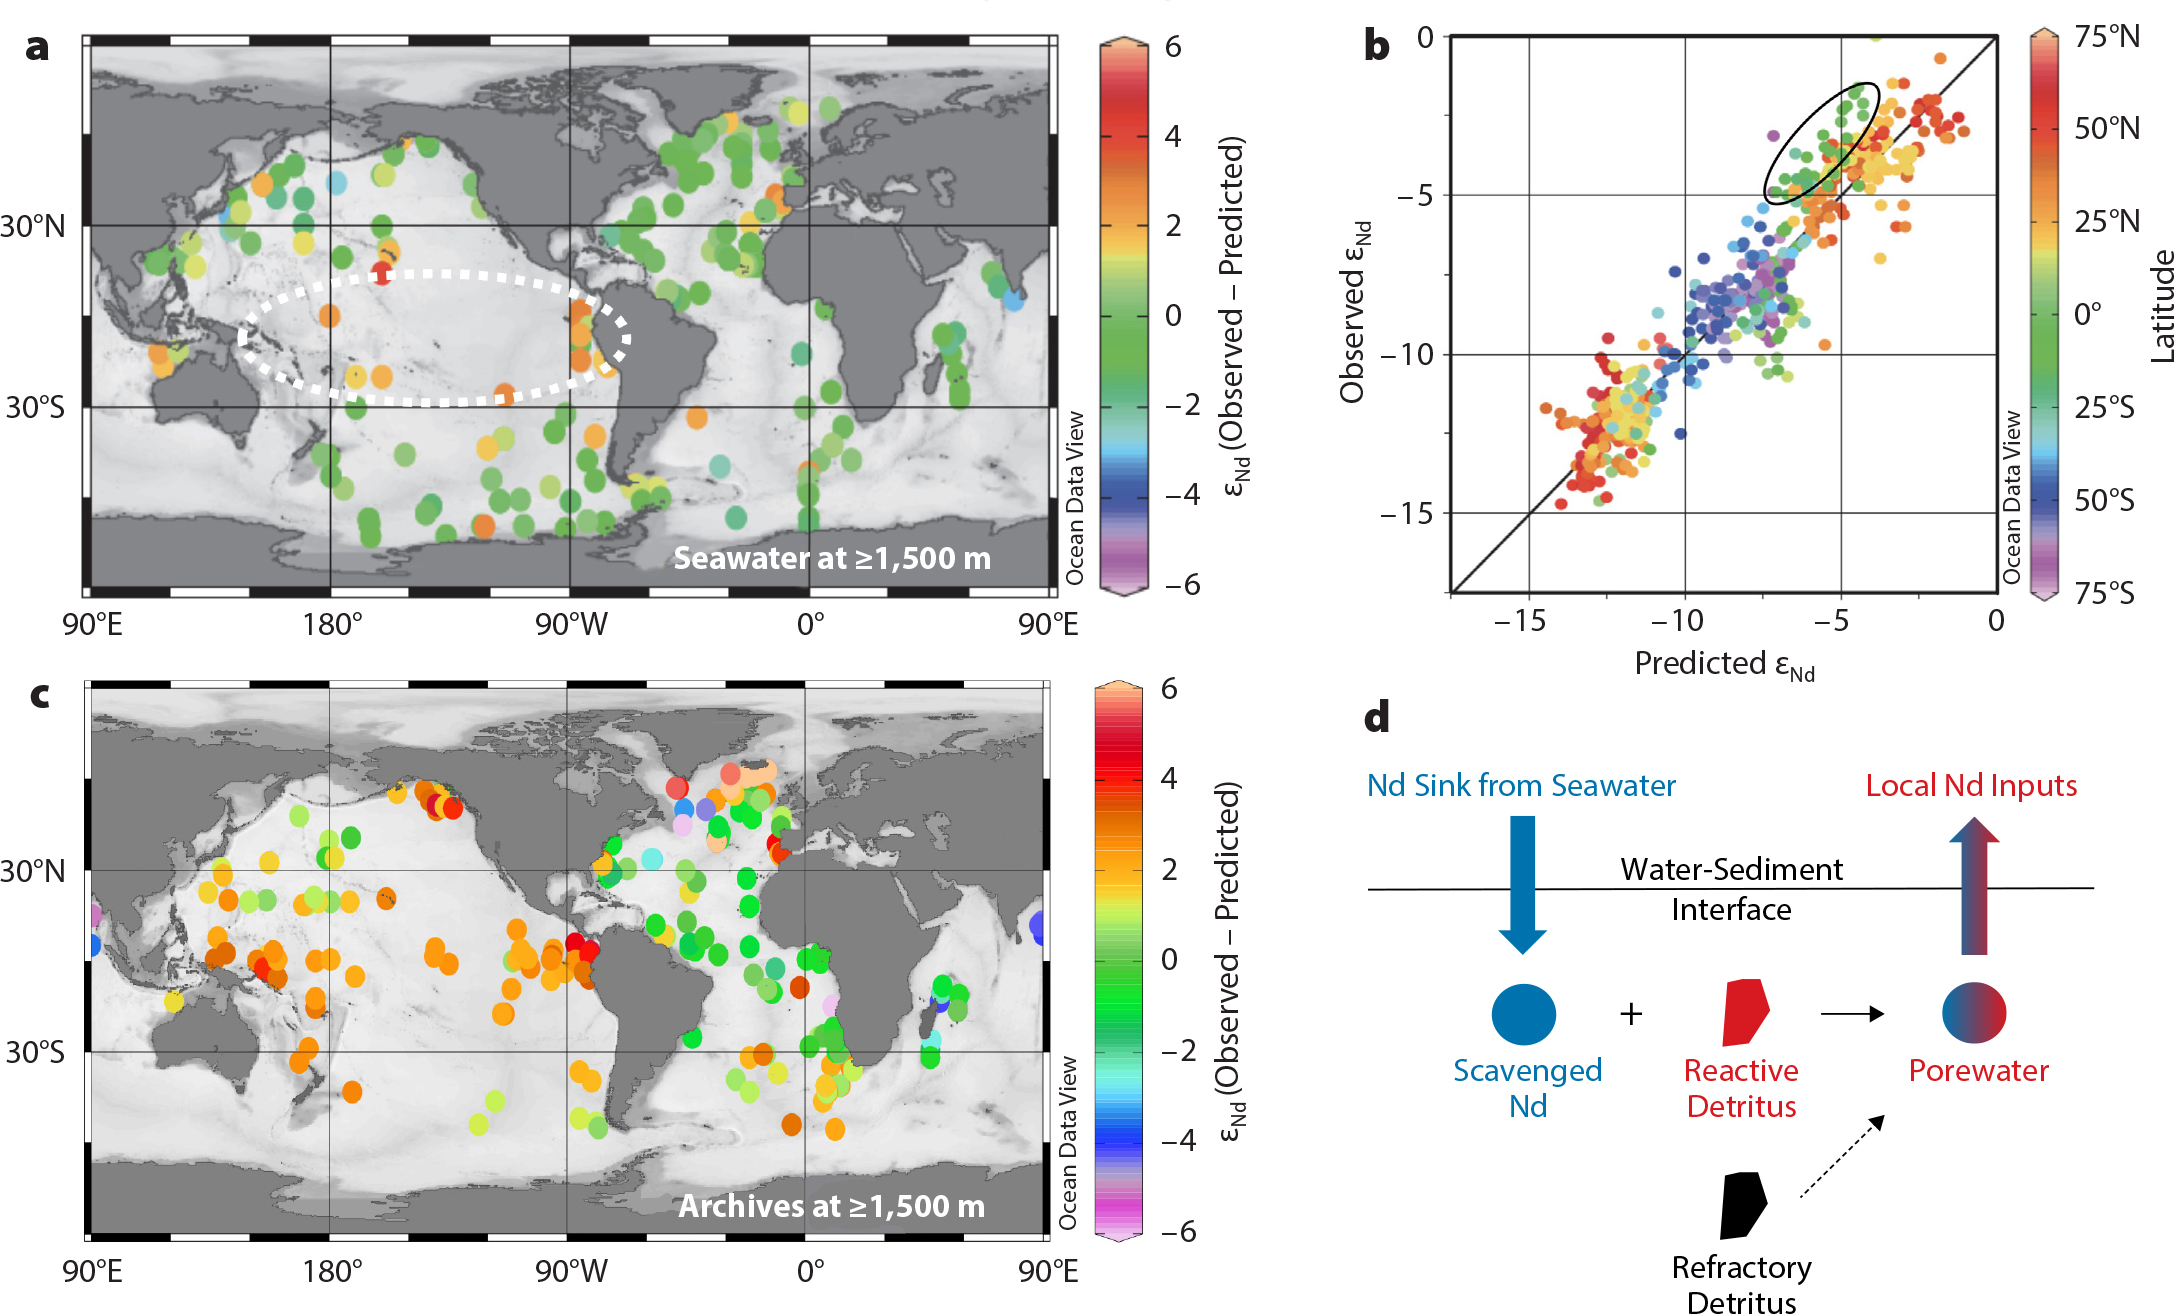
FIGURE 3. Comparison of observed and predicted values for Nd isotopic composition. (a) Spatial distribution of εNd offsets between modern deepwater (≥1,500 m depth) and predicted values using empirical equations (Tachikawa et al., 2017). (b) Relationship between measured deepwater Nd isotopic composition and predicted values. (c) Spatial distribution of εNd offsets between archived Holocene (≤10 kyr) sediments and predicted seawater values. (d) Schematic presentation showing the porewater Nd contribution that creates εNd offsets between archival and predicted values. The white dashed ellipse in (a) and the black solid ellipse in (b) indicate the observed εNd offsets in the tropical Pacific. (a), (b), and (c) are adapted from Tachikawa et al. (2017) and (d) is adapted from Du et al. (2016). > High res figure
|
It is possible that the predicted εNd values do not perfectly represent bottom water isotopic composition because the equations are based on empirical relationships established using limited seawater data. Nevertheless, a possible porewater Nd contribution should be taken into account in the interpretation of Nd isotopic composition, in particular, at sites where recent marine sediment values significantly differ from the seawater values. Additional process studies and further modeling efforts are required to better understand the possible contribution of local Nd inputs to the ocean. For paleoceanography studies, a multiproxy approach is recommended to obtain robust reconstructions. If proxy response diverges from predicted values, a better understanding of proxy behavior will provide new insights into overlooked processes.
CLIMATE TRANSITION DURING THE MID-PLEISTOCENE AND POSSIBLE OCEAN CIRCULATION CHANGES
In this final section, we reconstruct seawater εNd by studying cores from the eastern Atlantic in order to obtain insight into the role of ocean circulation changes during the MPT (1,200–800 kyr; Figure 4). The MPT is marked by an amplification of the glacial/interglacial cycle with the development of longer and more severe glacial periods and a shift from a 41 kyr to a 100 kyr cycle (Clark et al., 2006) (Figure 4a). Because insolation forcing does not explain such changes (Figure 4b), internal feedbacks are of primary importance.
Among possible mechanisms explaining the MPT, one hypothesis is regolith removal that allowed the formation of thicker and more stable ice sheets by increasing basal stability (Clark et al., 2006) and subsequent atmospheric circulation changes. A recent study suggests that changes in ice sheet dynamics alone could not explain the MPT and that the combination of regolith removal and reduced atmospheric CO2 concentration by an efficient biological carbon pump was necessary (Chalk et al., 2017). In addition to the biological pump, the development of Southern Ocean stratification during glacial periods between 900 ka and 600 ka was suggested as a physical mechanism that permitted the storage of more carbon in the deep ocean and resulted in colder and longer glacials (Hasenfratz et al., 2019). To date, a precise evaluation of the carbon cycle at this transition is not possible because of the scarcity of atmospheric CO2 reconstruction for the MPT (Hönisch et al., 2009; Bereiter et al., 2015; Higgins et al., 2015; Chalk et al., 2017; Dyez et al., 2018; Figure 4c). Regarding ocean circulation, benthic foraminiferal δ13C records show a prominent decrease centered at 900 ka, called the “900 ka event” on the global scale (Raymo et al., 1990; Clark et al., 2006; Figure 4d). This change is considered to be a major perturbation of oceanic carbon chemistry.
In order to investigate the ocean circulation changes at the 900 ka event, seawater εNd values were reconstructed at ODP sites 1267 (28°S, 4,400 m water depth), 1088 (41°S, 2,080 m water depth), and 1090 (43°S, 3,700 m water depth) (Pena and Goldstein, 2014; Farmer et al., 2019) in the southeastern Atlantic (Figures 4e and 5a,b). We combine these εNd records with other reported data at ODP sites 1088 (Hu et al., 2016; Dausmann et al., 2017) and 1090 (Howe et al., 2016) to extract the main features. ODP site 1267 is located north of Walvis Ridge where a bathymetric barrier minimizes the southern-sourced deepwater contribution to the basin. Thus, it is mostly influenced by North Atlantic Deep Water (NADW; Farmer et al., 2019). In contrast, ODP sites 1088 and 1090 are currently bathed by the southern-sourced water masses, Upper Circumpolar Deep Water (UCDW) and Lower Circumpolar Deep Water (LCDW), with a possible contribution of Antarctic Bottom Water (AABW) at 1090 (Figure 5b). Reflecting these water masses, the present-day εNd value at ODP site 1267 is lower than those at sites 1088 and 1090, and the difference has been maintained for the past 1,200 ka (Figure 4e). In general, glacial εNd values are higher than interglacial values, and smaller glacial/interglacial εNd amplitude is observed at the three sites before the 900 ka event compared with the period after the MPT. At the 900 ka event, the reconstructed Nd isotopic composition is as high as in more recent glacial values. We define the high εNd values at the 900 ka event relative to the modern isotopic ratio as εNd anomalies.
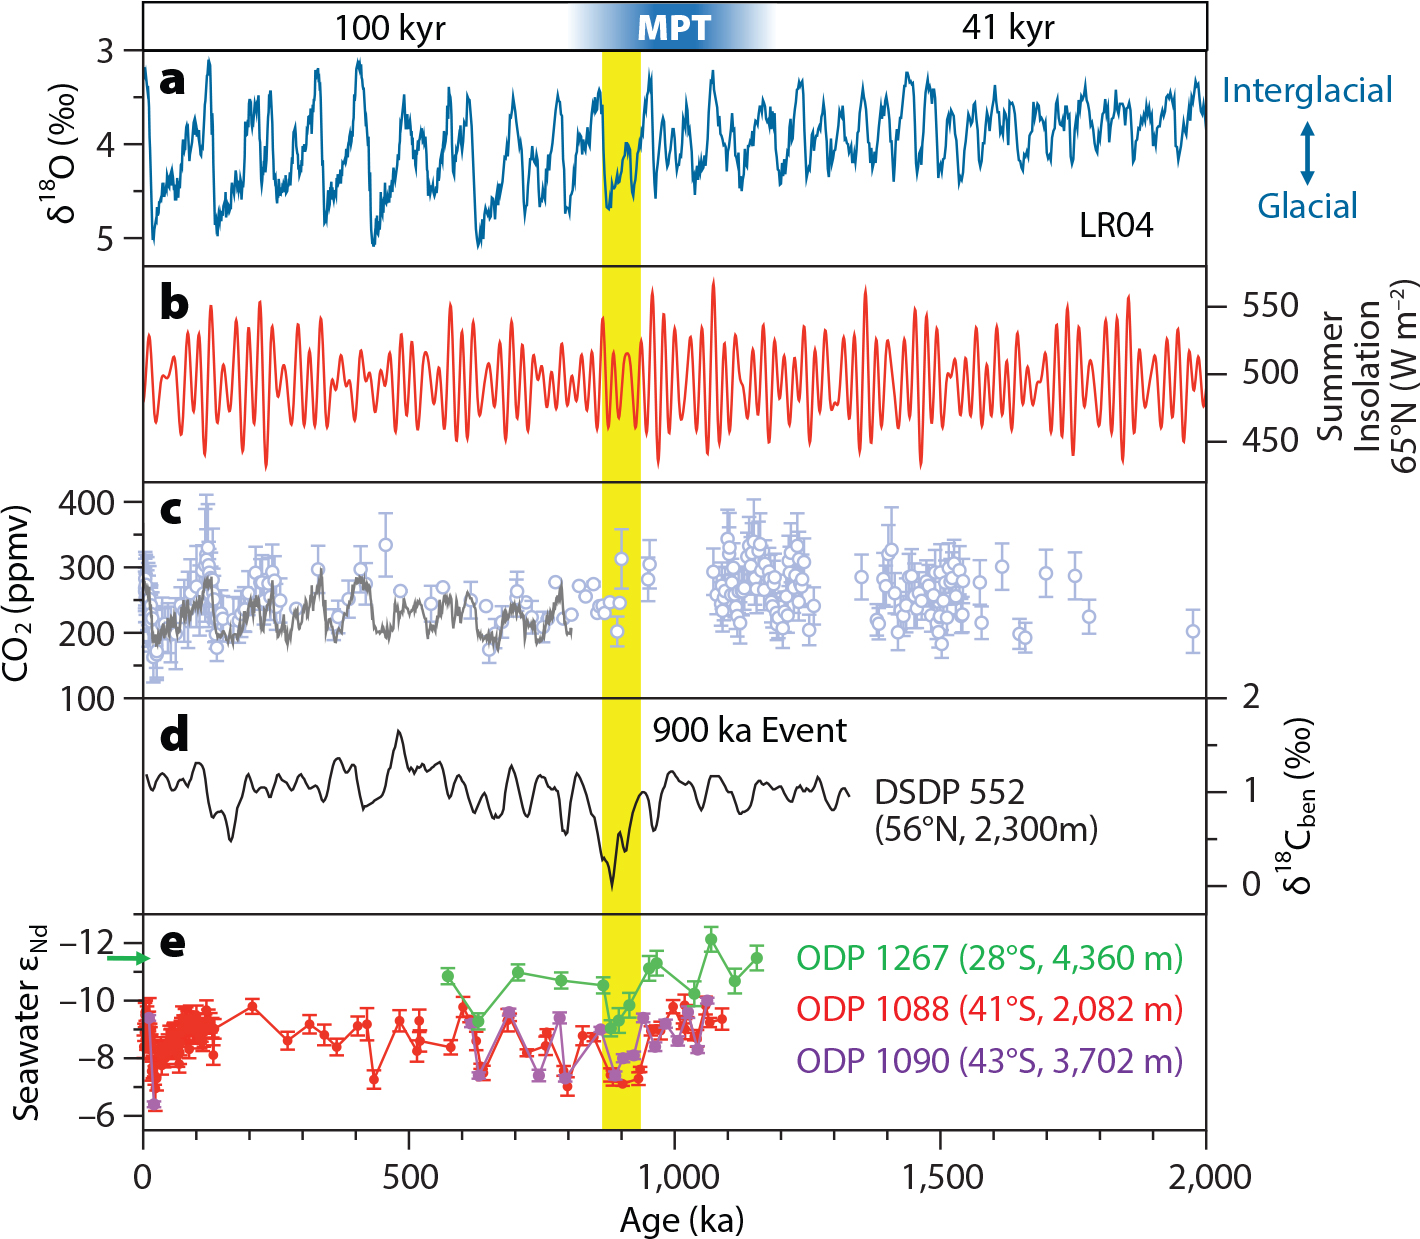
FIGURE 4. Variability across the Mid-Pleistocene transition (MPT). (a) Stack of benthic foraminiferal oxygen isotopic composition (δ18O) over the last 2 million years (Lisiecki and Raymo, 2005) as an indicator of glacial/interglacial cycles. (b) Summer insolation at 65°N over the last 2 million years (Laskar et al., 2004). (c) Reconstructed atmospheric CO2 concentration (Hönisch et al., 2009; Bereiter et al., 2015; Higgins et al., 2015; Chalk et al., 2017; Dyez et al., 2018). (d) Benthic foraminiferal carbon isotopic composition (δ13C) record of core from Deep Sea Drilling Project (DSDP) site 552 from the northern Northeast Atlantic (56°N, 23°W, 2,300 m water depth) over the past 1.3 million years (Raymo et al., 1990) as an example of oceanic δ13C changes. (e) Previously published seawater εNd records across the Mid-Pleistocene transition at three sites in the eastern Atlantic: Ocean Drilling Program (ODP) sites 1088 (41°S, 13°E, 2,080 m) and 1090 (43°S, 9°E, 3,700 m), and ODP site 1267 (28°S, 2°E, 4,400 m). Data are from Dausmann et al. (2017); Farmer et al. (2019); Howe et al. (2016); Hu et al., 2016; Pena and Goldstein (2014). The green arrow along the y-axis indicates the present-day seawater εNd value estimated by the empirical equation using temperature and dissolved oxygen concentration (Tachikawa et al., 2017). The yellow band indicates the “900 ka event.” > High res figure
|
We extended the spatial coverage of εNd anomalies at the 900 ka event by adding two new cores, MD03-2705 (18°N, 3,090 m water depth) and ODP 1085 (29°S, 1,730 m water depth) from the Northeast and Southeast Atlantic (Figure 5a,b). In the modern ocean, the location of core MD03-2705 is occupied by NADW, whereas the core from ODP site 1085 is located at the boundary between NADW and UCDW, with a higher εNd value (Figure 5b). It is worth mentioning that εNd values reconstructed from eastern Atlantic Holocene sediment archives generally agree with predicted seawater values (Figure 3c). Our new results and previous studies all indicate positive εNd anomalies at the 900 ka event. The details of new records are combined with epibenthic foraminiferal stable isotope records and modeling experiments in recent work of author Tachikawa and colleagues.
If we assume that the observed εNd shift is produced by circulation changes alone, a possible explanation is either a reduction in the formation of northern-sourced water or enhanced formation of southern-sourced water. To evaluate these possibilities, we compare the distribution of the reconstructed εNd anomalies at the 900 ka event with simulated zonally averaged modeled Nd isotope anomalies using an Earth system model of intermediate complexity LOVECLIM (Friedrich et al., 2014; Figure 5c,d). The enhanced southern-sourced water formation and the reduction in northern-sourced water formation were simulated by removal of fresh water from the Southern Ocean and input of excess fresh water to the North Atlantic (Friedrich et al., 2014). The simulation indicates that enhanced deepwater formation in the Southern Ocean has little impact on the εNd values of intermediate and deep waters in the Atlantic Ocean (Figure 5c), whereas reduced NADW formation increases the seawater Nd isotopic signature in the major part of the Atlantic basin deeper than 1,000 m (Figure 5d). Comparison of the seawater εNd distribution pattern between the simulated and the reconstructed anomalies clearly demonstrates that the reduction in northern-sourced water formation better explains the change in seawater εNd. A source for excess freshwater is still to be elucidated. Perturbation of surface hydrology associated with the evolution of the Northern Hemisphere cryosphere could be a key process.
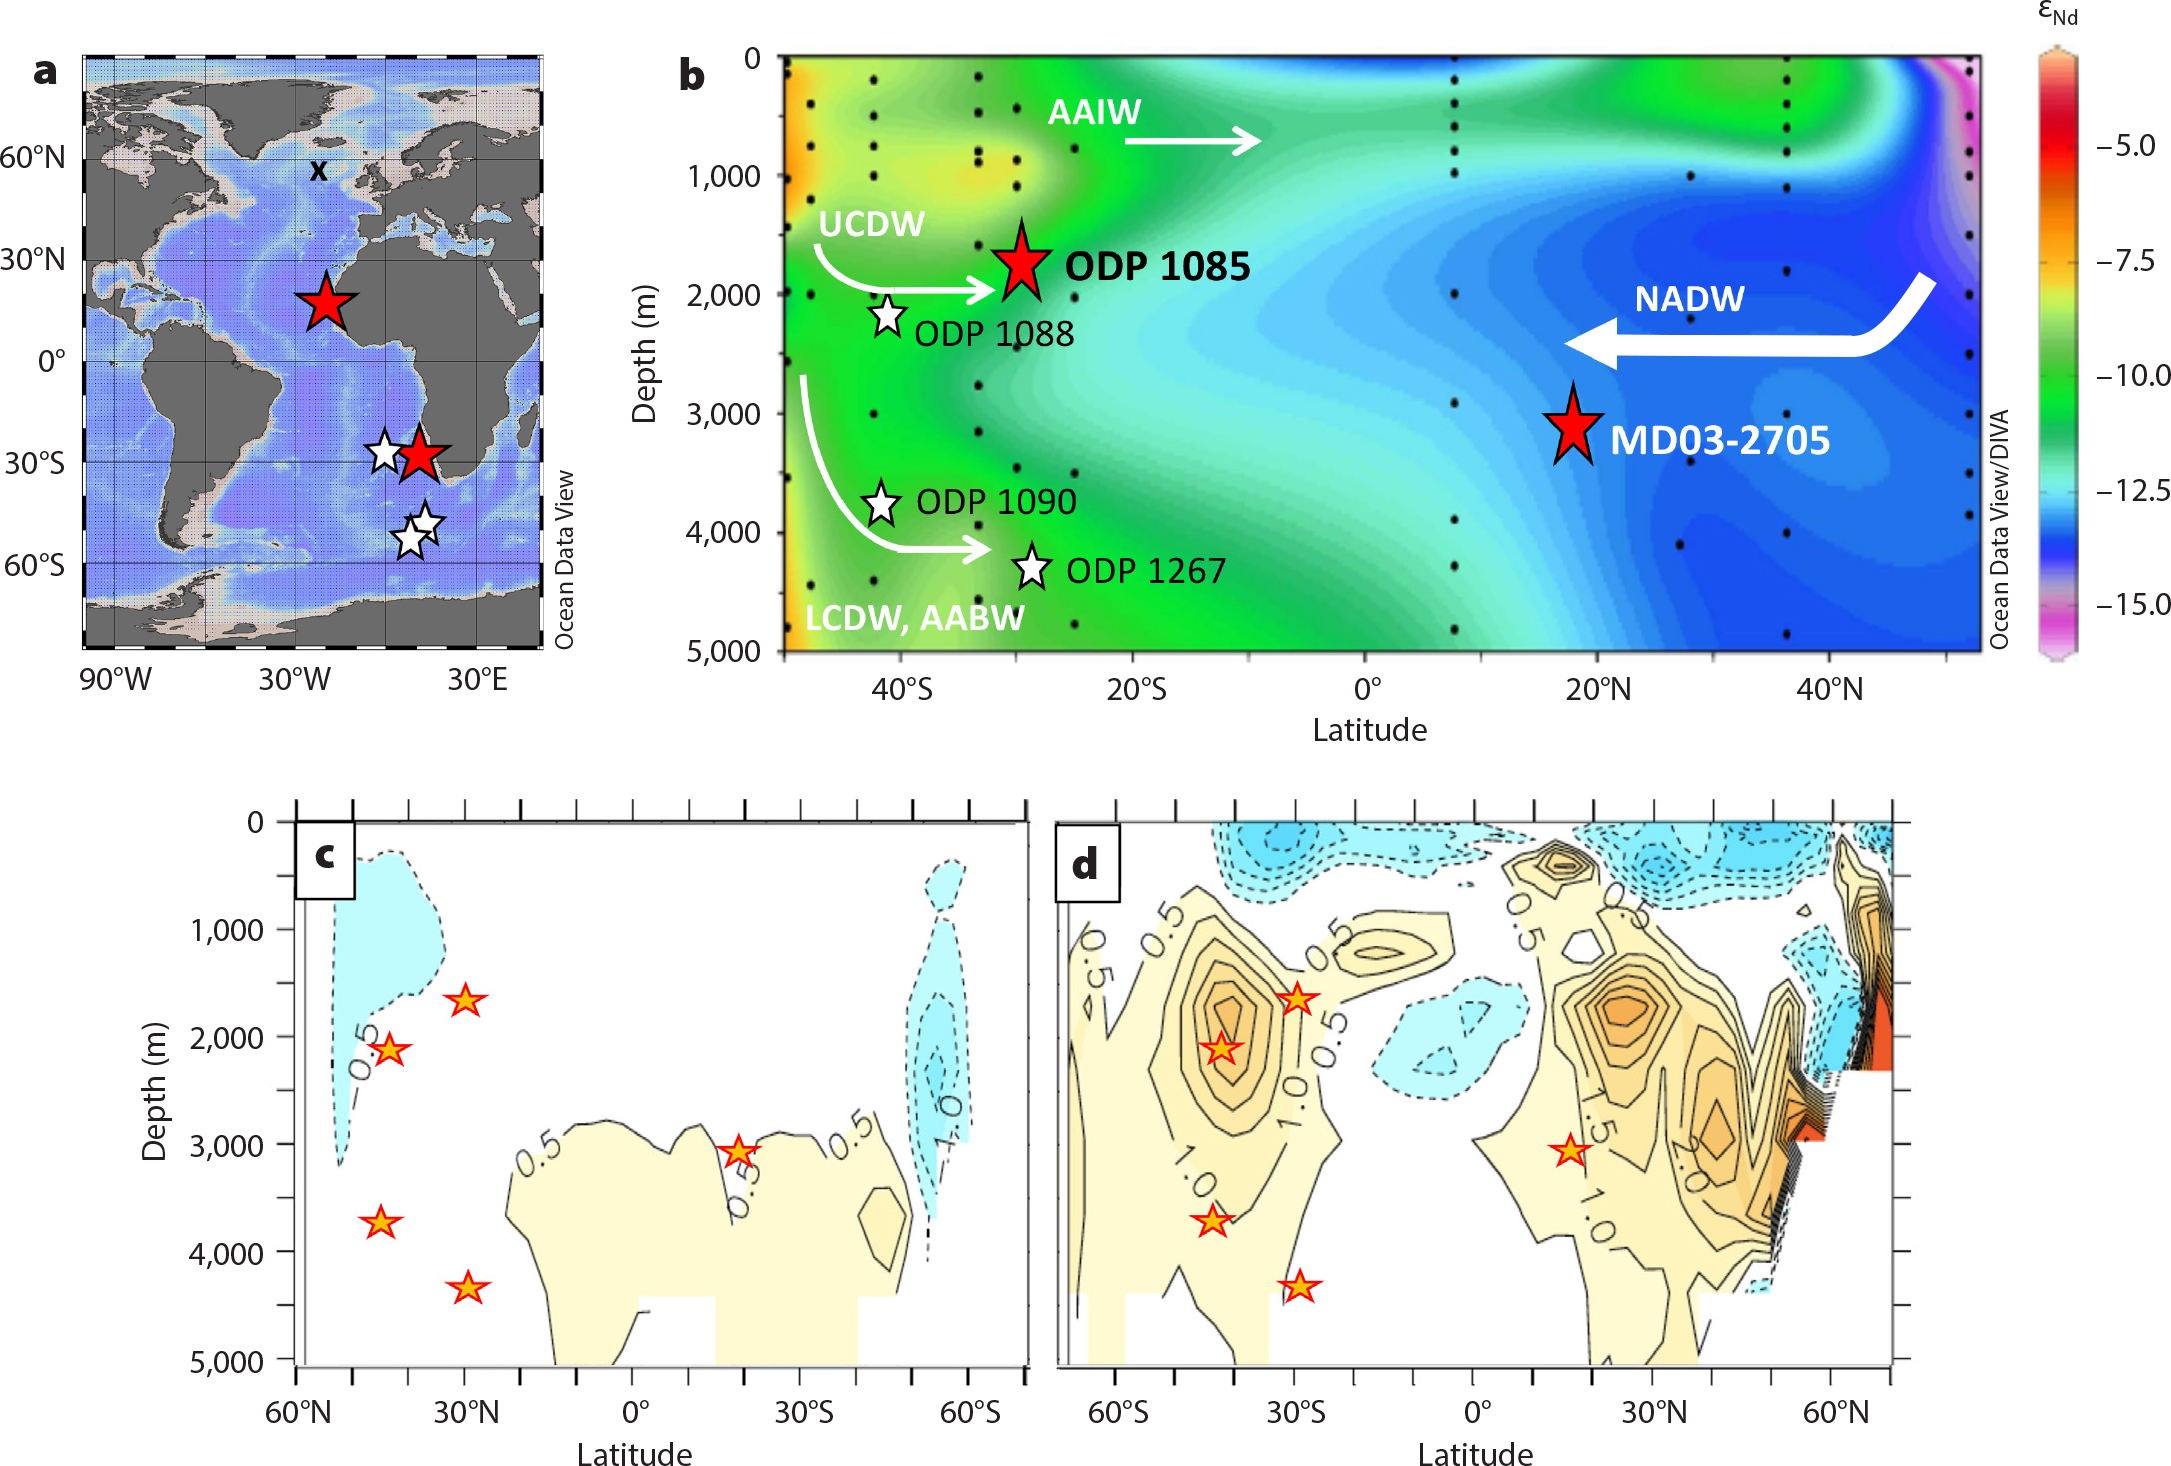
FIGURE 5. Reconstructed seawater εNd records from the eastern Atlantic. (a) Core location map in the Atlantic Ocean. The two red stars indicate cores from MD03-2705 (18°N, 21°W, 3,085 m water depth) and ODP site 1085 (29°S, 14°E, 1,725 m) studied here. The three white stars indicate the sites of previous studies: ODP sites 1088, 1090, and 1267. The black x shows DSDP site 552. (b) Latitudinal transect of present-day seawater εNd values in the Atlantic Ocean (Howe et al., 2016) with the main water masses: NADW = North Atlantic Deep Water; UCDW and LCDW = Upper and Lower Circumpolar Deep Water, AABW = Antarctic Bottom Water, AAIW = Antarctic Intermediate Water. More seawater εNd data are available GEOTRACES IDP2017 (https://www.bodc.ac.uk/geotraces/data/idp2017/), (c) Comparison between reconstructed and zonally averaged simulated seawater εNd anomalies in the case of enhanced southern-sourced water formation. The orange stars mark the sites of reconstructed seawater εNd with positive anomalies at the 900 ka event. Orange and blue shading corresponds to oceanic zones characterized by positive and negative simulated εNd anomalies. (d) The same as (c) in the case of reduced northern-sourced water formation. The simulation results are from Friedrich et al., 2014. > High res figure
|
Alternatively, the observed increase in Nd isotopic composition at the 900 ka event can be explained by changes in Nd sources to the North Atlantic that have higher εNd values. The northern-sourced water mass with higher εNd values may have been transported toward the South Atlantic if the Atlantic meridional overturning circulation was not completely shut down. We may infer this possibility by comparing the 900 ka event with the LGM state. The 900 ka event is the first time over the past 1,200 ka when seawater εNd values were as high as the isotopic ratio of more recent glacial periods including the LGM (Figure 4e), and it is when the first drop in sea level comparable to that of the post-MPT glacial levels occurred (Figure 4a). The εNd value of northern-sourced water has been assumed to be constant during the late Pleistocene glacial/interglacial cycles, but several modeling studies suggest the possibility of a more radiogenic glacial Nd isotopic ratio for northern-sourced water (Arsouze et al., 2008; Menviel et al., 2020). For instance, the contribution of Labrador Sea water with a very low εNd value (Figure 1) to the northern-sourced water might have declined during the LGM because of sea ice coverage that prevented deep convection in the Labrador Sea, leading to a higher εNd value in northern-sourced water (Arsouze et al., 2008). If such a modification of northern-sourced water occurred, seawater εNd becomes generally more radiogenic in both reduced NADW and enhanced Southern Ocean deepwater formation cases (recent work of author Tachikawa and colleagues). This hypothesis should be further examined with direct evidence for changes in the deepwater convection zone in the North Atlantic at the 900 ka event and reconstruction of sea ice configuration at that period.
The evolution of the Northern Hemisphere cryosphere is estimated to have been involved in the mechanism of the 900 ka event either via reduced deepwater formation or changes in Nd sources to the North Atlantic. Better spatial coverage of records including data from the different ocean basins and the combination of Nd isotopic composition with other proxies will further clarify the processes involved.
“The increase in high-quality data concerning seawater Nd isotopic composition in the modern ocean confirms the capacity of this proxy to trace large-scale ocean circulation patterns.”
CONCLUSIONS
The increase in high-quality data concerning seawater Nd isotopic composition in the modern ocean confirms the capacity of this proxy to trace large-scale ocean circulation patterns. The tropical Pacific Ocean, which is potentially affected by regional/local lithogenic Nd inputs, is characterized by the presence of labile volcanogenic matter and less than vigorous bottom water circulation. The εNd offsets between the sedimentary record and predicted values can be explained at least partly by a porewater Nd contribution of diagenetic origin that varies spatially.
At the 900 ka event, the eastern Atlantic records indicate a positive shift in the reconstructed seawater εNd values relative to the modern values in both the northern and the southern basins. This shift can be explained either by a reduction in North Atlantic Deep Water formation and/or by changes in the Nd source to the North Atlantic with higher εNd values relative to the evolution of the Northern Hemisphere cryosphere. More active southern-sourced water formation alone cannot account for the observed changes in Nd isotopic composition.
ACKNOWLEDGMENTS
KT’s contribution to this work was supported by two French National LEFE projects, RICH (IMAGO) and NEOSYNMPA (CYBER). Samples were provided by the International Marine Global Change Study (IMAGES) program and the Ocean Drilling Program (ODP). The reviews by two anonymous reviewers were very helpful. The EQUIPEX ASTER-CEREGE project (Pierre Deschamps, one of the PIs) is acknowledged for Nd isotopic measurements. Hélène Mariot and Marta Garcia are thanked for technical support. The joint workshop PAGES-GEOTRACES provided a great opportunity to discuss the behavior of Nd isotopes in modern and past oceans.