
Full Text
Coastal communities are increasingly threatened by flooding from climate change-induced sea level rise and potential increases in storminess. Informed decisions on risk and resilience related to flood risk need to be made, but the assessment process is complex. It is difficult to bring all of the climate science and sea level rise projections to decision-making, and as a result, decisions are made without a real understanding of the uncertainties involved, a problem magnified the further projections go into the future (Figure 1).
|
|
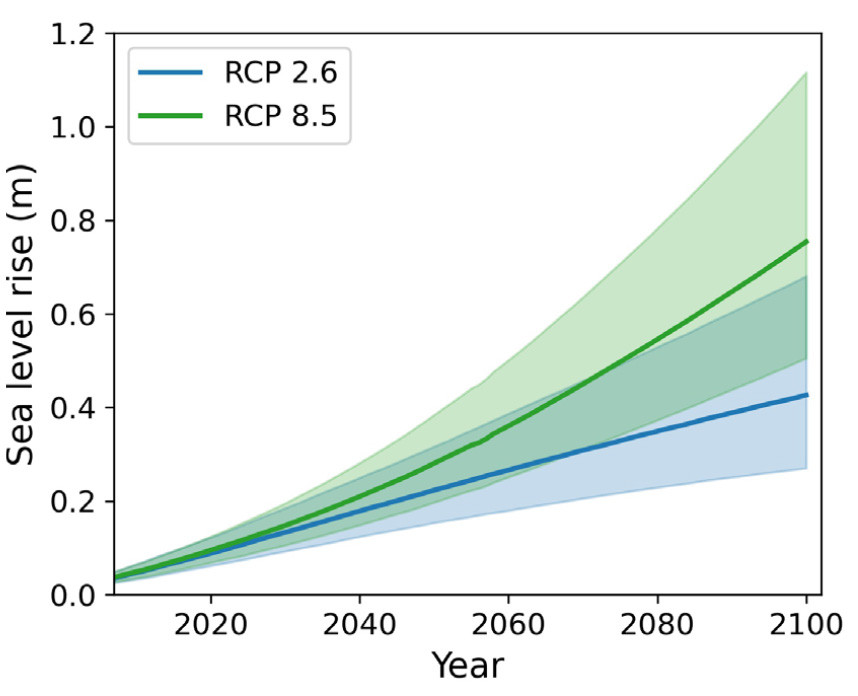
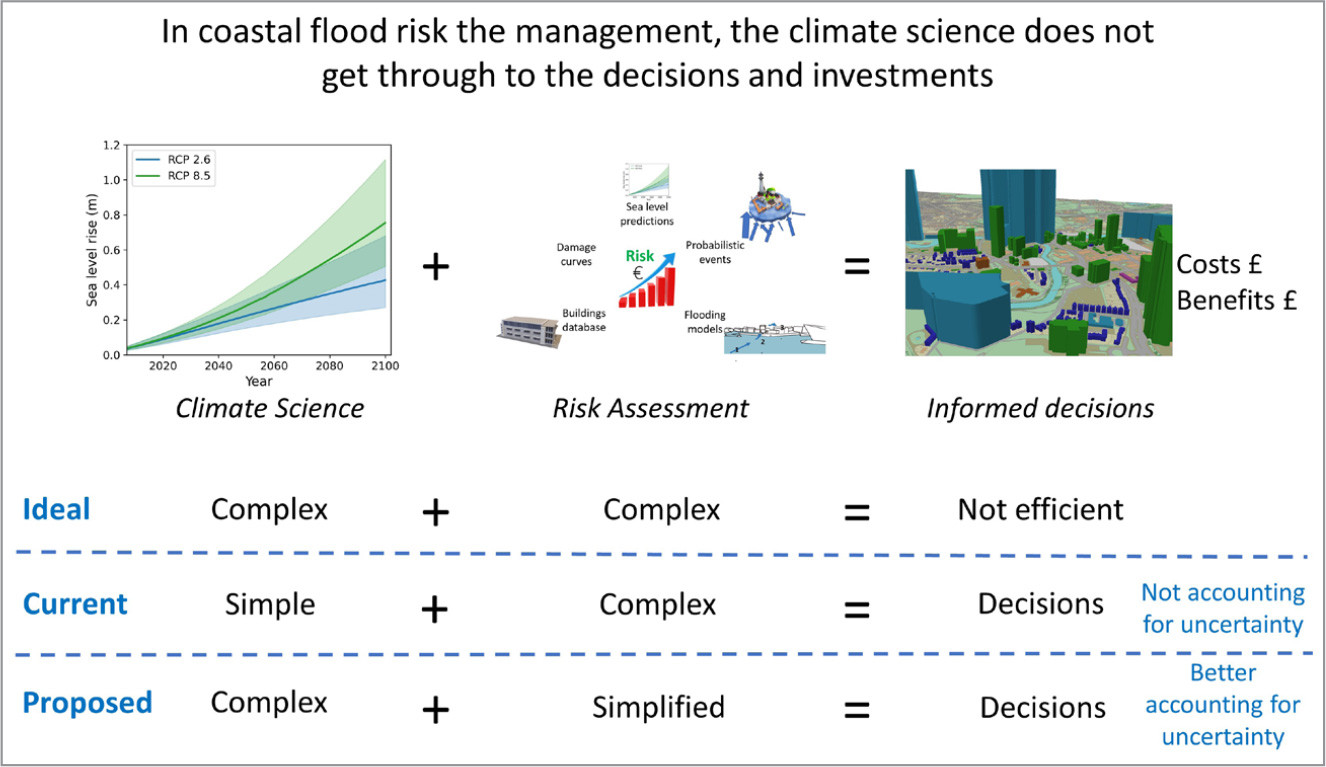
Comprehensive modeling approaches (see ideal option in Figure 2) that allow the impact of a range of potential future conditions to be assessed are not resource efficient. Therefore, the conventional approach (see current option in Figure 2) involves selecting a narrow range of future sea level rise scenarios for further interrogation—typically the median estimate (solid lines in Figure 1). In addition, the uncertainties implicit in future climate scenarios are rarely taken through the hazard-to-impact framework, resulting in poorly defined predictions and likely limited trust in outputs and low levels of uptake. The research described here (proposed option in Figure 2) uses a source-pathway-receptor model of flood risk for the city of Hull, Humber Estuary, eastern England to address these problems and develops a new streamlined approach to modeling the interactions between sea level hazards, economic activity, and risk. The purpose of this research was to examine the boundaries of the full range of climate predictions to inform judgment on where to focus attention for detailed study of and planning for future urban flood risk at the large scale and over the long term. Modeling results are not intended for more detailed design or planning activities for Hull at present (where model accuracy would become much more critical).
|
|
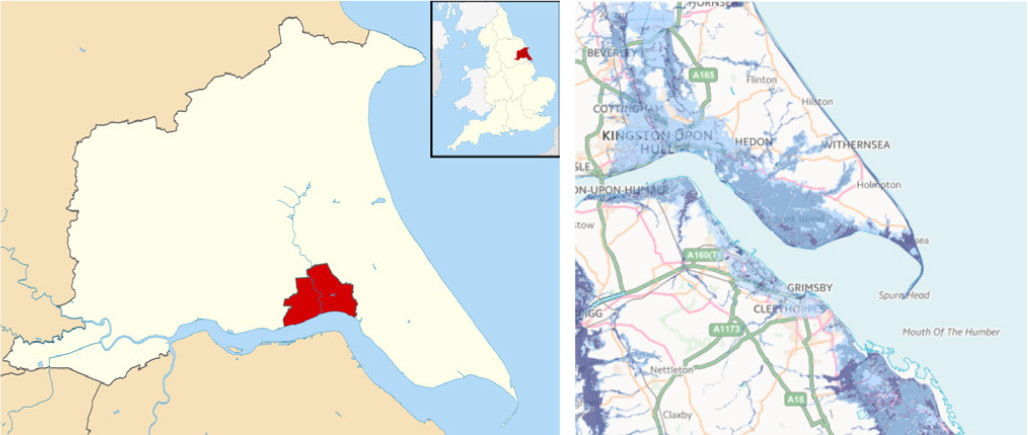
Situated on the northern bank of the Humber estuary, with a population of 258,000, Hull has the highest number of UK properties at risk of flooding (140,000) in a single urban area outside of London (Figure 3). England’s Environment Agency has warned that, with changing climate, water levels in the Humber Estuary could rise by over 1 m in the next century. The city thus offers a prime case study location for testing our approach. The estuarine margins are extremely low lying; a major storm surge on December 5, 2013, inundated 7,000 hectares of low-lying ground, significantly impacting infrastructure of national importance for energy generation, industry, and agriculture. In addition, Hull is at risk from flooding by the River Hull, which flows through the city center, as well as surface water flooding. The city is currently protected by a tidal surge barrier and by flood defenses that run along the Humber frontage and the river banks. Though many of these defense structures are being strengthened and upgraded, studies predict a continuing risk of breach. Furthermore, “mid-range” sea level rise will reduce the Standard of Protection (SoP) of most of the existing tidal defenses structures to less than 1:5 (20% annual chance of flooding) by around 2040. The SoP will continue to decline between 2040 and 2115 as sea level rises further. These issues clearly illustrate the need for better informed flood risk management options for the city.
|
|
The modeling of the physical flood hazard takes a three-step approach (Figure 4). It involves: (1) collating the range of potential nearshore hydrodynamics, (2) calculating the pathway of water onto the land through overflow and wave overtopping of the defense line, and (3) determining how the flood water spreads behind the defense.
|
|
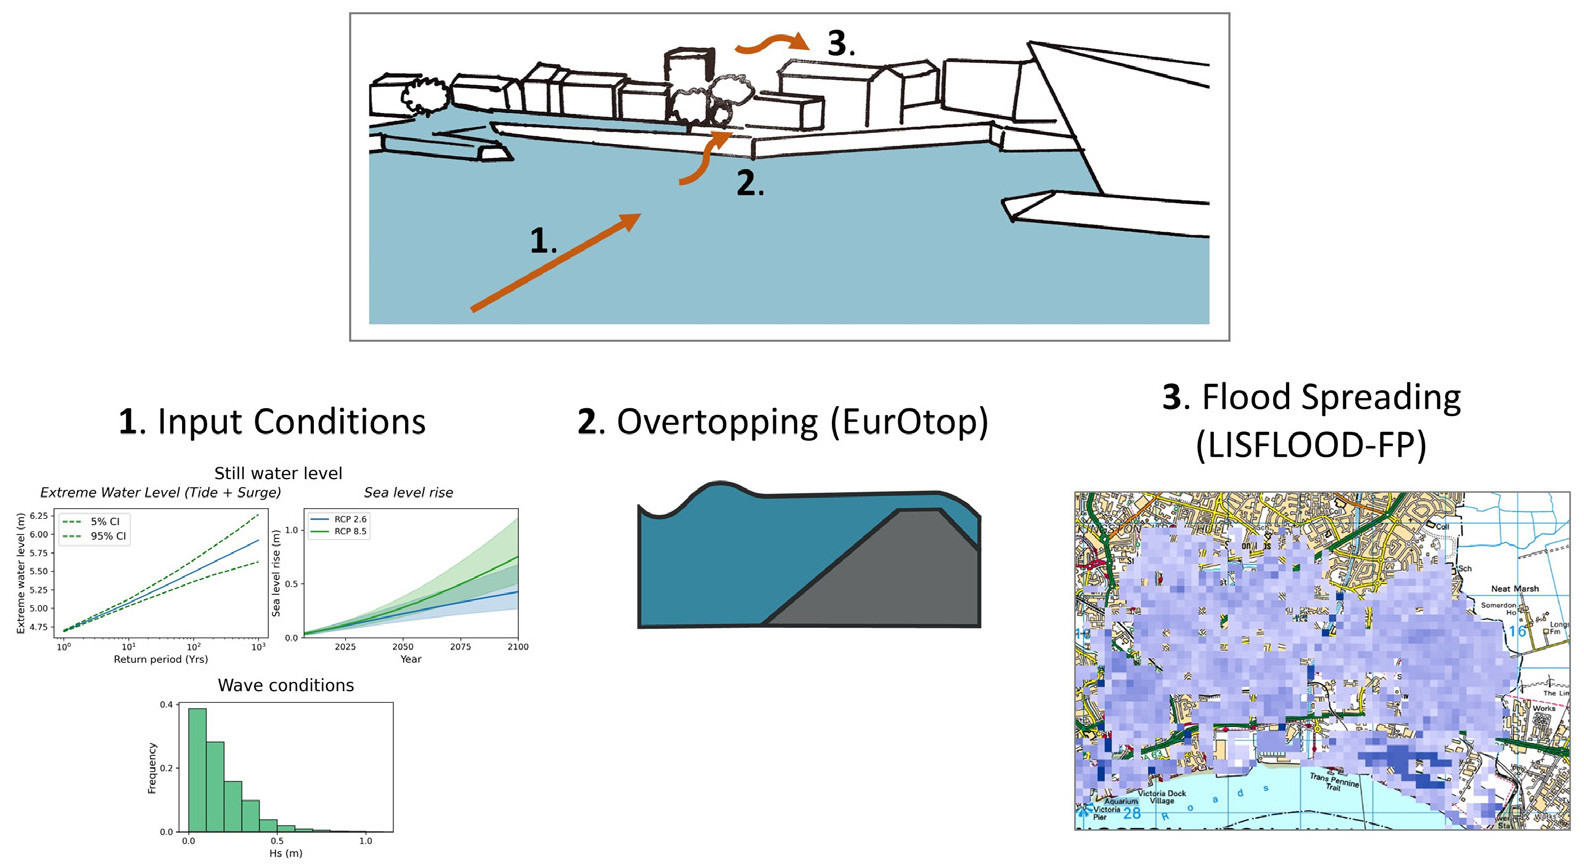
A matrix of input conditions covered (1) the full range of sea level rise scenarios from the marine UK Climate Projections 2018 (Palmer et al., 2018), including variation between emissions scenarios and uncertainty over predicted rise for each scenario; (2) transient augmentation of the still water level due to storm surges; and (3) a range of wave conditions. The input hydrodynamics were then used to calculate overtopping discharge at representative transects on the coastal defenses of the Humber using the EurOTop manual (Van der Meer et al., 2018). The overtopping discharge time series was then used to drive a LISFLOOD-FP flood model (Bates and De Roo, 2000). A raster topographic grid file was created from lidar digital terrain map (DTM) data with a spatial resolution of 100 m to allow a fast model run time (< 1 second). Maximum water level by grid cells were then spatial averaged onto a planning viewer grid over the city of 1,000 virtual hexagons (400 m resolution). A sensitivity analysis of different grid sizes was undertaken to balance model resolution versus model run time. A qualitative assessment of model outputs (city-wide water depths) against earlier (2016) comprehensive modeling for the Hull Humber Frontage flood defense business case (https://consult.environment-agency.gov.uk/yorkshire/humber-hull-frontages/) by members of the author team showed generally good agreement between the two exercises.
In total, 21,350 model runs were completed, comprising 122 sea level rise increments (0.06–1.115 m in 0.005 m increments), seven extreme water level (including surge events) return periods (1-, 10-, 50-, 100-, 200-, 500-, and 1,000-year return periods), and 25 wave conditions (Hs 0.05–0.85 m; T 0.90–2.85 sec). Wave conditions differed depending on distance to four locations within the Humber estuary (Salt End, Alexandra Dock, Albert Bridge Dock, Hessle Haven). The wave conditions were obtained from a joint probability analysis report with wave height and direction fitted to a probability distribution function and 25 conditions chosen at random, based on probability. Wave period was selected based on a linear regression with wave height. Model runs were completed in a few hours on a standard PC laptop.
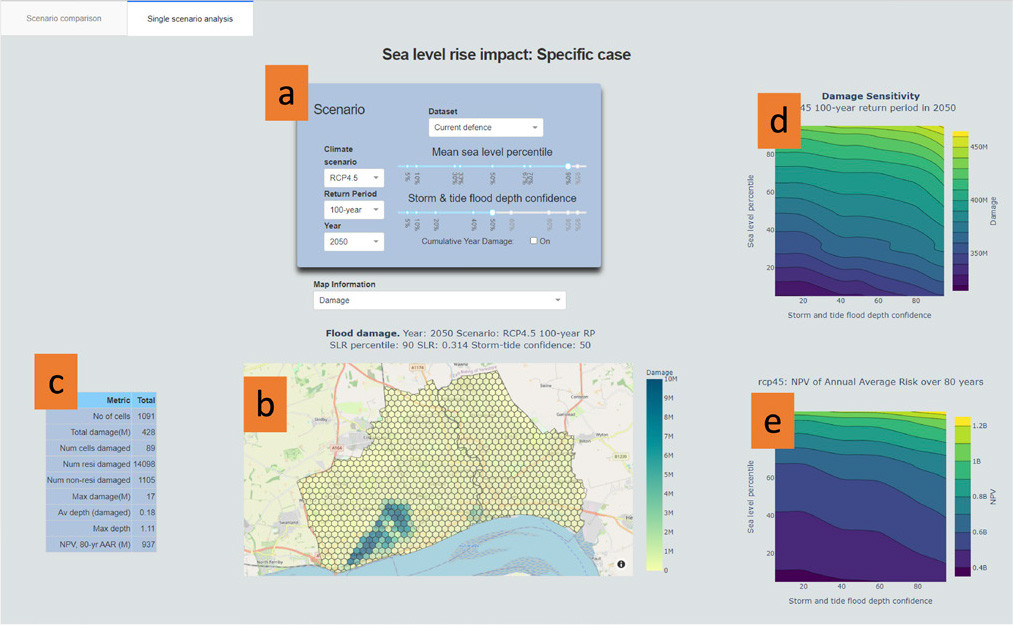
In order to generate economic impacts from flood model outputs, a simple risk model was produced, including depth damages. This model combined receptor data (houses, businesses, supplied by the Environment Agency) and depth damage data (receptor types, damages per type for varying depth, from the UK Multi-Coloured Manual produced by the Flood Hazard Research Centre with the modeled flood depths to calculate economic damages. The annual chance of each flood depth was then used to produce an annualized economic risk, converted into a present value equivalent over the duration of the analysis. A web-based visualization prototype was then created to promote discussion with stakeholders. There are two main methods of display and interrogation:
- Single scenario allows the user to look at one scenario and provides detailed metrics associated with that scenario. The user can easily change the scenario and view updated metrics (Figure 5).
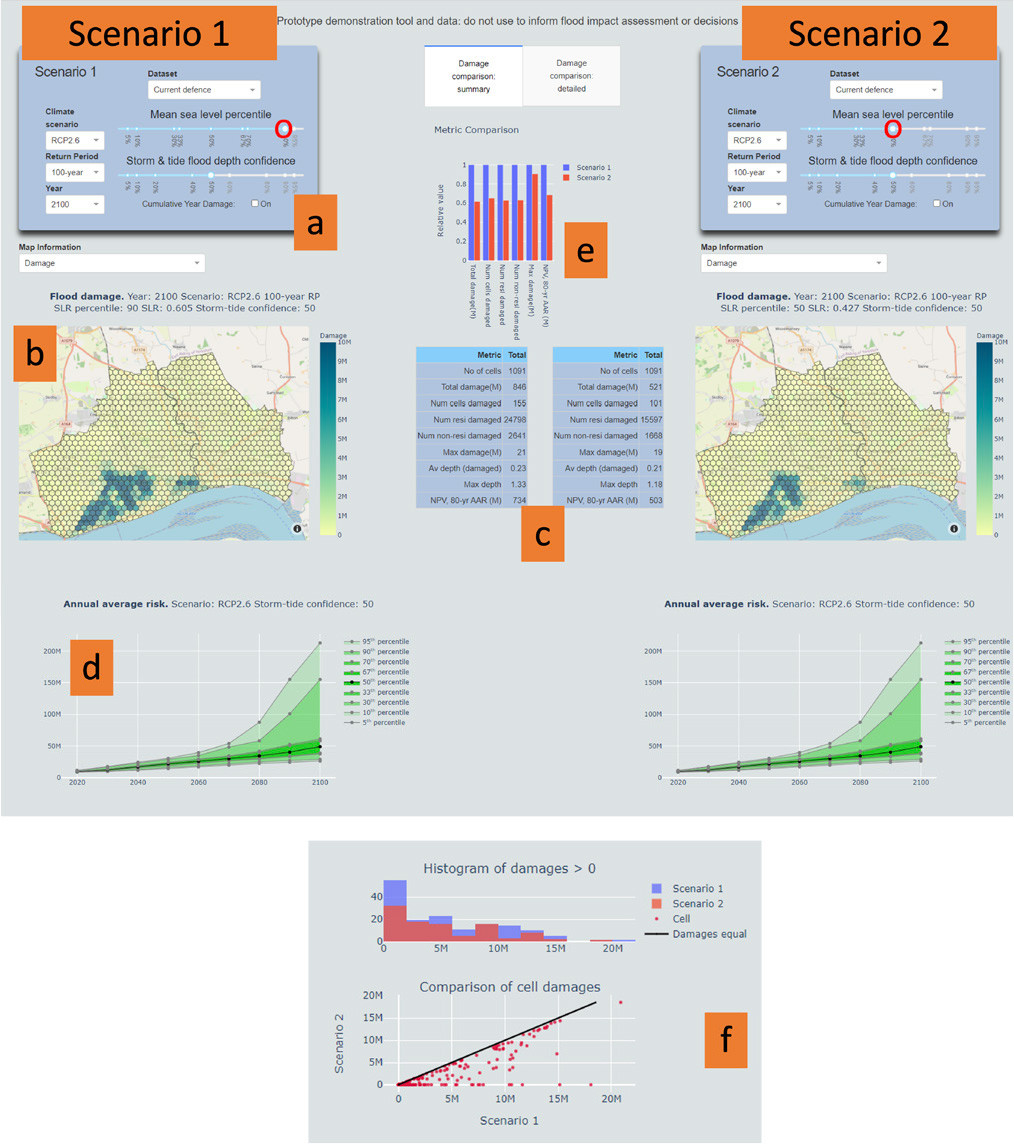
- Two-scenario comparison allows the user to directly compare two scenarios for the same data set or compare two different data sets. Again, the user can rapidly switch between scenarios to gauge the sensitivities (Figure 6).
|
|
|
|
Feedback from stakeholder meetings, including live demonstration of the visualization prototype online, confirmed that there is value in this approach: visualization explains uncertainty well and helps users to better understand their appetites for risk; it informs the planning horizons associated with adaptation to future coastal changes resulting from sea level rise; and, at smaller spatial scales, allows the spatial distribution of expected damage to be examined between scenarios and along timelines, with and without changes to local defense heights. This innovative approach brings more science through the risk assessment process and results in better-informed decision-making and investment planning.