Oceanography The Official Magazine of
The Oceanography Society
Volume 36 Issue 2–3

View Issue TOC
Volume 36, No. 2–3
Pages 60 - 69

OpenAccess

PMEL’s Contribution to Observing and Analyzing Decadal Global Ocean Changes Through Sustained Repeat Hydrography

By Zachary K. Erickson , Brendan R. Carter, Richard A. Feely, Gregory C. Johnson, Jonathan D. Sharp, and Rolf E. Sonnerup 
Jump to
Article Abstract Full text Citation References Copyright & Usage
Article Abstract

The ocean is warming, acidifying, and losing oxygen. The Global Ocean Ship-based Hydrographic Investigations Program (GO-SHIP) carries out repeat hydrographic surveys along specified transects throughout all ocean basins to allow accurate and precise quantification of changes in variables such as temperature, salinity, carbon, oxygen, nutrients, velocity, and anthropogenic tracers, and uses these observations to understand ventilation patterns, deoxygenation, heat uptake, ocean carbon content, and changes in circulation. GO-SHIP provides global, full-depth, gold-standard data for model validation and calibration of autonomous sensors, including Argo floats. The Pacific Marine Environmental Laboratory (PMEL), through sustained funding from NOAA, has developed methods to measure several of the variables routinely sampled through GO-SHIP and is a core contributor to these repeat hydrographic cruises.

CTD frame lowered over the side of R/V Roger Revelle during the 2023 occupation of GO-SHIP transect I05. Photo credit: Jomphol (Jom) Lamoonkit, University of Hawai‘i. > High res figure
Full Text

Overview of Repeat Hydrography at NOAA PMEL

Approximately 30% of anthropogenic carbon dioxide emissions are taken up by the ocean (Sabine et al., 2004; Gruber et al. 2019; Friedlingstein et al., 2022), and this carbon uptake increases seawater acidity. As the planet warms, ocean temperatures rise; indeed, heat uptake by the ocean is more consistent than atmospheric warming and comprises ~90% of Earth’s energy imbalance (von Schuckmann et al., 2020). The excess heat contributes to increased ice melt (Rignot and Jacobs, 2002; Steele et al., 2010) and seawater expansion, which amounts to about 1.3 mm yr–1 of the 3.1 mm yr–1 sea level rise rate from 1993 to 2015 (Cazenave et al., 2018). The irregular distribution of increased heat uptake also changes ocean currents; for example, large increases in warming of the northern Atlantic and Arctic Oceans have been linked in model results to shifts in ocean circulation (Desbruyères et al., 2021; Tsubouchi et al., 2021), and western boundary current extensions are expected to shift poleward in a warming world (Wu et al., 2012; Yang et al., 2016). Interactions between the surface and the abyssal ocean are also changing as surface-​intensified warming and freshening around Antarctica increase the stratification of near-surface waters, reduce mixed layer depths, increase the density differences between near-surface and deeper water masses, and decrease ventilation of the deep ocean (Capotondi et al., 2012; Li et al., 2020). Recent studies point to declines in ocean oxygen content, and these changes in circulation and ventilation might be in part responsible.

Measurements from repeat hydrographic transects provide a clear record of high-quality data from ocean surface to bottom and from coast-to-coast going back several decades. The co-​location of different types of measurements from these transects enables novel analyses of long-term changes in ocean ventilation and the oceanic uptake of excess heat and anthropogenic carbon (Feely et al., 2014; Talley et al., 2016). The Global Ocean Ship-based Hydrographic Investigations Program (GO-SHIP) was initiated in 2007 as an extension of past research programs. The World Ocean Circulation Experiment (WOCE) sought, among other goals, to obtain a quasi-​synoptic sampling of global ocean circulation and water properties from 1988 to 1998, in coordination with the Joint Global Ocean Flux Study (JGOFS). The Climate Variability (CLIVAR) program, launched in 1995, sought to study variability of changing ocean properties and circulation. GO-SHIP consists of repeat transects, mostly based on those followed by these earlier programs, that span the globe and are now sampled by US and international GO-SHIP cruises at a nominal cadence of once per decade (Figure 1).


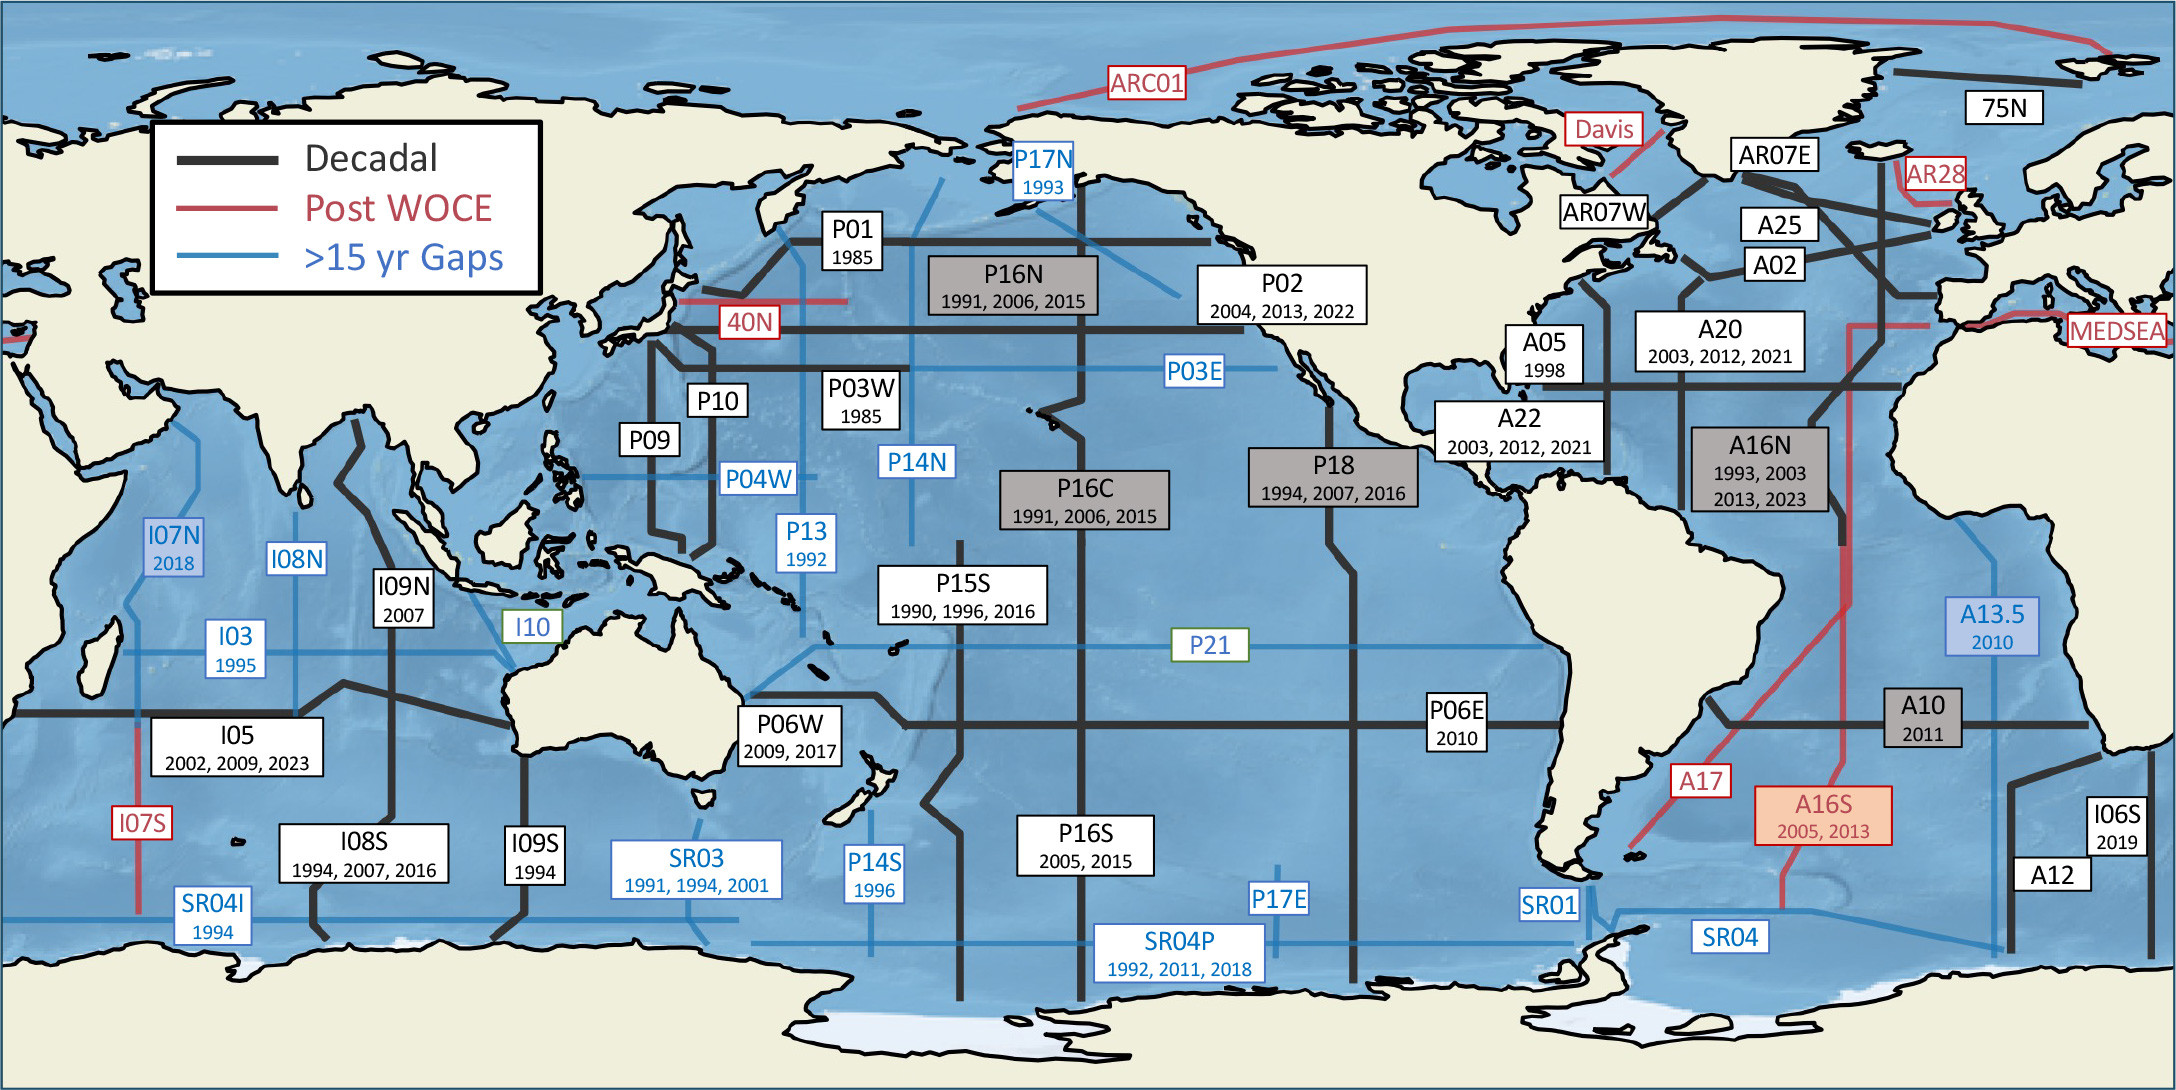
FIGURE 1. Global Ocean Ship-based Hydrographic Investigations Program (GO-SHIP) repeat transects colored by their temporal resolution. Years shown reflect cruises with NOAA Pacific Marine Environmental Laboratory (PMEL) participation, and the shaded boxes represent those transects for which NOAA is primarily responsible. Transects occupied at approximately decadal resolution since the World Ocean Circulation Experiment (WOCE) era (1990–1998) are in black, transects developed more recently than WOCE are in red, and transects extending back to the WOCE era but with gaps of 15 years or more between subsequent occupations are in blue. Transects and dates shown here reflect data submitted to the CLIVAR and Carbon Hydrographic Data Office (CCHDO). > High res figure


The Pacific Marine Environmental Laboratory (PMEL) and NOAA cooperative institute researchers have been key contributors to GO-SHIP, CLIVAR, and WOCE repeat hydrographic observations, participating in 58 cruises along GO-SHIP transect lines since 1985, and working closely with colleagues at NOAA’s Atlantic Oceanographic and Meteorological Laboratory (AOML) and US National Science Foundation (NSF)-funded partners in the United States, as well as coordinating with international partners. Dedicated instrument technicians form the core of these contributions and have for decades provided the professionalism and expertise that allow GO-SHIP cruises to provide the data quality and precision that are required to quantify and understand long-term changes in the ocean. In addition, PMEL scientists often take leadership roles on GO-SHIP cruises, including serving as chief or co-chief scientists for 21 cruises to date. PMEL leads the CTD and oxygen instrument calibration and processing on NOAA-led GO-SHIP cruises (Figure 1) and measures carbon system parameters on almost all US-led GO-SHIP cruises.

GO-SHIP cruises adhere to strict measurement quality and data access standards (Sloyan et al., 2019) that ensure the highest quality data with timely access for the broader research community and align with FAIR (findable, accessible, interoperable, and reusable) data principles (Wilkinson et al., 2016). Measurements include “core variables” (Level 1) that are included on every cruise, such as temperature, salinity, dissolved oxygen (DO), nutrients, velocity, carbonate chemistry (two of dissolved inorganic carbon, total alkalinity, and pH), and transient tracers such as chlorofluorocarbons (CFCs) and sulfur hexafluoride (SF6). Another set of measurements (Level 2) are recommended but not required, and include carbon isotopes, iron concentrations, nitrous oxide, and additional carbonate parameters. Finally, cruises may include other ancillary measurements (Level 3) that are specific to a given region or are more experimental in nature.

The focus on highly accurate and precise co-located measurements is vital to studying long-term changes in the ocean. For example, a major source of uncertainty in decadal changes in ocean carbon inventory is measurement uncertainty (Sabine et al., 2004; Bockmon and Dickson, 2015; Carter et al., 2019a,b). Ocean warming trends in the abyssal ocean estimated from repeat hydrographic section data are statistically significant but often only slightly above the noise threshold (Purkey and Johnson, 2010; Desbruyéres et al., 2016). When a small group of well-coordinated laboratories, such as NOAA’s PMEL and AOML, generates repeated measurements across a given transect over multiple decades, the stability provided by consistent methodology, instrumentation, and personnel improves our ability to distinguish small changes in the measured values. This consistency also allows for sustained evaluation and refinement of measurement techniques toward even greater accuracy and precision. The following sections describe how repeat hydrography from GO-SHIP has increased our understanding of changes in ocean ventilation and the uptake of heat and carbon over the past decades, with a focus on repeat transects along line P16 (Figure 1, 151°W) in the Pacific Ocean (Figure 2). We also highlight several areas in which analytical developments made at PMEL have significantly contributed to measurements made during GO-SHIP cruises.


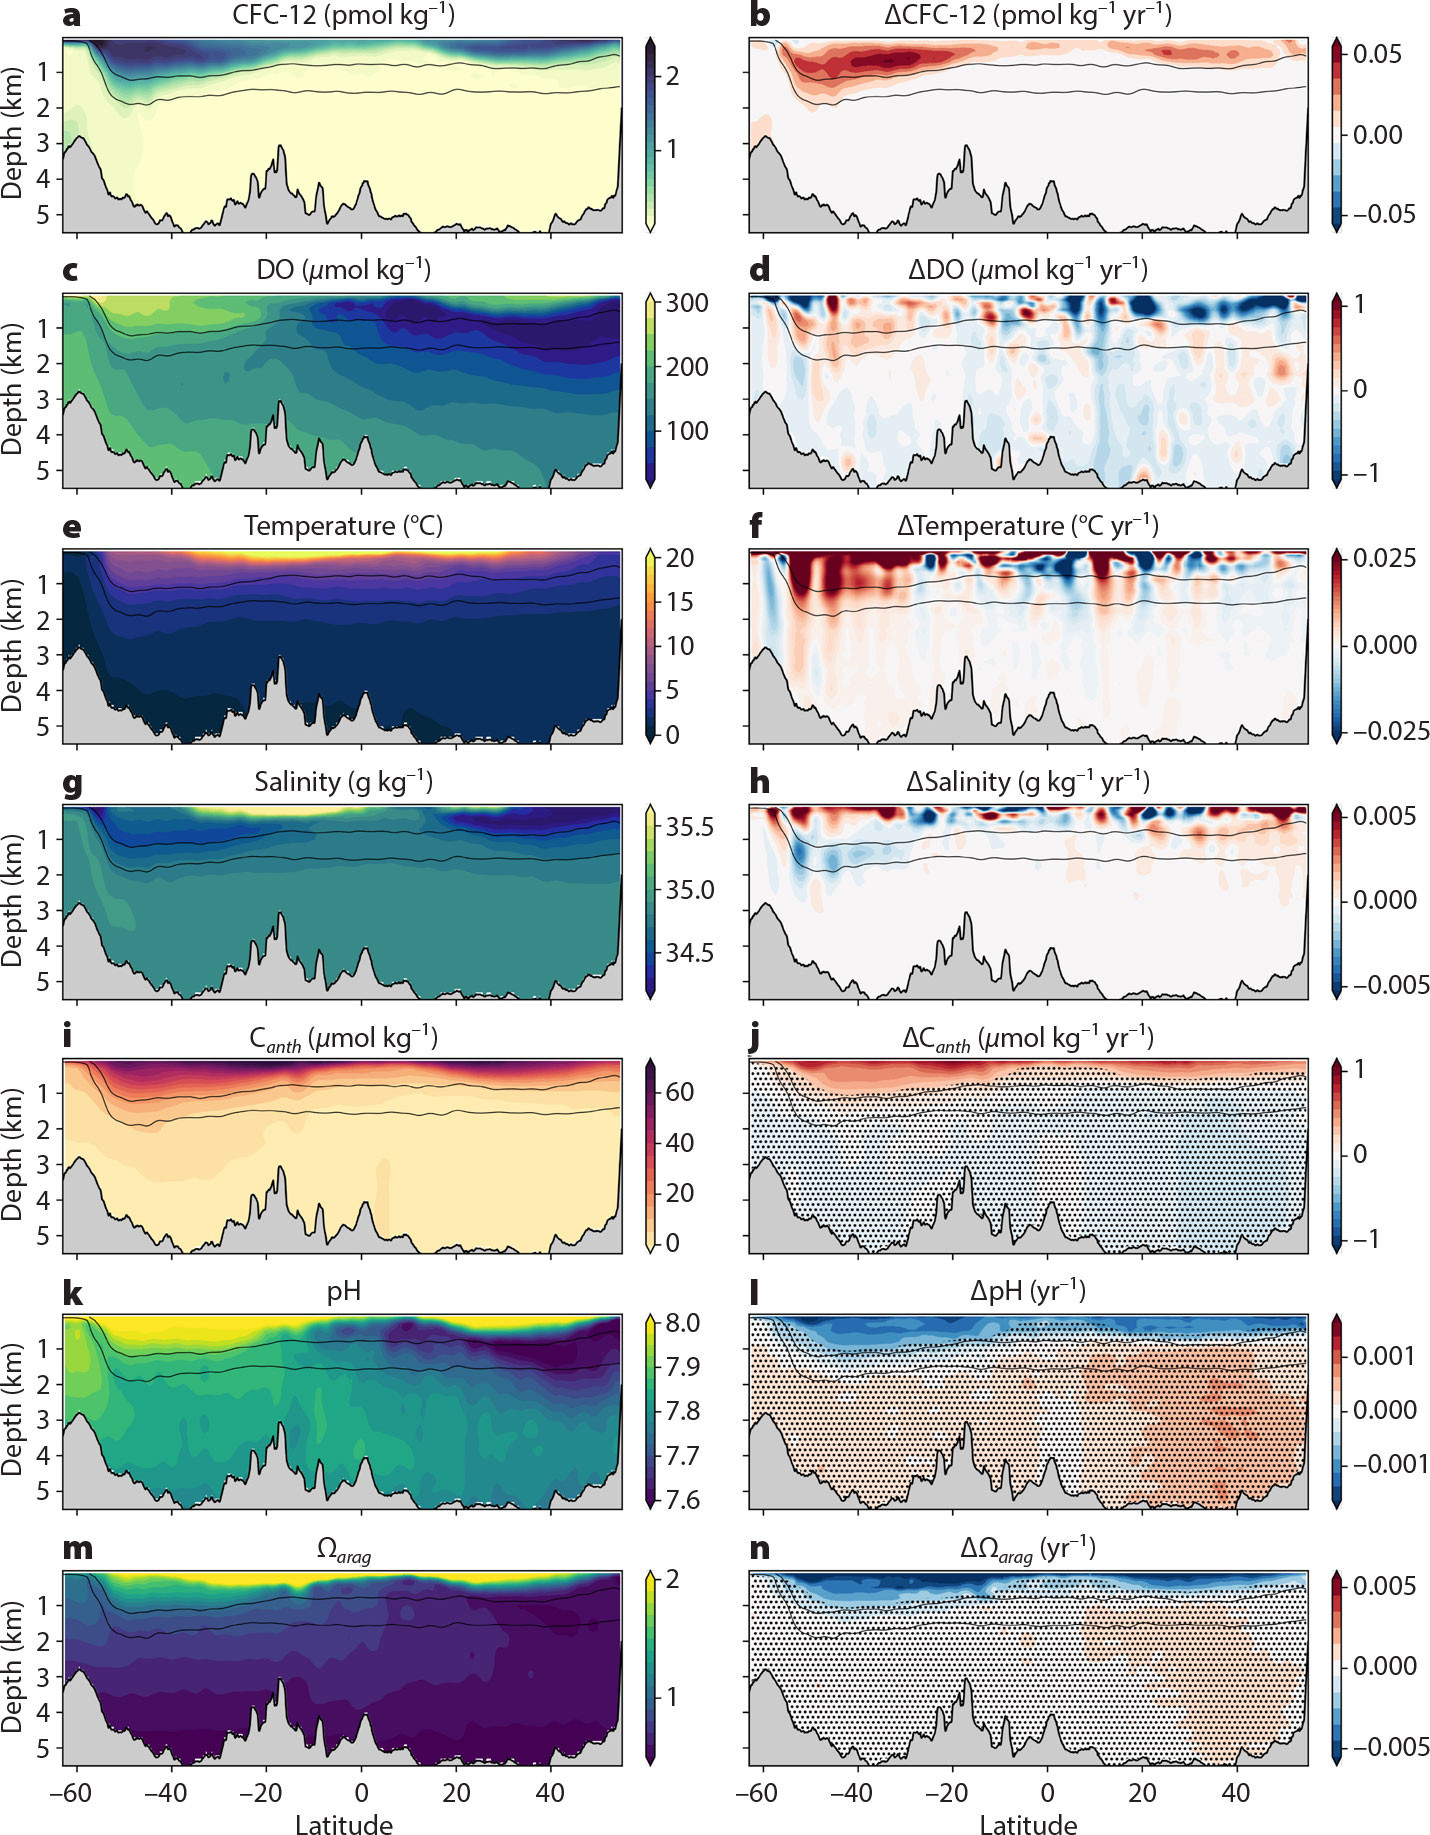
FIGURE 2. Data from the P16 cruises in 2014/2015 (left) and the rate of change between 2014/2015 and 1991/1992 cruises (right). Measurements were made every ½° of latitude except between 3°S and 3°N, where measurements are made every ⅓° of latitude. Data for each year are objectively mapped and then the difference is taken. Black lines show neutral density contours at 27.4 and 27.8 kg m–3. Temperature is conservative and salinity is absolute, following standard conventions. ∆pH (panel l) and ∆Ωarag (panel n) are calculated from the ∆Canth estimates (panel j), which are described in the text. Stippled areas in panels j, l, and n represent rates of change less than two times the uncertainty on the ∆Canth results. > High res figure


Changes in Ocean Ventilation Over Time

Many changes in the ocean are caused by the interaction of the ocean with the atmosphere. In order for physical and chemical signals to penetrate from the atmosphere into the ocean interior and especially the abyssal ocean, waters from the surface must be subducted into the ocean interior. This vertical transport of waters, or ventilation of interior waters, can be studied using measurements of compounds such as CFCs that only have an anthropogenic source.

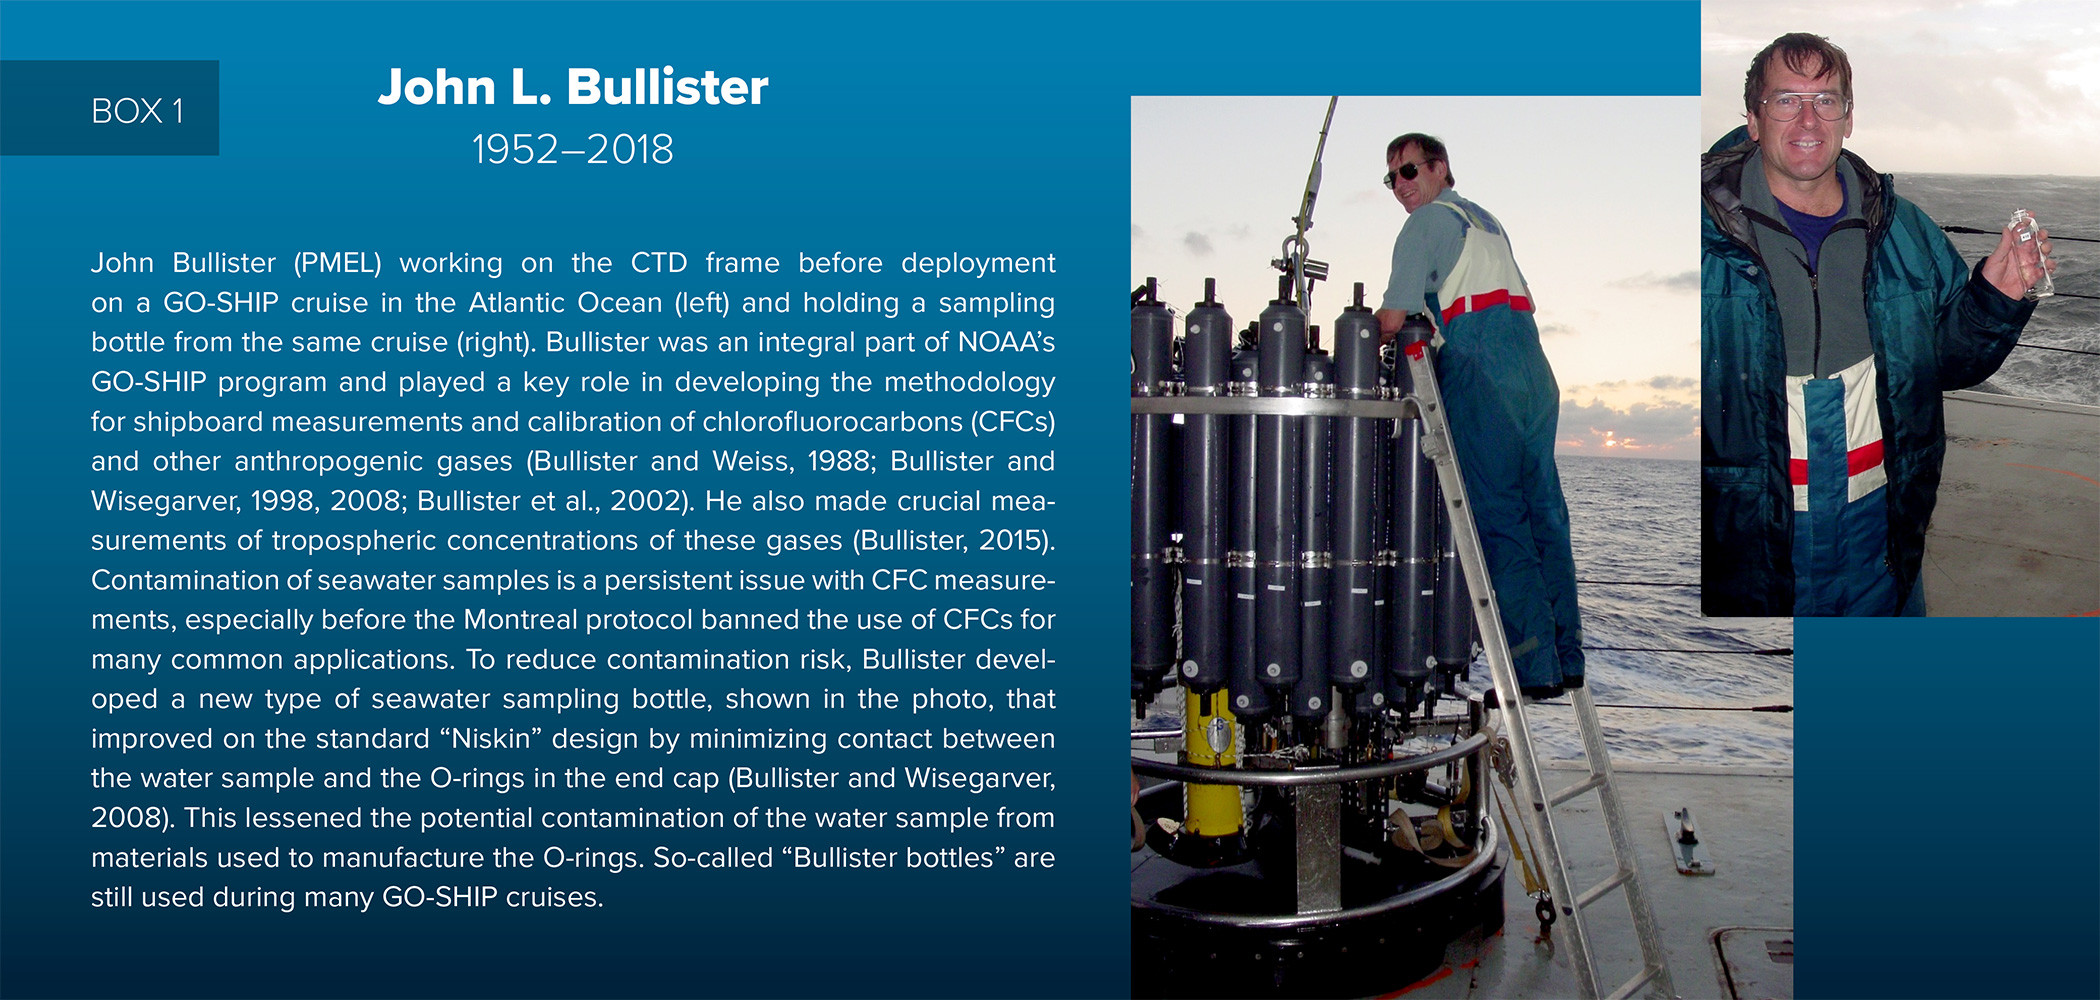
The story of CFC measurements in the ocean highlights the importance of sustained institutional effort in developing analytical measurement techniques. A pioneering study came from the Uni­versity of Washington and PMEL through Richard Gammon, Joel Cline, and David Wisegarver, who developed a sampling and analytical system that could measure CFCs in seawater without contamination from atmospheric CFCs (Gammon et al., 1982). Depth profiles of CFCs collected in the Northeast Pacific were used to estimate upwelling and vertical mixing rates, providing an independent estimate of the oceanic uptake of anthropogenic CO2. As improvement of CFC measurement techniques and additional tracers proceeded at PMEL (Wisegarver and Gammon, 1988), in parallel, two graduate students, John Bullister and Mark Warner, were developing analytical techniques, calibration standards, and solubility functions in the Ray Weiss laboratory at the Scripps Institution of Oceanography (Warner and Weiss, 1985; Bullister and Weiss, 1988). When Bullister was hired by PMEL in 1990, these approaches were adopted there and spread worldwide (see the tribute to Bullister in Box 1).


> High res box


As part of JGOFS, CFC measurements became a core component of WOCE expeditions of the 1990s. These early cruise sections were at the time used to quantify thermocline ventilation and turnover timescales and, exploiting the similar penetration patterns of DO and CFCs in the upper ocean, oxygen consumption rates in the thermocline (Doney and Bullister, 1992; Warner et al., 1996, Feely et al., 2004). Analyses of CFC concentrations and other section data have documented anthropogenic changes in nutrient cycling and CO2 uptake in the Pacific Ocean (Sonnerup et al., 1999a; Sabine et al., 2002; Kim et al. 2014) and elsewhere (Gruber et al., 1996; Sonnerup et al., 1999b; Key et al., 2004 Sabine et al., 2004). These measurements are now used extensively for ocean circulation model validation and assimilation (e.g., DeVries, 2022).

The decadal penetration of anthropogenic perturbations from the atmosphere through the bottom of the main thermocline can be visualized in the near-​decadal re-occupations of key WOCE lines during WOCE, CLIVAR, and GO-SHIP cruises. In P16 (Figure 1; 151°W), the invasion of surface properties into the interior is indicated by the large CFC-12 signal in the upper kilometer of the ocean, approximately bounded by neutral density 27.8 kg m–3 in the southern latitudes and 27.4 kg m–3 in the northern latitudes (Figure 2a). This anthropogenic signal penetrates deeper into the ocean interior in the Southern Ocean between 30°S and 55°S due to strong westerly winds in the Southern Ocean that create deep mixed layers and lead to the formation of intermediate and mode waters. CFCs can also be detected at the ocean bottom south of 60°S along P16 as well as other transects (e.g., Sonnerup et al., 2015), implying that at least a portion of the water found at these depths was ventilated since human CFC emissions began.

CFC-12 concentrations in the ocean respond to changes in CFC-12 concentrations in the atmosphere, which increased from the late 1930s until the early 2000s but have been decreasing since then following the adoption of the Montreal protocol in 1987. The subsequent decline in atmospheric and upper ocean CFC levels significantly complicated the application of CFCs as a way of dating ocean waters (Weiss et al., 1985; Doney and Bullister, 1992), and in shallow waters broke the natural link that existed between anthropogenic CO2 and CFCs (Matear et al., 2003). In P16, the largest change in CFCs is seen in the subsurface, at about 500 m depth, which represents the penetration of anthropogenic signals through the main thermocline (Figure 2b). Early efforts indicated that SF6, another anthropogenic gas whose atmospheric concentrations are still increasing, would be a powerful complement to CFC measurements (Waugh et al., 2002). PMEL led the effort to determine the solubility of SF6 in seawater (Bullister et al., 2002). Eventually, once measurement techniques for dissolved SF6 were finalized (Vollmer and Weiss, 2002; Tanhua et al., 2004; Bullister et al., 2006; Bullister and Wisegarver, 2008), it became a Level 1 measurement for GO-SHIP. Combining data from CFCs and SF6 has permitted analyses on decadal changes in ocean ventilation that would not be possible without both measurements (Sonnerup et al., 2008, 2015; Shao et al., 2016).

The minimal natural variability in CFC concentrations results in clear patterns in their concentration changes even in “snapshots” measured a decade apart in a highly variable ocean (Figure 2b). For most other GO-SHIP measurements, natural variability in water masses and biogeochemical processes is a barrier to direct examination of decadal changes, particularly in the upper ocean. Nevertheless, repeated measurements of DO and collocated measurements over time along multiple sections have revealed evidence of regional and global-​scale deoxygenation (Figure 2c,d). For example, deoxygenation of 0.5%–3.3% was found in the upper kilometer of the ocean from 1970 to 2010 (Helm et al., 2011; Schmidtko et al., 2017; Bindoff et al., 2019). Repeat sections in the North Pacific (Mecking et al., 2006, 2008; Sonnerup et al., 2007) and North Atlantic Oceans (Johnson and Gruber, 2007; Stendardo and Gruber, 2012; Tanhua et al., 2013) showed decreased DO associated with ventilation slowdown in intermediate water masses across the 1990s. Repeat sections in the subtropical Southern Hemisphere showed increased DO associated with younger intermediate waters in the 1990s (McDonagh et al., 2005), followed by decreased DO associated with older intermediate waters in the 2000s (Talley et al., 2016). Measurements of CFC and SF6 concentrations made in concert with DO have been critical for diagnosing the physical drivers of this upper ocean deoxygenation (Sonnerup et al., 2015). Transient tracer measurements have provided robust support for the conclusion that a global-scale reduction in upper ocean ventilation induced by ocean warming is the main cause of recent ocean deoxygenation, likely more important than decreased oxygen solubility and increased subsurface biological oxygen demand (Keeling et al., 2010; Buchanan and Tagliabue, 2021).


Ocean Heat Uptake and Salinity Changes

Warming of the ocean is inextricably linked to ocean ventilation, a major pathway through which the anthropogenic warming signal propagates into interior ocean waters. Deep and bottom waters, such as Antarctic Bottom Water (AABW), tend to be more uniform than upper ocean waters, meaning smaller changes in temperature can more easily be detected there. Significant warming in deep and bottom waters was observed in the Argentine and Brazil Basins using an early repeat of WOCE section A16S (Johnson and Doney, 2006), and subsequently a compilation of transects from circa 1980 to 2010 showed a pattern of warming over recent decades in AABW-derived bottom waters that intensified to the south, but was global in extent, reaching even into the North Pacific (Purkey and Johnson, 2010). In recent decades, warming of the ocean deeper than 2,000 m has been estimated from repeat hydrography to be ~10% of the total ocean warming (Johnson et al., 2016), which in turn accounts for ~90% of the heating of Earth’s climate system (von Schuckmann et al., 2020). Repeat hydrographic section data also showed that AABW in the Indian and Pacific sectors of the Southern Ocean had been freshening (Purkey and Johnson, 2013), with that water-mass signal spreading into the Southwest Pacific Basin (Purkey et al., 2019). The warming of AABW, with its downward and southward contraction of isotherms, implied a reduced northward flow of AABW at a rate of ~8 Sv (Purkey and Johnson, 2012). This reduced flow could also be seen when repeat hydrographic section data were assimilated into an ocean circulation model (Kouketsu et al., 2011).

The most recent P16 transect shows near-​​bottom conservative temperatures ranging from 0°–1.5°C and warming throughout the Southern and Pacific Oceans (Figure 2e). This warming is surface-​​​intensified but also present at depth, with a warming trend of 0.8 ± 0.6 m °C yr–1 below 4,000 db in the South Pacific (20°–58°S) and a somewhat smaller warming, of about 0.3 ± 0.3 m °C yr–1 north of 15°S (Figure 2f; see also Purkey and Johnson, 2010). Salinity transects (Figure 2g) along this line do not show a clear temporal trend at depth (Figure 2h). However, south of 30°S a dipole is apparent, with salinification in waters with a neutral density less than 27.4 kg m–3 and freshening below, for waters with neutral density between 27.4 kg m–3 and 27.8 kg m–3, consistent with an amplification of the global hydrological cycle and surface warming (Durack and Wijffels, 2010).

Warming rates of AABW over recent decades estimated from repeat hydrographic section data alone have uncertainties on the order of half of the signal size (e.g., Purkey and Johnson, 2010). Repeat hydrographic data combined with Deep Argo float data can decrease these uncertainties severalfold (e.g., Johnson, 2022; Johnson and Fassbender, 2023, in this issue). Syntheses of these data, like those combining repeat hydrographic and core Argo for upper ocean heat content and salinity change estimates (Rhein et al., 2013), promise to greatly increase our understanding of deep ocean variations and their roles in Earth’s climate system.


Invasion of Anthropogenic Carbon into the Ocean

Ocean CO2 uptake has reduced the accumulation of greenhouse gases in the atmosphere, slowed the rate of climate change (Sabine et al., 2004; Sabine and Feely, 2007; Feely et al., 2012; Gruber et al., 2019), and decreased pH of surface ocean waters by about 0.11 units (Feely et al., 2009, 2023, in this issue; Jiang et al. 2019). This acidification, along with the commensurate decrease in aragonite saturation state (Ωarag), can cause significant harm to marine ecosystems and the services they provide to human communities (Doney et al., 2020; Bednaršek et al., 2021). For these reasons, efforts to document the accumulation of anthropogenic carbon (Canth) in the ocean and its impacts on seawater chemistry are central to climate change research. Canth is computed based on the difference between the measurable dissolved inorganic carbon content of seawater and that which would be present in the absence of human CO2 emissions. There is no direct measure for this quantity; it must be estimated as the excess relative to inferred distributions of “natural” carbon that would be present in seawater in the absence of human activity. Numerical circulation models can be used to estimate Canth as the difference between a historical simulation and a control simulation without human emissions. However, these estimates are sensitive to the modeled circulation, which is typically validated against (e.g., Dunne et al., 2020) or adjusted to agree with (e.g., DeVries et al., 2019) transient tracer distributions measured on hydrographic surveys. Transient tracer measurements are also used to calibrate the transit time distribution and maximum entropy inversion methods for estimating Canth (e.g., Waugh et al., 2006; Khatiwala et al., 2009). Other methods take advantage of the many co-located measurements of physical properties, nutrients, and dissolved gases provided by GO-SHIP cruises and then use them alongside empirical physical and biogeochemical relationships to quantify the expected natural carbon distributions (Gruber et al., 1996, 2019; Sabine et al., 2004; Pardo et al., 2014).

The Canth accumulation signal (∆Canth) can be isolated from natural dissolved inorganic carbon changes along GO-SHIP reoccupations using the “Canth accumulation rates estimated from ensembles of regressions” (CAREER) approach, which utilizes temperature, salinity, nutrient, and oxygen observation changes (Carter et al., 2019a) to infer ∆Canth between sections. The contribution of Canth to the 2014/2015 P16 transect (Figure 2i) is surface intensified within the upper kilometer, with a deeper extension in the Southern Ocean. In general, the Canth accumulation rate is positive with statistical significance in waters lighter than the 27.4 neutral density surface (Figure 2j). Averaged over the upper kilometer, the Canth accumulation rate is 0.34 ± 0.25 µmol kg–1 yr–1. At the surface this rate is significantly higher, 0.75 ± 0.14 µmol kg–1 yr–1 (see also Woosley et al., 2016; Carter et al., 2019a).

A similar approach can be used to quantify changes in other carbonate chemistry parameters, such as pH and Ωarag. The ocean generally has lower pH in the interior due primarily to respiration processes (Lauvset et al., 2020), and the lowest pH values generally occur at depths between 1 km and 3 km, or at neutral density surfaces between about 27.4 kg m–3 and 27.8 kg m–3 in the North Pacific where the water masses are oldest (Figure 2k). Between transects in 1991/1992 and 2014/2015, surface pH dropped by about 0.0014 ± 0.0002 units yr–1 (Figure 2l), consistent with global trends (Takahashi et al., 2014; Jiang et al., 2019; Feely et al., 2023, in this issue). Observations indicate an undersaturation in aragonite (Ωarag <1) throughout much of the water column, and particularly in the high latitudes and upwelling areas (Figure 2m). Aragonite undersaturation leads to reduced biomineralization, shell dissolution, and increases the stress organisms face from ocean acidification (Bednaršek et al., 2019, 2021, 2023, in this issue), making it important to document temporal and spatial shifts in these parameters. Repeat hydrography shows a decrease in Ωarag over time near the surface where waters are currently oversaturated (Figure 2n), and thereby a shoaling of the equilibrium aragonite saturation state (Ωarag = 1), a commonly used threshold for indicating stress in marine calcifiers (e.g., Feely et al., 2004; Orr et al., 2005; Bednaršek et al., 2014). However, the rate of change in carbonate chemistry parameters is comparable to the uncertainty in the techniques for quantifying this variability in all but the most recently ventilated water masses in the upper water column (see stippling in Figure 2j,l,n), and the dominant contribution to the Canth estimate uncertainty comes from small cruise-wide biases in dissolved inorganic carbon measurements between decades (Carter et al., 2019a,b). The focus on measurement quality on GO-SHIP cruises and during post-cruise processing is essential in order to produce internally consistent data products (Olsen et al., 2016).


“GO-SHIP provides global, full-depth, gold-standard data for model validation and calibration of autonomous sensors, including Argo floats. [NOAA PMEL] has developed methods to measure several of the variables routinely sampled through GO-SHIP and is a core contributor to these repeat hydrographic cruises.”


Future Outlook for Repeat Hydrography at PMEL

Long-term repeat hydrography provides crucial, widely used, and irreplaceable data for analyzing decadal trends in the ocean on regional and global scales. These data are also vital for their contributions to other major data compilations such as the Global Data Analysis Project (GLODAP; Key et al., 2004; Olsen et al., 2016) and the World Ocean Atlas (Boyer et al., 2018). The GO-SHIP program closely interfaces with the Argo Program (see Johnson and Fassbender, 2023, in this issue), providing platforms from which to deploy Argo floats and for collecting highly accurate and precise shipboard data for calibration and validation of Argo measurements (e.g., Wong et al., 2020). Employing localized regressions, GO-SHIP data are also used to estimate other key ocean biogeochemical variables that can’t be measured by autonomous platforms (Carter et al., 2021). Measurements made during GO-SHIP cruises are continuously evolving to ensure that the highest-quality measurements are available. Much of this work, undertaken by dedicated scientific staff at PMEL and AOML, along with their academic colleagues, is only possible because of long-term investment in personnel and ship support. A new initiative is the Bio-GO-SHIP program, which measures biologically relevant parameters such as optical properties, eDNA, and microbial taxonomy on GO-SHIP cruises (Clayton et al., 2022). These data will be important for mapping the geographic distributions of key biological variables and understanding how they vary over time (e.g., Larkin et al., 2021).

NOAA’s contribution to GO-SHIP relies on extensive collaborations among NOAA labs (PMEL and AOML), NOAA cooperative institutes, US agencies (NOAA and NSF), and US and international partners involving expertise, equipment, and development of ideas. In particular, PMEL, AOML, and NOAA cooperative institute researchers have contributed significantly to the quantity of high-quality repeat hydrography measurements; for example, together they have contributed more than one-​quarter of all the fully quality controlled dissolved inorganic carbon measurements in the GLODAPv2.2022 data product (Lauvset et al., 2022). Using high-quality measurements made possible by these partnerships, PMEL has also played an integral role in synthesis studies that have quantified the natural and anthropogenic ocean carbon sink (Sabine et al., 2002, 2004; Feely et al., 2004, 2012; Sabine and Tanhua 2010; Gruber et al., 2019) and its variability (Carter et al., 2017, 2019a), and quantified deep ocean warming (e.g., Purkey and Johnson, 2010). GO-SHIP measurements regularly contribute to annual updates to global carbon budgets (Le Quéré et al., 2018; Friedlingstein et al., 2022), the global climate change assessment of the Intergovernmental Panel on Climate Change (IPCC, 2021), and the State of the Climate assessments (Feely et al., 2019; Johnson et al., 2022). Measurements from autonomous platforms and satellites are increasingly useful in studying the ocean; however, autonomous platforms are limited in the quality and quantity of variables they can observe, and satellite data are limited to providing only surface information. The gold-standard quality, targeted ship-based, varied and collocated, full water column, and long time series measurements available from GO-SHIP remain vital for observational oceanography and model validation.


Acknowledgments

The success of the GO-SHIP program at PMEL is the result of sustained efforts by many at PMEL, at other NOAA institutions, throughout the US, and around the world. Several dedicated technical staff at PMEL and NOAA cooperative institutes have contributed immensely to the program, including Chris Sabine (now at University of Hawai‘i), Dave Wisegarver, Kristene McTaggart, Dana Greeley, Julian Herndon, Andrew Collins, Bonnie Chang, and Eric Wisegarver. PMEL works closely with AOML colleagues on these sections, and we gratefully acknowledge long-standing collaborations with, among others, Rik Wanninkhof, Molly Baringer, and Leticia Barbero. We also thank Kathy Tedesco at NOAA’s Global Ocean Monitoring and Observing program for her steadfast support of this program. For BRC’s contributions to this paper, support came through the Carbon Data Management and Synthesis Project (fund ref no. 100007298). This is PMEL and CICOES Contribution Numbers 5452 and 2023-1285, respectively.
Citation

Erickson, Z.K., B.R. Carter, R.A. Feely, G.C. Johnson, J.D. Sharp, and R.E. Sonnerup. 2023. PMEL’s contribution to observing and analyzing decadal global ocean changes through sustained repeat hydrography. Oceanography 36(2–3):60–69, https://doi.org/10.5670/oceanog.2023.204.

References

Bednaršek, N., R.A. Feely, J.C.P. Reum, W. Peterson, J. Menkel, S.R. Alin, and B. Hales. 2014. Limacina helicina shell dissolution as an indicator of declining habitat suitability due to ocean acidification in the California Current Ecosystem. Proceedings of the Royal Society B 281:20140123, https://doi.org/​10.1098/rspb.2014.0123.

Bednaršek, N., R.A. Feely, E.L. Howes, B.P. Hunt, F. Kessouri, P. León, S. Lischka, A.E. Maas, K. McLaughlin, N.P. Nezlin, and M. Sutula. 2019. Systematic review and meta-analysis toward synthesis of thresholds of ocean acidification impacts on calcifying pteropods and interactions with warming. Frontiers in Marine Science 6:227, https://doi.org/​10.3389/fmars.2019.00227.

Bednaršek, N., K.A. Naish, R.A. Feely, C. Hauri, K. Kimoto, A.J. Hermann, C. Michel, A. Niemi, and D. Pilcher. 2021. Integrated assessment of ocean acidification risks to pteropods in the northern high latitudes: Regional comparison of exposure, sensitivity and adaptive capacity. Frontiers in Marine Science 8:671497, https://doi.org/10.3389/fmars.2021.671497.

Bednaršek, N., R.A. Feely, G. Pelletier, and F. Desmet. 2023. Global synthesis of the status and trends of ocean acidification impacts on shelled pteropods. Oceanography 36(2–3):130–137, https://doi.org/​10.5670/oceanog.2023.210.

Bindoff, N.L., W.W.L. Cheung, J.G. Kairo, J. Aristegui, V.A. Guinder, N. Hilmi, N. Jiao, M.S. Karim, L. Levin, S. O’Donoghue, and others. 2019. Changing ocean, marine ecosystems, and dependent communities. Pp. 447–587 in IPCC Special Report on the Ocean and Cryosphere in a Changing Climate. H.-O. Pörtner, D.C. Roberts, V. Masson-Delmotte, P. Zhai, M. Tignor, E. Poloczanska, K. Mintenbeck, A. Alegría, M. Nicolai, A. Okem, J. Petzold, B. Rama, and N.M. Weyer, eds, Cambridge University Press, Cambridge, UK, and New York, NY, USA.

Bockmon, E.E., and A.G. Dickson. 2015. An inter-​laboratory comparison assessing the quality of seawater carbon dioxide measurements. Marine Chemistry 171:36–43, https://doi.org/10.1016/​j.marchem.2015.02.002.

Boyer, T.P., H.E. Garcia, R.A. Locarnini, M.M. Zweng, A.V. Mishonov, J.R. Reagan, K.A. Weathers, O.K. Baranova, D. Seidov, and I.V. Smolyar. 2018. World Ocean Atlas 2018. Dataset, NOAA National Centers for Environmental Information, https://www.ncei.noaa.gov/archive/accession/NCEI-WOA18.

Buchanan, P.J., and A. Tagliabue. 2021. The regional importance of oxygen demand and supply for historical ocean oxygen trends. Geophysical Research Letters 48:e2021GL094797, https://doi.org/​10.1029/​2021GL094797.

Bullister, J.L., and R.F. Weiss. 1988. Determination of CCl3F and CCl2F2 in seawater and air. Deep Sea Research Part A 35(5):839­–853, https://doi.org/​10.1016/0198-0149(88)90033-7.

Bullister, J.L., and D.P. Wisegarver. 1998. The solubility of carbon tetrachloride in water and seawater. Deep Sea Research Part I 45(8):1,285–1,302, https://doi.org/10.1016/S0967-0637(98)00017-X.

Bullister, J.L., D.P. Wisegarver, and F.A. Menzia. 2002. The solubility of sulfur hexafluoride in water and seawater. Deep Sea Research Part I 49:175–187, https://doi.org/10.1016/S0967-0637(01)00051-6.

Bullister, J.L., D.P. Wisegarver, and R.E. Sonnerup. 2006. Sulfur hexafluoride as a transient tracer in the North Pacific Ocean. Geophysical Research Letters 33(18), https://doi.org/​10.1029/​2006GL026514.

Bullister, J.L., and D.P. Wisegarver. 2008. The shipboard analysis of trace levels of sulfur hexafluoride, chlorofluorocarbon-11, and chlorofluorocarbon-12 in seawater. Deep Sea Research Part I 55:1,063–1,074, https://doi.org/10.1016/​j.dsr.​2008.03.014.

Bullister, J.L. 2015. Atmospheric histories (1765–2015) for CFC-11, CFC-12, CFC-113, CCl4, SF6 and N2O. ORNL/CDIAC-161, NDP-095, Carbon Dioxide Information Analysis Center, Oak Ridge National Laboratory, US Department of Energy, Oak Ridge, Tennessee.

Capotondi, A., M.A. Alexander, N.A. Bond, E.N. Curchitser, and J.D. Scott. 2012. Enhanced upper ocean stratification with climate change in the CMIP3 models. Journal of Geophysical Research: Oceans 117(C4), https://doi.org/​10.1029/2011JC007409.

Carter, B.R., R.A. Feely, S. Mecking, J.N. Cross, A.M. Macdonald, S.A. Siedlecki, L.D. Talley, C.L. Sabine, F.J. Millero, J.H. Swift, and others. 2017. Two decades of Pacific anthropogenic carbon storage and ocean acidification along Global Ocean Ship-based Hydrographic Investigations Program sections P16 and P02. Global Biogeochemical Cycles 31:306–327, https://doi.org/​10.1002/​2016GB005485.

Carter, B.R., R.A. Feely, R. Wanninkhof, S. Kouketsu, R.E. Sonnerup, P.C. Pardo, C.L. Sabine, G.C. Johnson, B.M. Sloyan, A. Murata, and others. 2019a. Pacific anthropogenic carbon between 1991 and 2017. Global Biogeochemical Cycles 33(5):597–617, https://doi.org/​10.1029/​2018GB006154.

Carter, B.R., N.L. Williams, W. Evans, A.J. Fassbender, L. Barbero, C. Hauri, R.A. Feely, and A.J. Sutton. 2019b. Time of detection as a metric for prioritizing between climate observation quality, frequency, and duration. Geophysical Research Letters 46:3,853–3,861, https://doi.org/​10.1029/​2018GL080773.

Carter, B.R., H.C. Bittig, A.J. Fassbender, J.D. Sharp, Y. Takeshita, Y. Xu, M. Alvarez, R. Wanninkhof, R.A. Feely, and L. Barbero. 2021. New and updated global empirical seawater property estimation routines. Limnology and Oceanography: Methods 19(12):785–809, https://doi.org/10.1002/lom3.10461.

Cazenave, A., B. Meyssignac, M. Albain, M. Balmaseda, J. Bamber, V. Barletta, B. Beckley, J. Benveniste, E. Berthier, A. Blazquez, and others. 2018. Global sea-level budget 1993–present. Earth System Science Data 10:1,551–1,590, https://doi.org/​10.5194/​essd-10-1551-2018.

Clayton, S., H. Alexander, J.R. Graff, N.J. Poulton, L.R. Thompson, H. Benway, E. Boss, and A. Martiny. 2022. Bio-GO-SHIP: The time is right to establish global repeat sections of ocean biology. Frontiers in Marine Science 8: 767443, https://doi.org/​10.3389/fmars.2021.767443.

Desbruyères, D.G., S.G. Purkey, E.L. McDonagh, G.C. Johnson, and B.A. King. 2016. Deep and abyssal ocean warming from 35 years of repeat hydrography. Geophysical Research Letters 43(19):10,356–10,365, https://doi.org/​10.1002/​2016gl070413.

Desbruyères, D., L. Chafik, and G. Maze. 2021. A shift in the ocean circulation has warmed the subpolar North Atlantic Ocean since 2016. Communications Earth & Environment 2:48, https://doi.org/10.1038/s43247-021-00120-y.

DeVries, T., C. le Quere, O. Andrews, S. Berthet, J. Hauck, T. Ilyina, P. Landschützer, A. Lenton, I.D. Lima, M. Nowicki, and others. 2019. Decadal trends in the ocean carbon sink. Proceedings of the National Academy of Sciences of the United States of America 116(24):11,646–11,651, https://doi.org/​10.1073/​pnas.1900371116.

DeVries, T. 2022. Atmospheric CO2 and sea surface temperature variability cannot explain recent decadal variability of the ocean CO2 sink. Geophysical Research Letters 49(7):e2021GL096018, https://doi.org/​10.1029/2021GL096018.

Doney, S.C., and J.L. Bullister. 1992. A chlorofluorocarbon section in the eastern North Atlantic. Deep Sea Research Part A 39(11/12):1,857–1,883, https://doi.org/10.1016/0198-0149(92)90003-C.

Doney, S.C., D.S. Busch, S.R. Cooley, and K.J. Kroeker. 2020. The impacts of ocean acidification on marine ecosystems and reliant human communities. Annual Review of Environment and Resources 45:83–112, https://doi.org/10.1146/annurev-environ-012320-083019.

Dunne, J.P., L.W. Horowitz, A.J. Adcroft, P. Ginoux, I.M. Held, J.G. John, J.P. Krasting, S. Malyshev, V. Naik, F. Paulot, and others. 2020. The GFDL Earth System Model Version 4.1 (GFDL-ESM 4.1): Overall coupled model description and simulation characteristics. Journal of Advances in Modeling Earth Systems 12(11):e2019MS002015, https://doi.org/​​10.1029/​2019MS002015.

Durack, P.J., and S.E. Wijffels. 2010. Fifty-year trends in global ocean salinities and their relationship to broad-scale warming. Journal of Climate 23(16):4,342–4,362, https://doi.org/​10.1175/​2010JCLI3377.1.

Feely, R.A., C.L. Sabine, R. Schlitzer, J.L. Bullister, S. Mecking, and D. Greeley. 2004. Oxygen utilization and organic carbon remineralization in the upper water column of the Pacific Ocean. Journal of Oceanography 60:45–52, https://doi.org/​10.1023/B:JOCE.0000038317.01279.aa.

Feely, R.A., S. Doney, and S. Cooley. 2009. Ocean acidification: Present conditions and future changes in a high-CO2 world. Oceanography 22(4):36–47, https://doi.org/​10.5670/​oceanog.2009.95.

Feely, R.A., C.L. Sabine, R.H. Byrne, F.J. Millero, A.G. Dickson, R. Wanninkhof, A. Murata, L.A. Miller, and D. Greeley. 2012. Decadal changes in the aragonite and calcite saturation state of the Pacific Ocean. Global Biogeochemical Cycles 26(3), https://doi.org/10.1029/2011GB004157.

Feely, R.A., L.D. Talley, J.L. Bullister, C.A. Carlson, S.C. Doney, R.A. Fine, E. Firing, N. Gruber, D.A. Hansell, G.C. Johnson, and others. 2014. The US Repeat Hydrography CO2/Tracer Program (GO-SHIP): Accomplishments from the First Decadal Survey. A US CLIVAR and OCB Report, 2014-5, US CLIVAR Project Office, Washington, DC.

Feely, R.A., R. Wanninkhof, B.R. Carter, P. Landschützer, A.J. Sutton, C. Cosca, and J.A. Triñanes. 2019. Global ocean carbon cycle [in State of the Climate in 2018]. Bulletin of the American Meteorological Society 100(9):S94–S98, https://doi.org/​10.1175/​2019BAMSStateoftheClimate.1.

Feely, R.A., L.-Q. Jiang, R. Wanninkhof, B.R. Carter, S.R. Alin, N. Bednaršek, and C.E. Cosca. 2023. Acidification of the global surface ocean: What we have learned from observations. Oceanography 36(2–3):120–129, https://doi.org/​10.5670/oceanog.2023.222.

Friedlingstein, P., M. O’Sullivan, M.W. Jones, R.M. Andrew, L. Gregor, J. Hauck, C. le Quere, I.T. Luijkx, A. Olsen, G.P. Peters, and others. 2022. Global carbon budget 2022. Earth System Science Data 14(11):4,811–4,900, https://doi.org/10.5194/essd-14-4811-2022.

Gammon, R.H., J. Cline, and D. Wisegarver. 1982. Chlorofluoromethanes in the Northeast Pacific Ocean: Measured vertical distributions and application as transient tracers of upper ocean mixing. Journal of Geophysical Research 87(C12):9,441–9,454, https://doi.org/​10.1029/JC087iC12p09441.

Gruber, N., J.L. Sarmiento, and T.F. Stocker. 1996. An improved method for detecting anthropogenic CO2 in the oceans. Global Biogeochemical Cycles 10:809–837, https://doi.org/​10.1029/​96GB01608.

Gruber, N., D. Clement, B.R. Carter, R.A. Feely, S. van Heuven, M. Hoppema, M. Ishii, R.M. Key, A. Kozyr, S.K. Lauvset, and others. 2019. The oceanic sink for anthropogenic CO2 from 1994 to 2007. Science 363(6432):1,193–1,199, https://doi.org/​10.1126/science.aau5153.

Helm, K.P., N.L. Bindoff, and J.A. Church. 2011. Observed decreases in oxygen content of the global ocean. Geophysical Research Letters 38(23), https://doi.org/10.1029/2011GL049513.

IPCC. 2021. Climate Change 2021: The Physical Science Basis. Contribution of Working Group I to the Sixth Assessment Report of the Intergovernmental Panel on Climate Change. 2021. V. Masson-Delmotte, P. Zhai, A. Pirani, S.L. Connors, C. Péan, S. Berger, N. Caud, Y. Chen, L. Goldfarb, M.I. Gomis, M. Huang, K. Leitzell, E. Lonnoy, J.B.R. Matthews, T.K. Maycock, T. Waterfield, O. Yelekçi, R. Yu, and B. Zhou, eds, Cambridge University Press, Cambridge, United Kingdom and New York, NY, USA.

Jiang, L.Q., B.R. Carter, R.A. Feely, S.K. Lauvset, and A. Olsen. 2019. Surface ocean pH and buffer capacity: Past, present and future. Scientific Reports 9(1):18624, https://doi.org/10.1038/s41598-019-55039-4.

Johnson, G.C., and S.C. Doney. 2006. Recent western South Atlantic bottom water warming. Geophysical Research Letters 33(14), https://doi.org/​10.1029/​2006gl026769.

Johnson, G.C., and N. Gruber. 2007. Decadal water mass variations along 20°W in the northeastern Atlantic Ocean. Progress in Oceanography 73:277–295, https://doi.org/​10.1016/j.pocean.2006.03.022.

Johnson, G.C., J.M. Lyman, and N.G. Loeb. 2016. Improving estimates of Earth’s energy imbalance. Nature Climate Change 6(7):639–640, https://doi.org/​10.1038/​nclimate3043.

Johnson, G.C., R. Lumpkin, T. Boyer, F. Bringas, I. Cetinic, D.P. Chambers, L. Cheng, S. Dong, R.A. Feely, B. Fox-Kemper, and others. 2022. Global Oceans. Chapter 3 in State of the Climate in 2021, Bulletin of the American Meteorological Society 103(8):S143–S192.

Johnson, G.C. 2022. Antarctic bottom water warming and circulation slowdown in the Argentine Basin from analyses of deep Argo and historical shipboard temperature data. Geophysical Research Letters 49(18), https://doi.org/​10.1029/​2022gl100526.

Johnson, G.C., and A.J. Fassbender. 2023. After two decades, Argo at PMEL, looks to the future. Oceanography 36(2–3):54–59, https://doi.org/​10.5670/oceanog.2023.223.

Keeling, R.F., K. Arne, and N. Gruber. 2010. Ocean deoxygenation in a warming world. Annual Reviews in Marine Science 2:199–229, https://doi.org/​10.1146/​annurev.marine.010908.163855.

Key, R.M., A. Kozyr, C.L. Sabine, K. Lee, R. Wanninkhof, J.L. Bullister, R.A. Feely, F.J. Millero, C. Mordy, and T.-H. Peng. 2004. A global ocean carbon climatology: Results from Global Data Analysis Project (GLODAP). Global Biogeochemical Cycles 18(4), https://doi.org/10.1029/2004GB002247.

Khatiwala, S., F. Primeau, and T. Hall. 2009. Reconstruction of the history of anthropogenic CO2 concentrations in the ocean. Nature 462:346–349, https://doi.org/10.1038/nature08526.

Kim, I.-L., K. Lee, N. Gruber, D.M. Karl, J.L. Bullister, S. Yang, and T.-W. Kim. 2014. Increasing anthropogenic nitrogen in the North Pacific Ocean. Science 346(6213):1,102–1,106, https://doi.org/​10.1126/​science.1258396.

Kouketsu, S., T. Doi, T. Kawano, S. Masuda, N. Sugiura, Y. Sasaki, T. Toyoda, H. Igarashi, Y. Kawai, K. Katsumata, and others. 2011. Deep ocean heat content changes estimated from observation and reanalysis product and their influence on sea level change. Journal of Geophysical Research: Oceans 116(C3), https://doi.org/​10.1029/​2010jc006464.

Larkin, A.A., C.A. Garcia, N. Garcia, M.L. Brock, J.A. Lee, L.J. Ustick, L. Barbero, B.R. Carter, R.E. Sonnerup, L.D. Talley, and others. 2021. High spatial resolution global ocean metagenomes from Bio-GO-SHIP repeat hydrography transects. Scientific Data 8:107, https://doi.org/10.1038/s41597-021-00889-9.

Lauvset, S.K., B.R. Carter, F.F. Pérez, L.Q. Jiang, R.A. Feely, A. Velo, and A. Olsen. 2020. Processes driving global interior ocean pH distribution. Global Biogeochemical Cycles 34(1):e2019GB006229, https://doi.org/10.1029/2019GB006229.

Lauvset, S.K., N. Lange, T. Tanhua, H.C. Bittig, A. Olsen, A. Kozyr, S. Alin, M. Alvarez, K. Azetsu-Scott, L. Barbero, and others. 2022. GLODAPv2.2022: The latest version of the global interior ocean biogeochemical data product. Earth System Science Data 14:5,543–5,572, https://doi.org/​10.5194/ESSD-14-5543-2022.

Le Quéré, C., R.M. Andrew, P. Friedlingstein, S. Sitch, J. Hauck, J. Pongratz, P.A. Pickers, J.I. Korsbakken, G.P. Peters, J.G. Canadell, and others. 2018. Global carbon budget 2018. Earth System Science Data 10(4):2,141–2,194, https://doi.org/10.5194/essd-10-2141-2018.

Li, G., L. Cheng, J. Zhu, K.E. Trenberth, M.E. Mann, and J.P. Abraham. 2020. Increasing ocean stratification over the past half-century. Nature Climate Change 10(12):1,116–1,123, https://doi.org/10.1038/s41558-020-00918-2.

Matear, R.J., C.S. Wong, and L. Xie. 2003. Can CFCs be used to determine anthropogenic CO2? Global Biogeochemical Cycles 17(1), https://doi.org/​10.1029/​2001GB001415.

McDonagh, E.L., H.L. Bryden, B.A. King, R.J. Sanders, S.A. Cunningham, and R. Marsh. 2005. Decadal changes in the South Indian Ocean thermocline. Journal of Climate 18:1,575–1,590, https://doi.org/​10.1175/​JCLI3350.1.

Mecking, S., M.J. Warner, and J.L. Bullister. 2006. Temporal changes in pCFC-12 ages and AOU along two hydrographic sections in the eastern subtropical North Pacific. Deep Sea Research Part I 53:169–187, https://doi.org/10.1016/​j.dsr.​2005.06.018.

Mecking, S., C. Langdon, R.A. Feely, C.L. Sabine, C.A. Deutsch, and D.H. Min. 2008. Climate variability in the North Pacific thermocline diagnosed from oxygen measurements: An update based on the US CLIVAR/CO2 Repeat Hydrography cruises. Global Biogeochemical Cycles 22(3), https://doi.org/​10.1029/​2007GB003101.

Olsen, A., R.M. Key, S. van Heuven, S.K. Lauvset, A. Velo, X. Lin, C. Schirnick, A. Kozyr, T. Tanhua, M. Hoppema, and others. 2016. The Global Ocean Data Analysis Project version 2 (GLODAPv2) – An internally consistent data product for the world ocean. Earth System Science Data 8:297–323, https://doi.org/10.5194/essd-8-297-2016.

Orr, J.C., V.J. Fabry, O. Aumont, L. Bopp, S.C. Doney, R.A. Feely, A. Gnanadesikan, N. Gruber, A. Ishida, F. Joos, and R.M. Key. 2005. Anthropogenic ocean acidification over the twenty-first century and its impact on calcifying organisms. Nature 437(7059):681–686, https://doi.org/10.1038/nature04095.

Pardo, P.C., F.F. Pérez, S. Khatiwala, and A.F. Ríos. 2014. Anthropogenic CO2 estimates in the Southern Ocean: Storage partitioning in the different water masses. Progress in Oceanography 120:230–242, https://doi.org/​10.1016/​J.POCEAN.2013.09.005.

Purkey, S.G., and G.C. Johnson. 2010. Warming of global abyssal and deep Southern Ocean waters between the 1990s and 2000s: Contributions to global heat and sea level rise budgets. Journal of Climate 23(23):6,336–6,351, https://doi.org/​10.1175/​2010jcli3682.1.

Purkey, S.G., and G.C. Johnson. 2012. Global contraction of Antarctic Bottom Water between the 1980s and 2000s. Journal of Climate 25(17):5,830–5,844, https://doi.org/10.1175/jcli-d-11-00612.1.

Purkey, S.G., and G.C. Johnson. 2013. Antarctic Bottom Water warming and freshening: Contributions to sea level rise, ocean freshwater budgets, and global heat gain. Journal of Climate 26(16):6,105–6,122, https://doi.org/10.1175/jcli-d-12-00834.1.

Purkey, S.G., G.C. Johnson, L.D. Talley, B.M. Sloyan, S.E. Wijffels, W. Smethie, S. Mecking, and K. Katsumata. 2019. Unabated bottom water warming and freshening in the South Pacific Ocean. Journal of Geophysical Research: Oceans 124(3):1,778–1,794, https://doi.org/​10.1029/​2018jc014775.

Rhein, M., S.R. Rintoul, S. Aoki, E. Campos, D. Chambers, R.A. Feely, S. Gulev, G.C. Johnson, S.A. Josey, A. Kostainoy, and others. 2013. Observations: Ocean. Pp. 255–315 in Climate Change 2013: The Physical Science Basis. Contribution of Working Group I to the Fifth Assessment Report of the Intergovernmental Panel on Climate Change. T.F. Stocker, D. Qin, G.-K. Plattner, M. Tignor, S. K. Allen, J. Boschung, A. Nauels, Y Xia, V. Bex, and P. M. Midgley, eds, Cambridge University Press, Cambridge, UK, and New York, NY, USA.

Rignot, E., and S.S. Jacobs. 2002. Rapid bottom melting widespread near Antarctic ice sheet grounding lines. Science 296(5575):2,020–2,023, https://doi.org/​10.1126/science.1070942.

Sabine, C.L., R.A. Feely, R.M. Key, J.L. Bullister, F.J. Millero, K. Lee, T.-H. Peng, B. Tilbrook, T. Ono, and C.S. Wong. 2002. Distribution of anthropogenic CO2 in the Pacific Ocean. Global Biogeochemical Cycles 16:30-1–30-17, https://doi.org/​​10.1029/​​2001GB001639.

Sabine, C.L., R.A. Feely, N. Gruber, R.M. Key, K. Lee, J.L. Bullister, R. Wanninkhof, C.S. Wong, D.W.R. Wallace, and B. Tilbrook. 2004. The oceanic sink for anthropogenic CO2. Science 305:367–371, https://doi.org/10.1126/science.1097403.

Sabine, C.L., and R.A. Feely. 2007. The oceanic sink for carbon dioxide. Pp. 31–49 in Greenhouse Gas Sinks. D. Reay, C.N. Hewitt, K. Smith, and J. Grace, eds, CABI, Wallingford, UK.

Sabine, C.L., and T. Tanhua. 2010. Estimation of anthropogenic CO2 inventories in the ocean. Annual Review of Marine Science 2:175–198, https://doi.org/10.1146/annurev-marine-120308-080947.

Schmidtko, S., L. Stramma, and M. Visbeck. 2017. Decline in global oceanic oxygen content during the past five decades. Nature 542:335–339, https://doi.org/10.1038/nature21399.

Shao, A.E., S. Mecking, L. Thompson, and R.E. Sonnerup. 2016. Evaluating the use of 1-D transit time distributions to infer the mean state and variability of oceanic ventilation. Journal of Geophysical Research 121(9):6,650–6,670, https://doi.org/​10.1002/2016JC011900.

Sloyan, B.M., R. Wanninkhof, M. Kramp, G.C. Johnson, L.D. Talley, T. Tanhua, E. McDonagh, C. Cusack, E. O’Rourke, E. McGregor, and others. 2019. The global ocean ship-based hydrographic investigations program (GO-SHIP): A platform for integrated multidisciplinary ocean science. Frontiers in Marine Science 6:445, https://doi.org/10.3389/fmars.2019.00445.

Sonnerup, R.E., P.D. Quay, and J.L. Bullister. 1999a. Thermocline ventilation and oxygen utilization rates in the subtropical North Pacific based on CFC distributions during WOCE. Deep Sea Research Part I 46(5):777–805, https://doi.org/10.1016/S0967-0637(98)00092-2.

Sonnerup, R.E., P.D. Quay, A.P. McNichol, J.L. Bullister, T.A. Westby, and H.L. Anderson. 1999b. Reconstructing the oceanic 13C Suess effect. Global Biogeochemical Cycles 13(4):857–873, https://doi.org/​10.1029/​1999GB900027.

Sonnerup, R.E., J.L. Bullister, and S. Mecking. 2007. Circulation rate changes in the eastern subtropical North Pacific based on chlorofluorocarbon ages. Geophysical Research Letters 34(8), https://doi.org/​10.1029/2006GL028813.

Sonnerup, R.E., J.L. Bullister, and M.J. Warner. 2008. Improved estimates of ventilation rate changes and CO2 uptake in the Pacific Ocean using chlorofluorocarbons and sulfur hexafluoride. Journal of Geophysical Research: Oceans 113(C12), https://doi.org/​10.1029/​2008JC004864.

Sonnerup, R.E., S. Mecking, J.L. Bullister, and M.J. Warner. 2015. Transit time distributions and oxygen utilization rates from chlorofluorocarbons and sulfur hexafluoride in the Southeast Pacific Ocean. Journal of Geophysical Research 120(5):3,761–3,776, https://doi.org/​10.1002/​2015JC010781.

Steele, M., J. Zhang, and W. Ermold. 2010. Mechanisms of summertime upper Arctic Ocean warming and the effect on sea ice melt. Journal of Geophysical Research: Oceans 115(C11), https://doi.org/​10.1029/2009JC005849.

Stendardo, I., and N. Gruber. 2012. Oxygen trends over five decades in the North Atlantic. Journal of Geophysical Research 117(C11), https://doi.org/​10.1029/2012JC007909.

Takahashi, T., S.C. Sutherland, D.W. Chipman, J.G. Goddard, C. Ho, T. Newberger, C. Sweeney, and D.R. Munro. 2014. Climatological distributions of pH, pCO2, total CO2, alkalinity, and CaCO3 saturation in the global surface ocean, and temporal changes at selected locations. Marine Chemistry 164:95–125, https://doi.org/10.1016/​j.marchem.2014.06.004.

Talley, L.D., R.A. Feely, B.M. Sloyan, R. Wanninkhof, M.O. Baringer, J.L. Bullister, C.A. Carlson, S.C. Doney, R.A. Fine, E. Firing, and others. 2016. Changes in ocean heat, carbon content, and ventilation: A review of the first decade of GO-SHIP global repeat hydrography. Annual Review of Marine Science 8:185–215, https://doi.org/10.1146/annurev-marine-052915-100829.

Tanhua, T., K.A. Olsson, and E. Fogelqvist. 2004. A first study of SF6 as a transient tracer in the Southern Ocean. Deep Sea Research Part II 51:2,683–2,699, https://doi.org/10.1016/​j.dsr2.2001.02.001.

Tanhua, T., D.W. Waugh, and J.L. Bullister. 2013. Estimating changes in ocean ventilation from early 1990s CFC-12 and late 2000s SF6 measurements. Geophysical Research Letters 40:927–932, https://doi.org/​10.1002/grl.50251.

Tsubouchi, T., K. Våge, B. Hansen, K.M.H. Larsen, S. Østerhus, C. Johnson, S. Jónsson, and H. Valdimarsson. 2021. Increased ocean heat transport into the Nordic Seas and Arctic Ocean over the period 1993–2016. Nature Climate Change 11(1):21–26, https://doi.org/10.1038/s41558-020-00941-3.

Vollmer, M.K., and R.F. Weiss. 2002. Simultaneous determination of sulfur hexafluoride and three chlorofluorocarbons in water and air. Marine Chemistry 78(2–3):137–148, https://doi.org/10.1016/S0304-4203(02)00015-4.

von Schuckmann, K.L., L. Cheng, M.D. Palmer, J. Hansen, C. Tassone, V. Aich, S. Adusumilli, H. Beltrami, T. Boyer, F.J. Cuesta-Valero, and others. 2020. Heat stored in the Earth system: Where does the energy go? Earth System Science Data 12(3):2,013–2,041, https://doi.org/10.5194/essd-12-2013-2020.

Warner, M.J., and R.F. Weiss. 1985. Solubilities of chlorofluorocarbons 11 and 12 in water and seawater. Deep Sea Research Part I 32(12):1,485–1,497, https://doi.org/10.1016/0198-0149(85)90099-8.

Warner, M.J., J.L. Bullister, D.P. Wisegarver, R.H. Gammon, and R.F. Weiss. 1996. Basin-wide distributions of chlorofluorocarbons CFC-11 and CFC-12 in the North Pacific: 1985–1989. Journal of Geophysical Research 101(C9):20,525–20,542.

Waugh, D.W., M.K. Vollmer, R.F. Weiss, T.W.N. Haine, and T.M. Hall. 2002. Transit time distributions in Lake Issyk-Kül. Geophysical Research Letters 29(24):84-1–84-4, https://doi.org/​10.1029/​2002GL016201.

Waugh, D.W., T.M. Hall, B.I. McNeil, R. Key, and R.J. Matear. 2006. Anthropogenic CO2 in the oceans estimated using transit time distributions. Tellus B 58:376–389, https://doi.org/​10.1111/j.1600-0889.2006.00222.x.

Weiss, R.F., J.L. Bullister, and M.J. Warner. 1985. Atmospheric chlorofluoromethanes in the deep equatorial Atlantic. Nature 314:608–610, https://doi.org/​10.1038/​314608a0.

Wilkinson, M.D., M. Dumontier, I.J. Aalbersberg, G. Appleton, M. Axton, A. Baak, N. Blomberg, J.-W. Boiten, L.B. de Silva Santos, P.E. Bourne, and others. 2016. The FAIR guiding principles for scientific data management and stewardship. Scientific Data 3:160018, https://doi.org/10.1038/sdata.2016.18.

Wisegarver, D.P., and R.H. Gammon. 1988. A new transient tracer: Measured vertical distribution of CCl2FCClF2 (F-113) in the North Pacific Subarctic Gyre. Geophysical Research Letters 15(2):188–191, https://doi.org/10.1029/GL015i002p00188.

Wong, A.P.S., S.E. Wijffels, S.C. Riser, S. Pouliquen, S. Hosoda, D. Roemmich, J. Gilson, G.C. Johnson, K. Martini, D.J. Murphy, and others. 2020. Argo data 1999–2019: Two million temperature-​salinity profiles and subsurface velocity observations from a global array of profiling floats. Frontiers in Marine Science 7:700, https://doi.org/10.3389/fmars.2020.00700.

Woosley, R.J., F.J. Millero, and R. Wanninkhof. 2016. Rapid Anthropogenic Changes in CO2 and pH in the Atlantic Ocean: 2003–2014. Global Biogeochemical Cycles 30(1):70–90, https://doi.org/​10.1002/​2015GB005248.

Wu, L., W. Cai, L. Zhang, H. Nakamura, A. Timmermann, T. Joyce, M.J. McPhaden, M. Alexander, B. Qiu, M. Visbeck, and P. Chang. 2012. Enhanced warming over the global subtropical western boundary currents. Nature Climate Change 2(3):161–166, https://doi.org/10.1038/NCLIMATE1353.

Yang, H., G. Lohmann, W. Wei, M. Dima, M. Ionita, and J. Liu. 2016. Intensification and poleward shift of subtropical western boundary currents in a warming climate. Journal of Geophysical Research: Oceans 121(7):4,928–4,945, https://doi.org/​10.1002​/2015JC011513.

Copyright & Usage

This is an open access article made available under the terms of the Creative Commons Attribution 4.0 International License (https://creativecommons.org/licenses/by/4.0/), which permits use, sharing, adaptation, distribution, and reproduction in any medium or format as long as users cite the materials appropriately, provide a link to the Creative Commons license, and indicate the changes that were made to the original content. Images, animations, videos, or other third-party material used in articles are included in the Creative Commons license unless indicated otherwise in a credit line to the material. If the material is not included in the article’s Creative Commons license, users will need to obtain permission directly from the license holder to reproduce the material.