Introduction: A Survey of Life
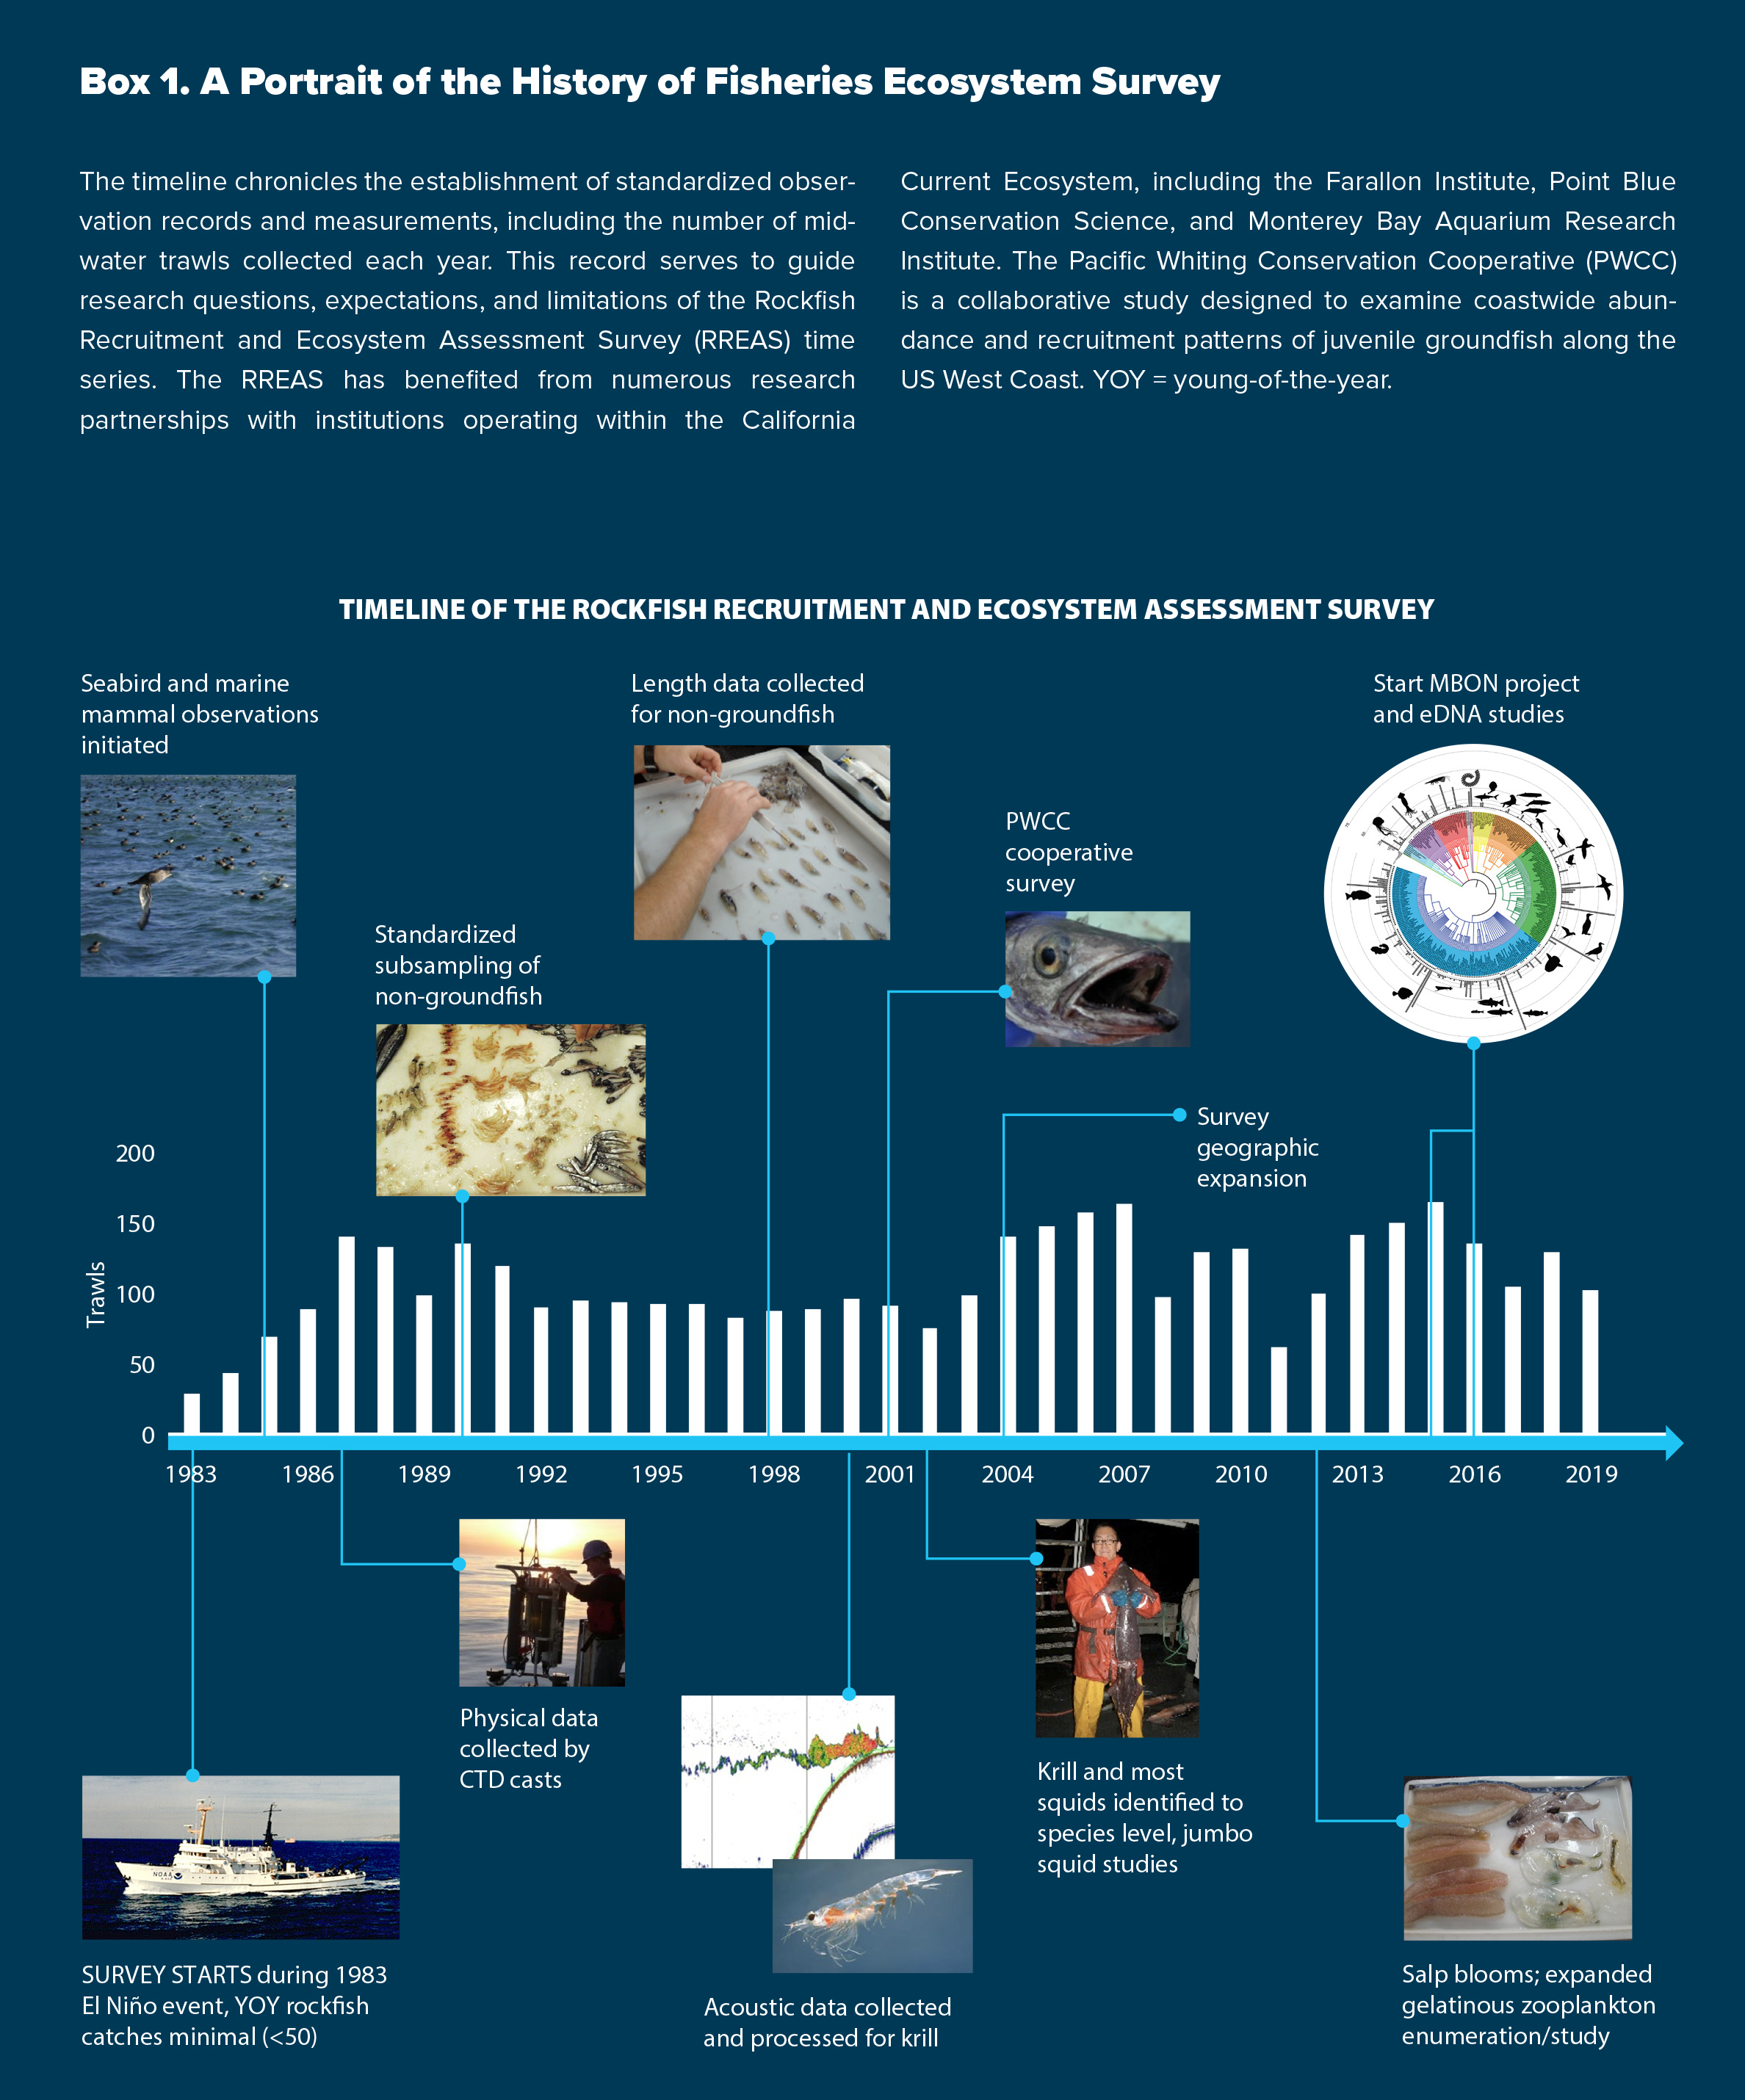
Since 1983, the annual NOAA Fisheries Rockfish and Ecosystem Assessment Survey (RREAS) has provided a foundational observational time series for studying the pelagic biodiversity of the California Current Ecosystem (CCE). The data and syntheses arising from the RREAS has informed a multitude of studies, ranging from stock assessments, to management of groundfish and salmon populations, to ocean climate drivers of community structure, to spatial ecology and trophic interactions, to models of ecosystem hotpots. The survey has also established a baseline record of the long-term pulse and rhythm of the biodiversity of pelagic midwater organisms, seabirds, and mammals. Survey scientists have ensured the consistent collection of measurements to monitor status and recruitment of rockfish species and the micronekton community for almost 40 years. Due to the difficulty of sampling micronekton, their pelagic biodiversity records are rare compared to zooplankton time series globally (Edwards et al., 2010). Given the impacts of loss of pelagic biodiversity on ecosystem function and services (Worm et al., 2006; Palumbi et al., 2009), it is paramount that baselines be established and understood (Jetz et al., 2012), and that they be connected to ecosystem management to assess potential future tipping points of forage fish populations (Pikitch et al., 2014). As part of the first US Marine Biodiversity Observation Network (MBON) program (Duffy et al., 2013), the RREAS was identified as a unique observational record for monitoring biodiversity of pelagic micronekton and assessing ocean-climate processes that underlie changes (McClatchie et al., 2014; Ralston et al., 2015; see Box 1).
|
All biodiversity observation and modeling information distilled here is derived from or was informed by the RREAS. That is both a strength and a weakness, as no one survey could possibly cover all aspects of research into pelagic biodiversity. Nevertheless, a well-designed and consistently executed survey is powerful for monitoring, building, and evaluating ecosystem models and for informing novel fishery management challenges. While originally designed to monitor young-of-the-year (YOY) groundfish populations and recruitment patterns to inform fisheries oceanography studies and stock assessments (Woodbury and Ralston, 1991; Ralston and Howard, 1995; Ralston et al., 2013), the trawls sample myriad coastal and mesopelagic fishes, squids, krill, and other invertebrates (Figures 1 and 2). Over time, efforts to collect quantitative information on this broader suite of forage taxa (with associated compositional data) grew in importance and led to expansion of the survey’s mission and scope of research. Currently, the survey provides robust relative abundance estimates for many forage taxa, an assessment of upper trophic level predators, and ecosystem status (context) for fisheries management in the CCE.
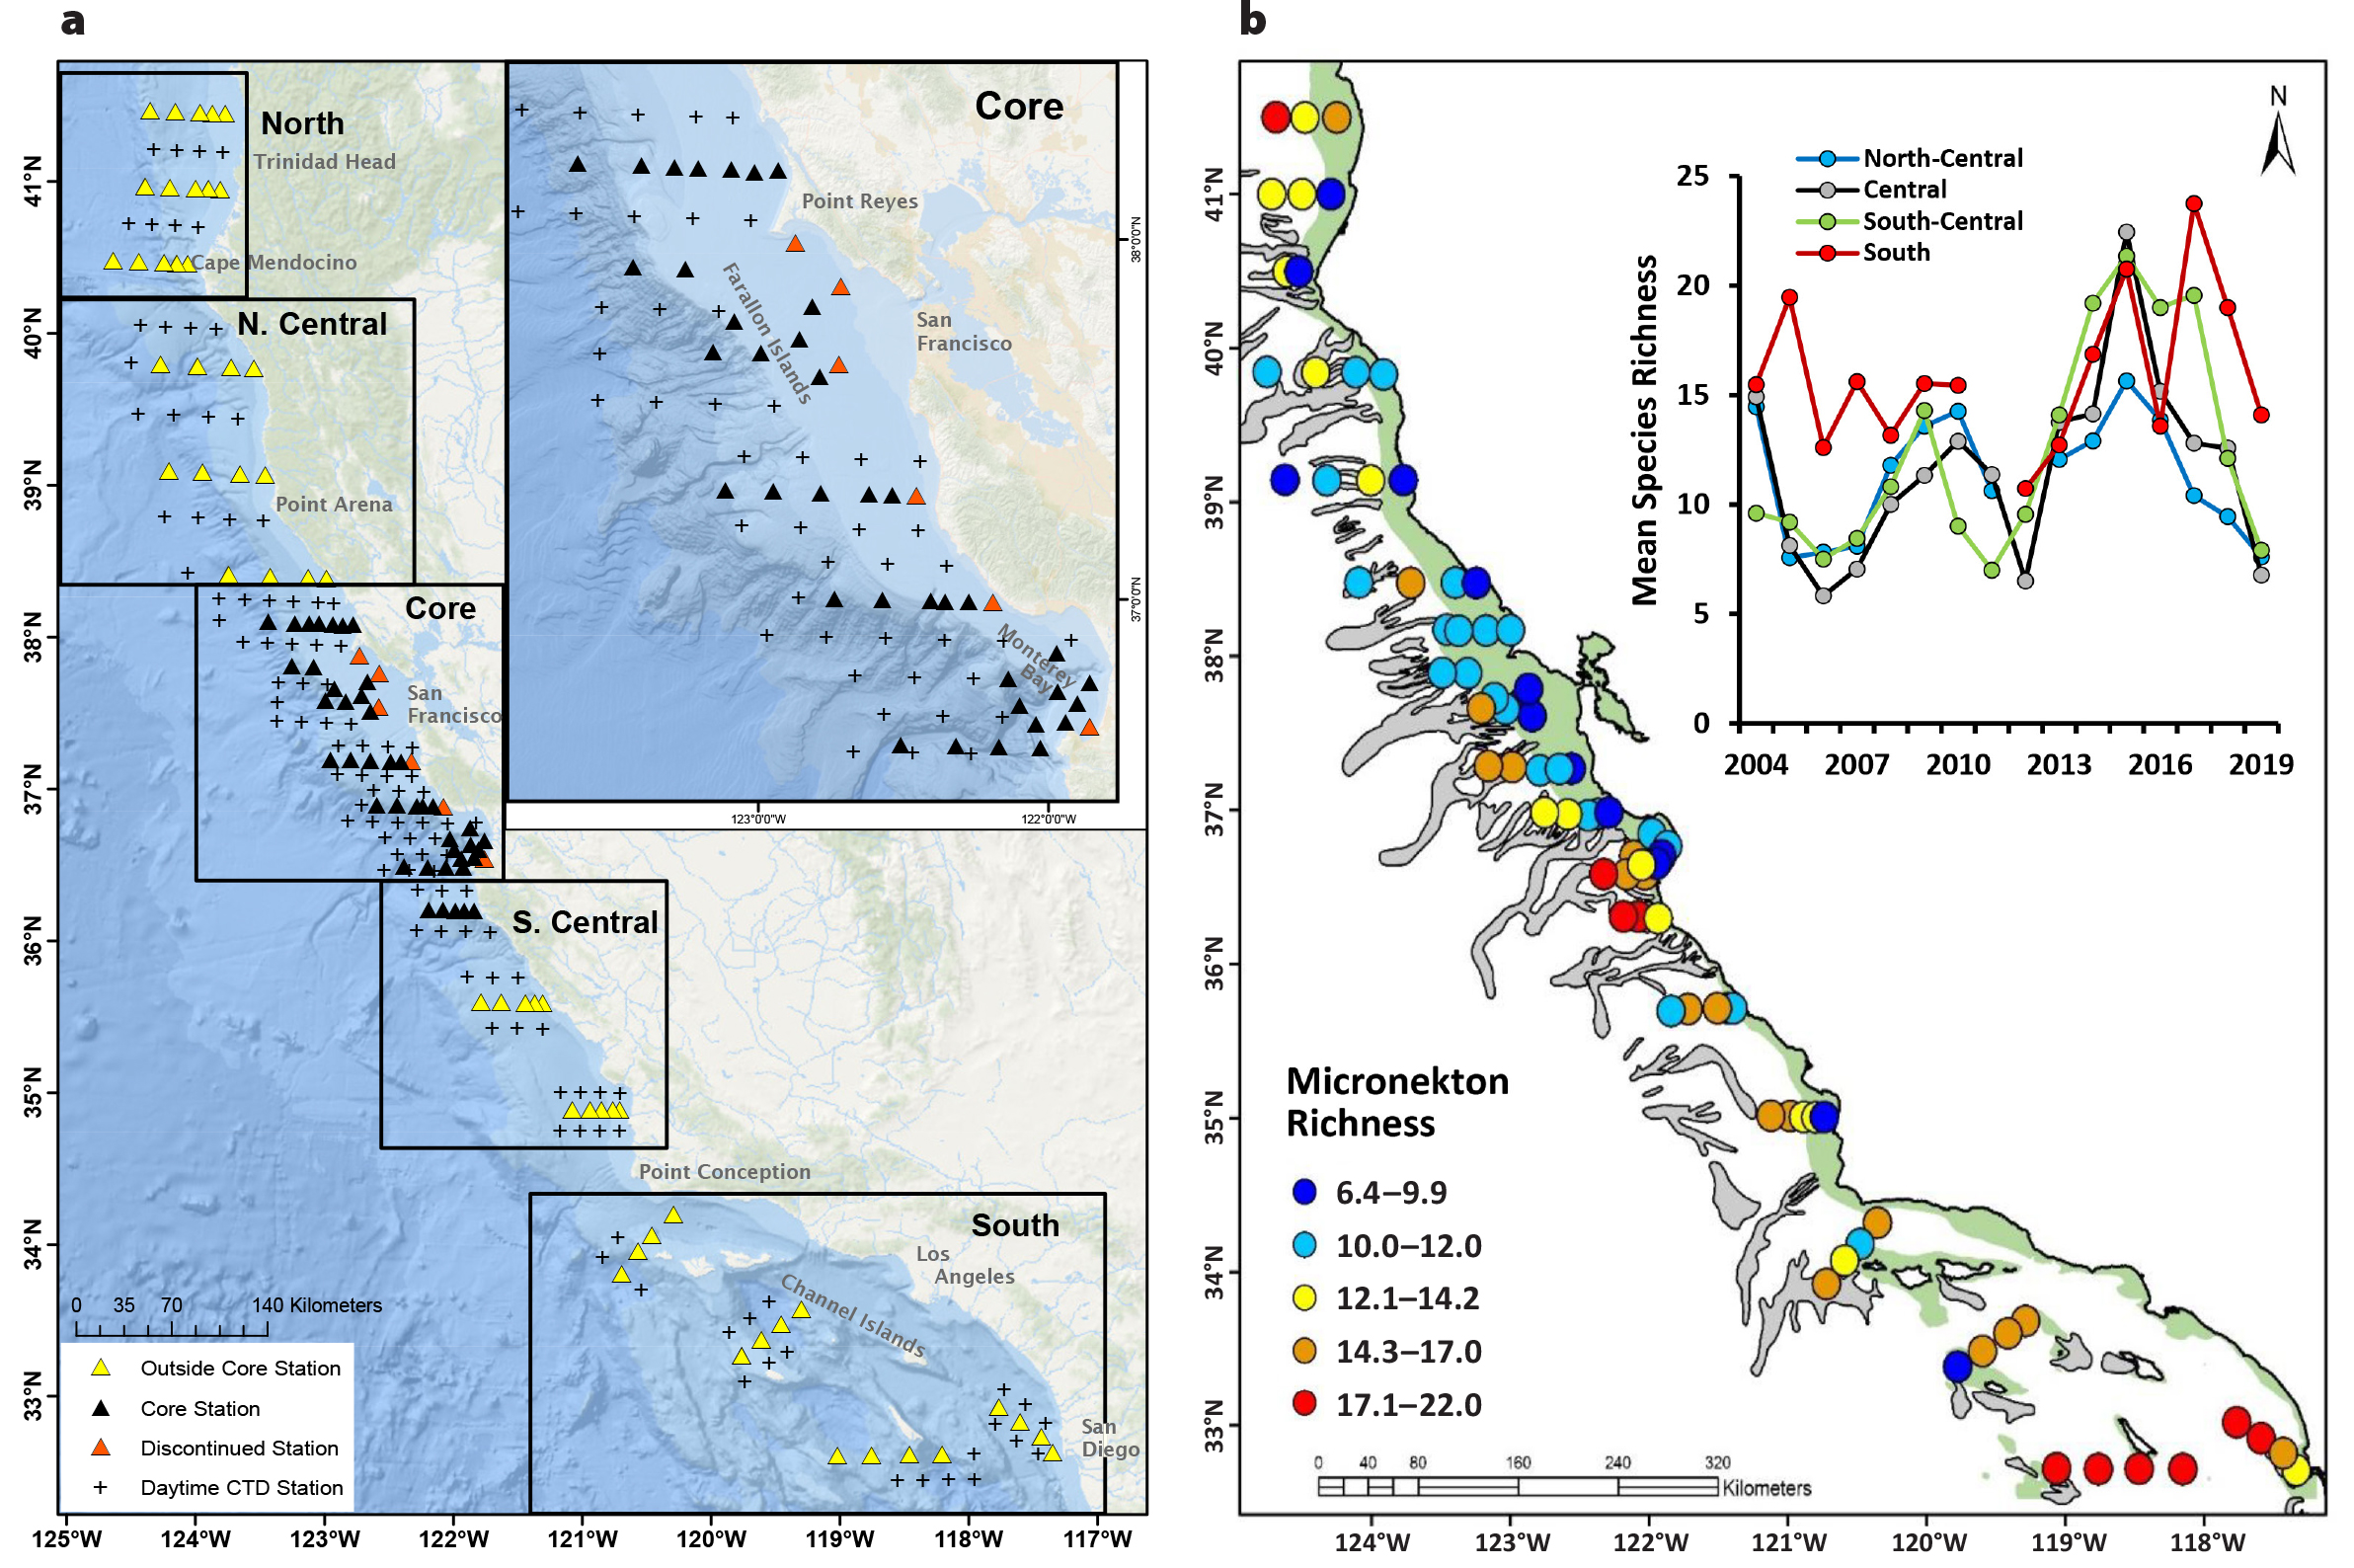
Figure 1. (a) Survey grid of the annual Rockfish Recruitment and Ecosystem Assessment Survey (RREAS) conducted during spring. The inset shows the location of the long-term “core” area that has been monitored since 1983. The area of the survey was expanded in 2004, and some stations were dropped due to changes in survey platform and protocol. (b) Regional micronekton species richness patterns monitored by the RREAS (mean per trawling station; 2004–2019). The inset shows regional spatial means of species richness patterns, indicating higher richness in the south and strong regional covariability in the north. Submarine canyons and the extent of the continental shelf (200 m isobaths) are shown to provide habitat context. > High res figure
|
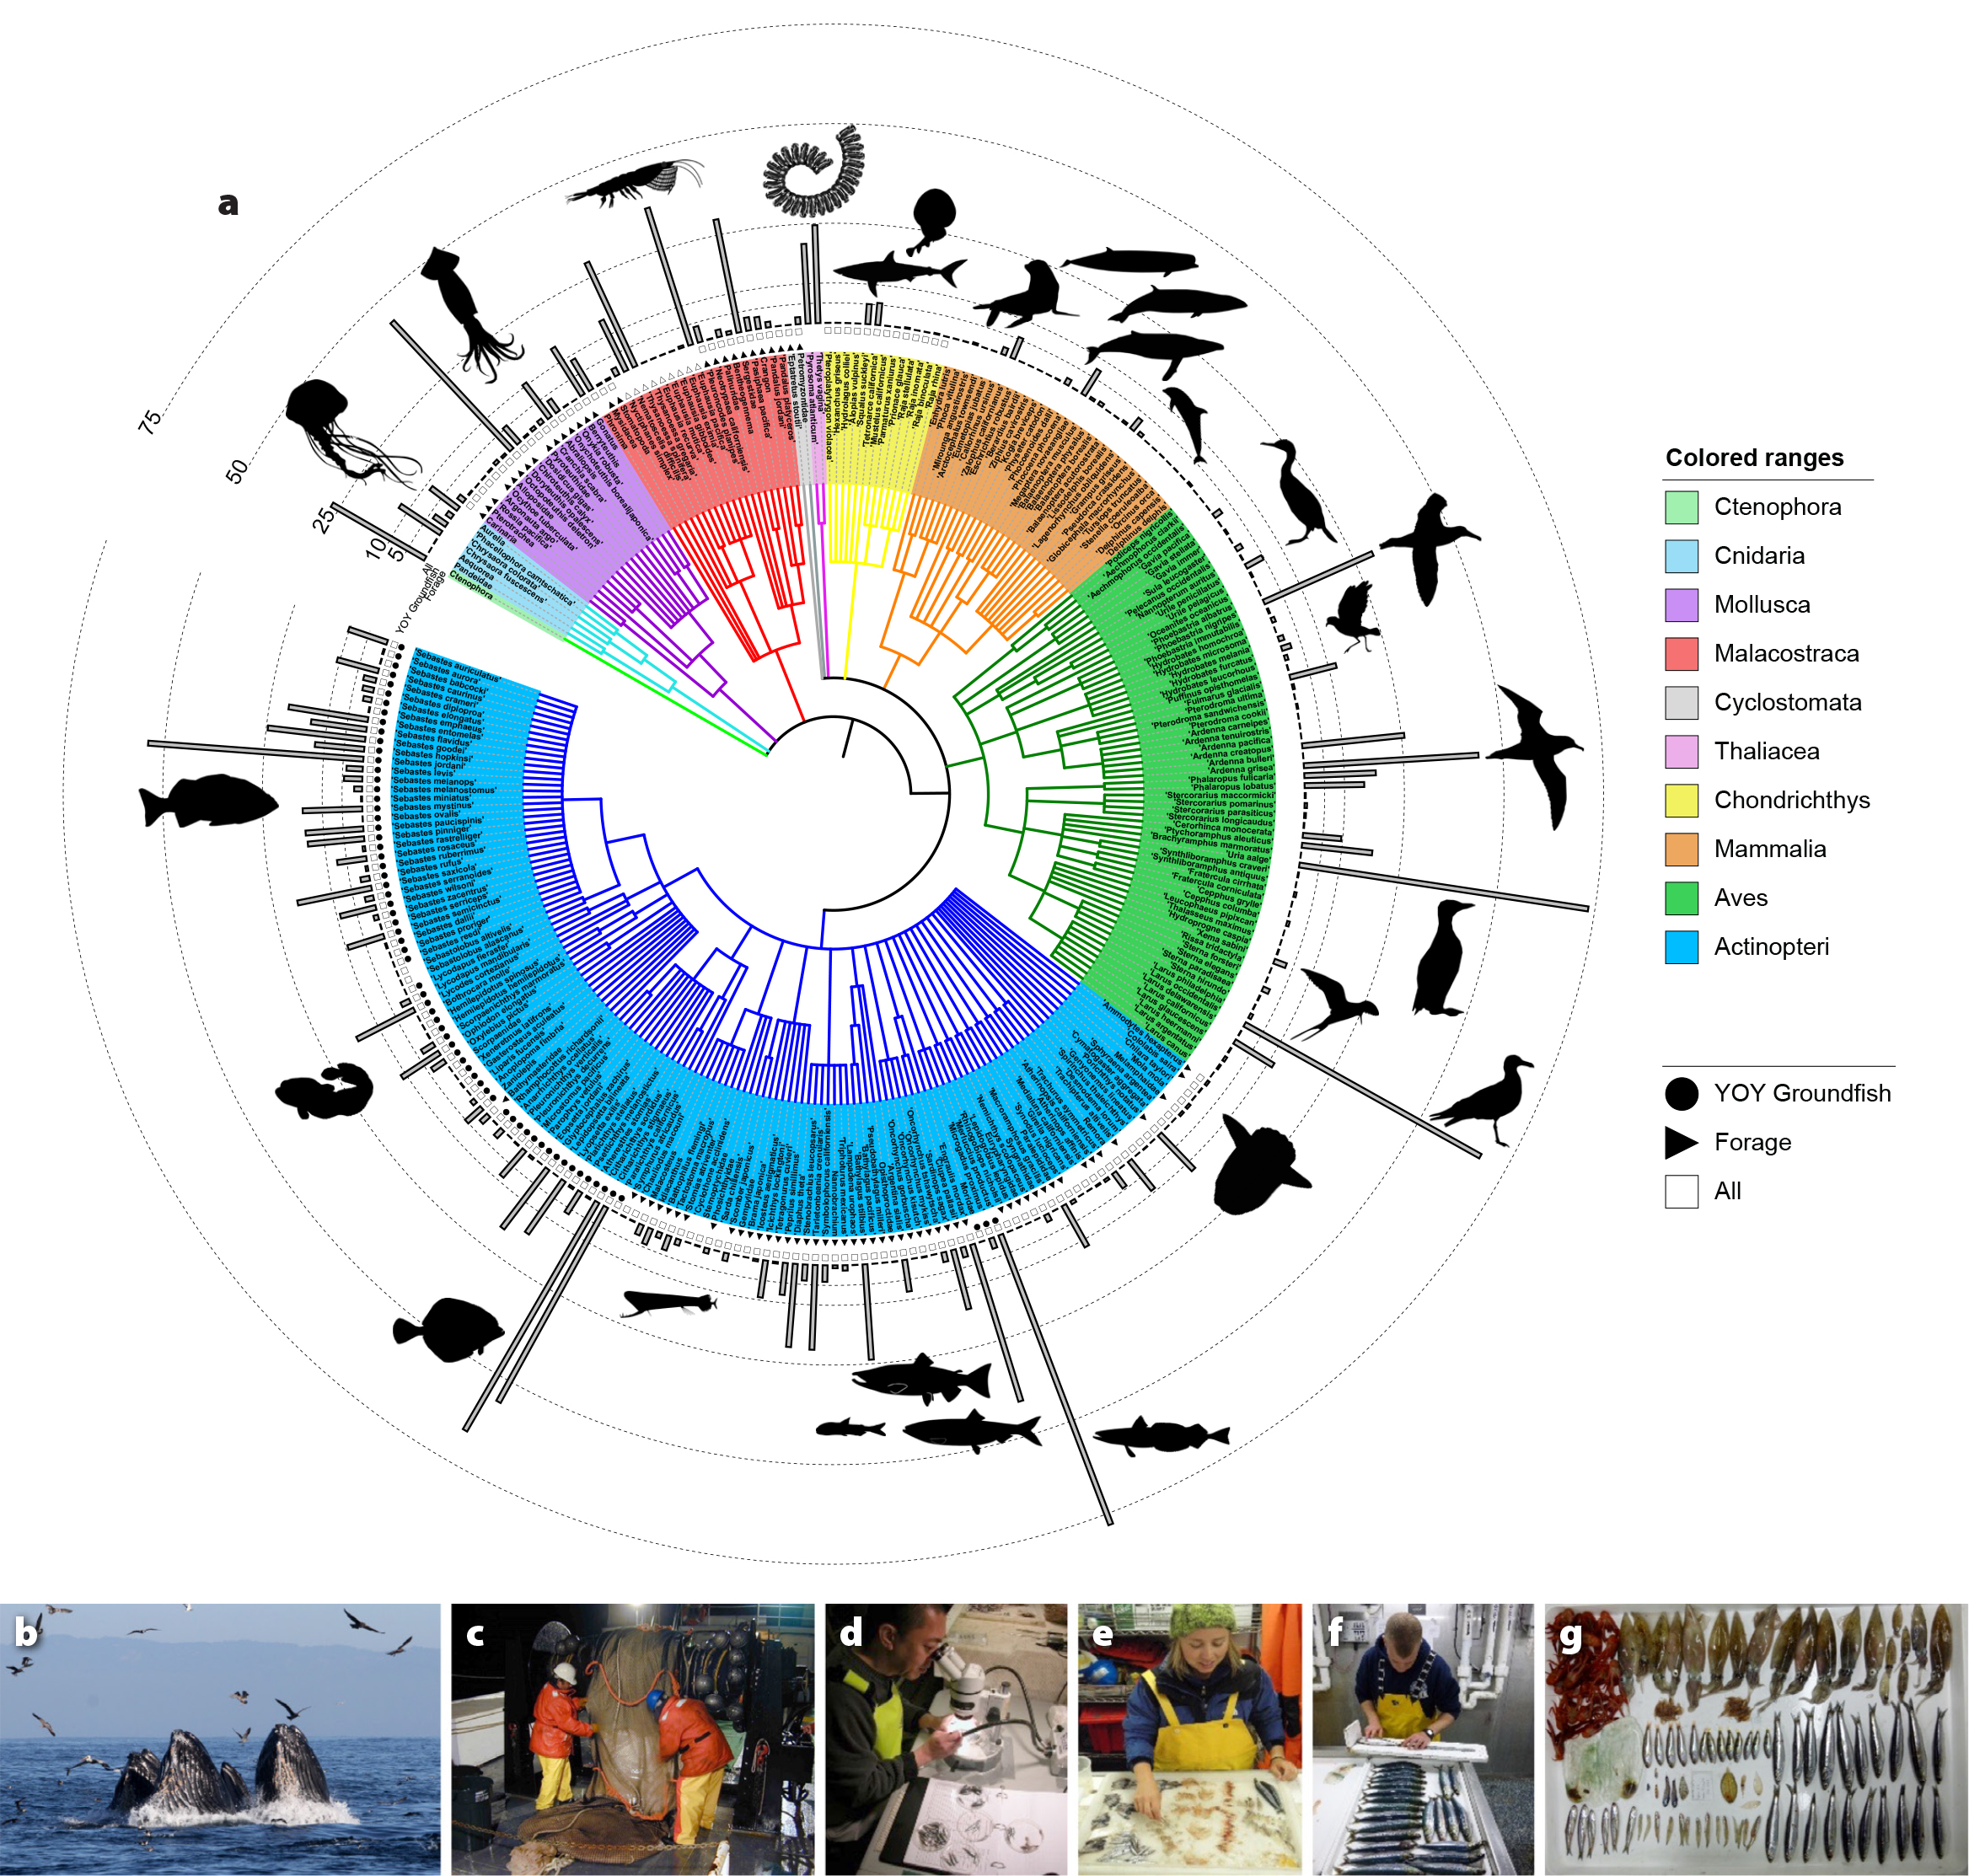
Figure 2. (a) Phylogeny of life monitored by the Rockfish Recruitment and Ecosystem Assessment Survey (RREAS). Here, the diversity of organisms is based on their evolutionary relationships and organized by taxonomic classification. Pelagic fishes and invertebrates are monitored through midwater trawling, and visual surveys are used to monitor seabirds and marine mammals. Gray bars reflect the frequency of occurrence (percentage) of taxa recorded in midwater trawls and in visual surveys (proportion occurrence per 3 km). Symbols near taxa nodes that reflect partitions of biodiversity time series aimed at monitoring biodiversity of pelagic organisms in midwater trawls reflect two basic functional groups: Young-of-the-year (YOY) groundfish and forage species (mix of coastal pelagic and mesopelagic species) and “All” taxa included as per Santora et al. (2017a); see also Figure 3b for time series. (b–g) Photographs of RREAS sampling and monitoring diversity of life. (b) Humpback whales lunge as they feed on anchovy and associated seabirds (sooty shearwaters, western gulls, brown pelicans, and common murre). (c) A NOAA crew deploys a midwater trawl. (d–f) RREAS scientists sort, identify, and measure catch. (g) Examples of organisms collected within a trawl. An interactive version of the RREAS phylogeny is available at: https://itol.embl.de/tree/1615523713145021576623832. > High res figure
|
Micronekton sampling is conducted at night at fixed stations using a modified Cobb midwater trawl with a 9.5 mm cod-end liner and a headrope depth of 30 m. Trawls typically last 15 min at a speed of approximately 2 kt (Sakuma et al., 2016). While technically a “trawl,” the relatively smaller size, finer mesh, and slower speed of RREAS equipment allow for robust sampling of organisms much smaller than those collected by more commonly used surface trawls (for coastal pelagic species) or bottom trawls (for groundfish). The catch is subsampled, taxa are enumerated and measured, and relative abundance of micronekton organisms is estimated (catch per unit effort, or CPUE). Hydrographic profiles of temperature and salinity are collected coincident with water filtration to assess chlorophyll-a and nutrients, and recently, as part of MBON, environmental DNA (eDNA) sampling is used to assess vertebrate biodiversity and to compare our collections with other trawl collections (Closek et al., 2019). Visual surveys monitor distribution and abundance of seabird and marine mammal species (Ainley and Hyrenbach, 2010), and fisheries acoustics allow monitoring of distribution and intensity of krill hotspots (Santora et al., 2011). In 2004, the survey’s geographic scope expanded beyond central California, increasing its importance in coastwide regional ecosystem assessments (Figure 1; Sakuma et al., 2016). Today, RREAS holistic sampling demonstrates a powerful research framework for informing pelagic biodiversity dynamics of life in a moving ocean.
Biodiversity is often used as a metric for ecosystem health and resilience to climate or anthropogenic disturbances (Schmitz, 1994; Yachi and Loreau, 1999). Additionally, resilience and ecosystem function may be viewed as the capacity to absorb disturbances when communities are reconfigured, but the overall function remains similar (Folke et al., 2004; Ives and Carpenter, 2007). Food webs in coastal upwelling areas are diverse, with alternate pathways between primary and secondary consumers varying due to decadal to seasonal variability of ocean climate conditions (Angel, 1993; Lindegren et al., 2016). In particular, interannual productivity of the central CCE spring food web is sensitive to winter upwelling conditions (Lenarz et al., 1995; Bograd et al., 2009; Schroeder et al., 2013) and to effects of the El Niño-Southern Oscillation and other shifts of water masses that result in movement of warmer subtropical species into coastal waters (e.g., copepod biodiversity and pyrosomes; Peterson et al., 2014; Miller et al., 2019). By comparison, energy density of micronekton organisms and their transfer efficiency to upper trophic levels within productive coastal upwelling food webs is greater than in offshore oligotrophic waters (Angel, 1993). Increased movement of warmer water species into coastal waters is an indicator of weaker upwelling conditions, whereby less wind-driven Ekman transport results in more persistent impingement of oligotrophic waters and a spatial shift of pelagic species communities (Santora et al., 2017a, 2020). Years characterized by warmer or weaker upwelling conditions typically coincide with a decline in krill abundance and low abundance and diversity of juvenile rockfishes, leading to population impacts on upper trophic level populations (e.g., salmon, seabirds, whales; Wells et al., 2017; Santora et al., 2020). Therefore, perception of higher or lower pelagic biodiversity and consequences of ecosystem function must be examined considering the trophic pathways that support alternate ecosystem states (Stachowicz et al., 2007).
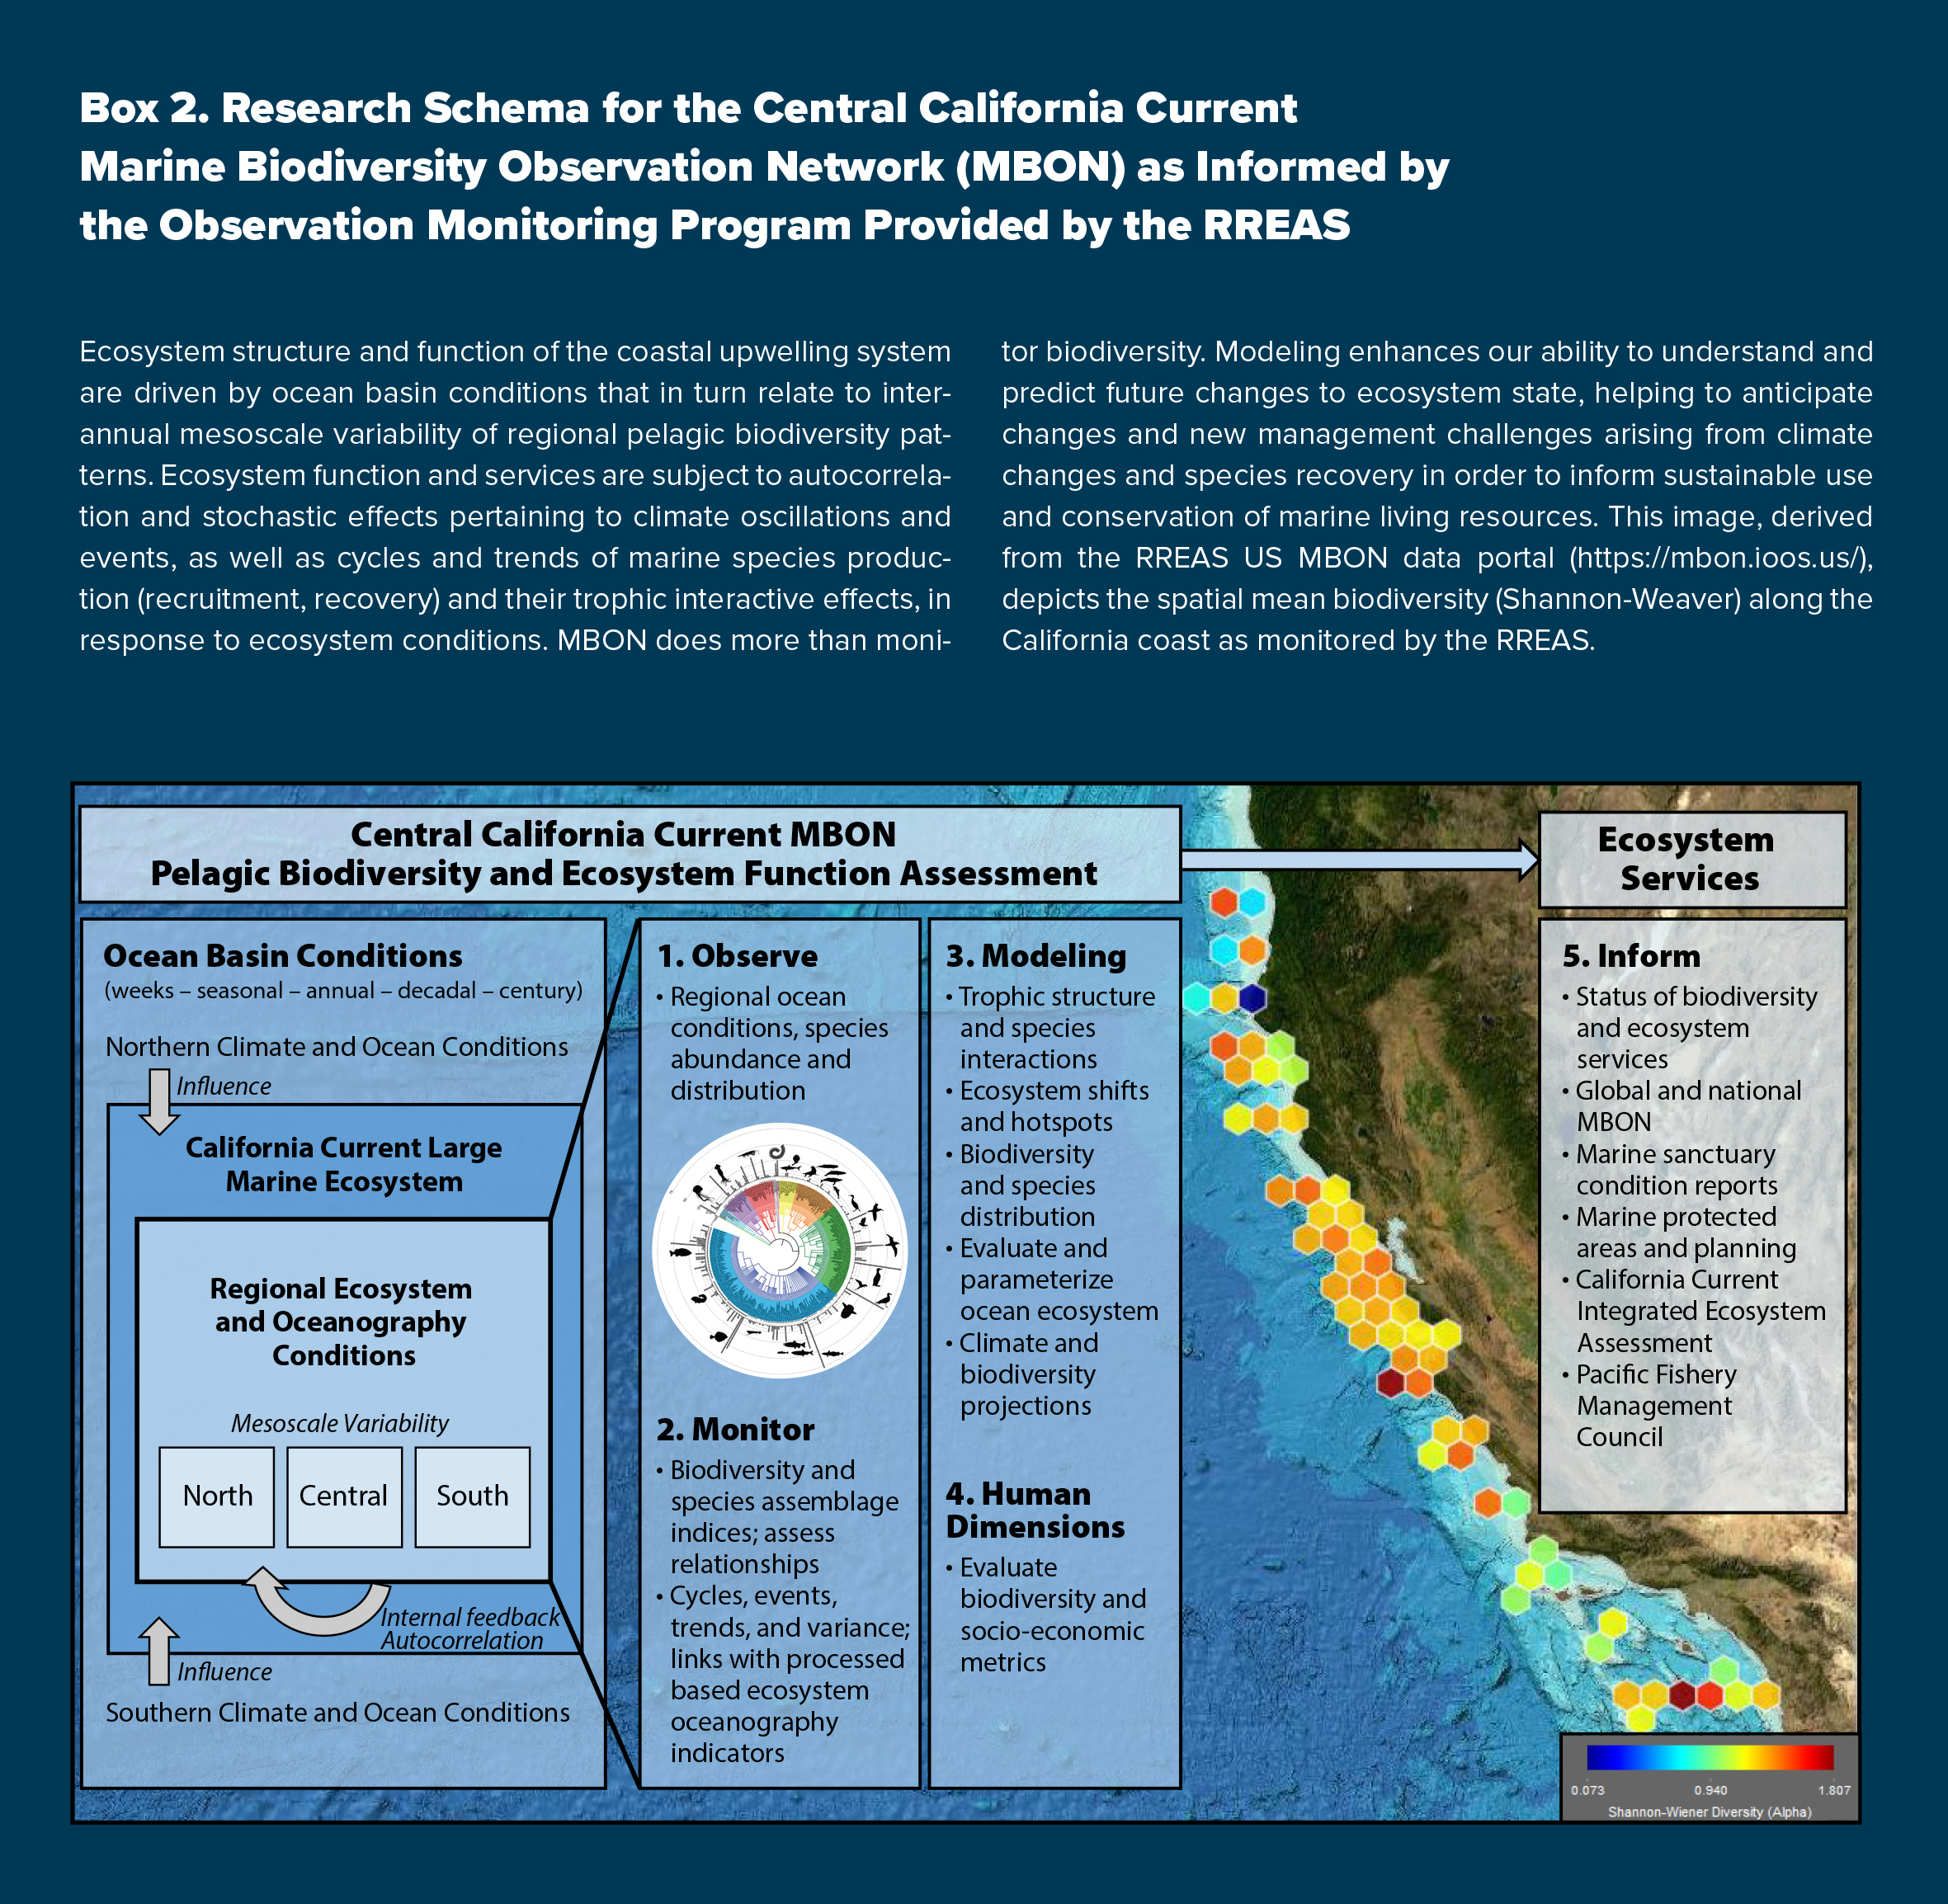
Using the lengthy RREAS time series, our initial MBON objective established baseline metrics for monitoring pelagic biodiversity, including quantifying cycles and impacts of extreme events along with environmental drivers, and describing how changes in biodiversity may reflect ecosystem function and the services provided (Duffy et al., 2013; see Box 2). Simultaneously, our ecosystem oceanography approach has used biodiversity observations and identified physical and biological processes affecting food web functioning to parameterize and evaluate numerical ocean-ecosystem and species distribution models. One of the greatest strengths of an integrated long-term biodiversity monitoring program is the ability to infer ecosystem condition and anticipate ocean climate changes and species interactions that may result in impacts to fished resources and protected species (Duffy et al., 2013). For these purposes, we highlight the response and recovery of environmental and biological conditions during a large marine heatwave event that persisted for multiple years, resulting in record high pelagic biodiversity and impacts on socioeconomic services (Santora et al., 2017a, 2020). Thereby, we demonstrate how an integrated ecosystem perspective is critical for an effective MBON program.
|
The objective of this review is to summarize patterns of pelagic biodiversity and function from a fisheries and ecosystem oceanography perspective—a large and difficult task. We summarize where our research has been, where it’s heading, and what challenges may lie ahead by highlighting steps and components needed to develop an ecosystem oceanographic approach to synthesize biodiversity observations and modeling approaches. The work is organized into interconnected modules that summarize and illustrate patterns of pelagic biodiversity using: (1) a phylogenetic approach, (2) known modulations and environmental drivers of variability, (3) remote sensing and modeling tools for monitoring biodiversity, (4) status of top predator biodiversity, (5) ecosystem and hotspot modeling, and (6) connections between biodiversity, ecosystem function, and services provided. We end each module with a brief discussion (codetta) of questions raised and recommendations for future studies and partnerships to further improve integrative monitoring of pelagic biodiversity.
Note Thy Phylogeny
No species can be understood in isolation. The mosaic of life inhabiting the pelagic ocean must be examined from both evolutionary and ecosystem perspectives (Angel, 1993). A phylogeny is a guide to this biodiversity, and at the root of our biodiversity assessment is a phylogenetic tree depicting the evolutionary spectrum of life monitored by RREAS midwater trawl and visual surveys (Figure 2). By design, the midwater trawl survey targets pelagic stages of juvenile rockfish and other demersal fishes, but fortuitously also samples a suite of other pelagic micronekton, thus providing standardized abundance and demographic information on a variety of invertebrate and micronekton (Figures 1 and 2). Their evolutionary relationships, to the minimum taxonomic resolution possible, summarize the richness of pelagic taxa (a total of 231 species or higher-level groupings) sampled by midwater trawls. Species selection and biodiversity definitions pertaining to species groups have been summarized previously, and there is a web tool available (https://mbon.ioos.us/) for visualizing and accessing catch data (Santora et al., 2017a). Combined with visual surveys of seabirds and marine mammals (95 taxa), the phylogeny represents the pelagic biodiversity of life and thus possible trophic interactions, including shifts in abundance and community organization. The colors in Figure 2a represent the taxonomic classes (10) provided by the integrated RREAS sampling and identification approach. The most diverse group is finfish, followed by seabirds, marine mammals, crustaceans, cephalopods, cartilaginous fish, jellyfish, ctenophores, lamprey, and pelagic tunicates. Representative taxon groupings are depicted as silhouettes to highlight the variety of marine life monitored by the RREAS. Frequency of occurrence in the biodiversity record is based on sampling history (total number of trawls or visual survey records) and is illustrated in the surrounding histogram, providing quick reference to common and less common taxa. Frequently occurring taxa may be important indicators of pelagic ecosystem organization and function.
This integrated middle and upper trophic level pelagic phylogeny represents a functional baseline for monitoring and communicating pelagic biodiversity condition and status. Specific to fisheries monitoring and trawl sampling, there is obvious enhanced diversity and identification of the genus Sebastes, other juvenile groundfish, and coastal pelagic and mesopelagic fish species compared to other micronekton taxa, but that is also due to the overall frequency of occurrence of these organisms in trawl samples (Figure 2). Frequency of observations and taxa accumulation curves provide context regarding taxa ubiquity and rarity, given trawl and visual survey sampling methods. Further, the frequency distribution and relative abundance of similar taxonomic midwater organisms are classified in order to estimate standard biodiversity metrics used to monitor temporal variability and ecosystem function (i.e., “All” taxa, “YOY Groundfish,” and “Forage”; see Santora et al., 2017a). Geographically, total pelagic biodiversity is consistently higher in the south compared to the central and northern California Current (Figure 1b), in agreement with other evaluations of marine fauna in this region (Gottscho, 2016). North of Point Conception (~34.5°N), there is a cross-shelf gradient, with higher diversity offshore, especially near or within the submarine canyons that facilitate benthic-pelagic coupling and are where physical forces act to concentrate micronekton (Figure 1; Chavez et al., 2017; Santora et al., 2018). The time series of regional micronekton species richness covary through time. As part of MBON, we developed specific biodiversity time series of YOY groundfish, coastal and mesopelagic forage species, and top predators; these are discussed in greater detail below.
Questions and Recommendations
If possible (depending on availability of standardized effort), all fisheries ecosystem surveys and their associated monitoring networks should develop phylogenies of life based on their survey observations in order to improve research and to facilitate better communication of the importance of biodiversity monitoring. Additionally, functional, trait-based and ecosystem service phylogenies could be applied to test hypotheses. The RREAS could benefit from further assessment of biodiversity metrics for microbes, phytoplankton, and micro- and macro- zooplankton trophic levels. Biodiversity and function of gelatinous zooplankton communities also require additional research because of their role in carbon cycling and sequestration and because they have appeared in extremely high abundance in recent years. Baseline biodiversity patterns from midwater trawling can inform the sampling, synthesis, and expectations for novel molecular methods, such as eDNA for vertebrates (e.g., 12S metabarcoding).
Known Modulations
Two primary signals of pelagic biodiversity can be inferred from the RREAS time series: (1) YOY groundfish, and (2) forage species, coastal and mesopelagic fish collectively, and squid species (Figures 2 and 3). Correspondingly, time series of abundance, species richness, and diversity within these signals can be correlated (Santora et al., 2017a). Monitoring these biodiversity signals revealed different environmental drivers of ecosystem productivity and distribution patterns. Although no linear trends have been detected, both signals display the presence of cycles and event-scale phenomena related to ocean climate conditions. The YOY groundfish diversity signal has strong autocorrelation at one-year and three- to five-year lags, and forage diversity has strong one-year and four- to five-year lags, indicating autoregressive year effects of potential recruitment cycles and predictable community shifts. A high or low state of either group is likely to be followed by a similar year, with shifts in balance occurring every three to five years on average. Spatially, these signals relate to geographic pelagic community structure (Figures 3 and 4). YOY groundfish diversity is spatially consistent (cosmopolitan) throughout coastal and offshore monitoring areas, whereas forage species and overall diversity are higher offshore, but display dynamic shoreward shifts during anomalously warm (weak upwelling) years. Further, variability of micronekton community composition and anomalies of indicator taxa reflect changes in spring mesoscale ocean conditions (Figure 4). Event-scale phenomena underlying past changes in biodiversity signals were associated with El Niño and La Niña conditions as well as delayed upwelling and spring transition dynamics that impact production of coastal food webs (Wells et al., 2016; Santora et al., 2017a). Most significantly, there was unprecedented high biodiversity of all taxa (two orders of magnitude change) during the 2015–2016 marine heatwave (Figure 3). A complex mixture of ecological surprises that possibly could have been anticipated coincided with this ecosystem shift.
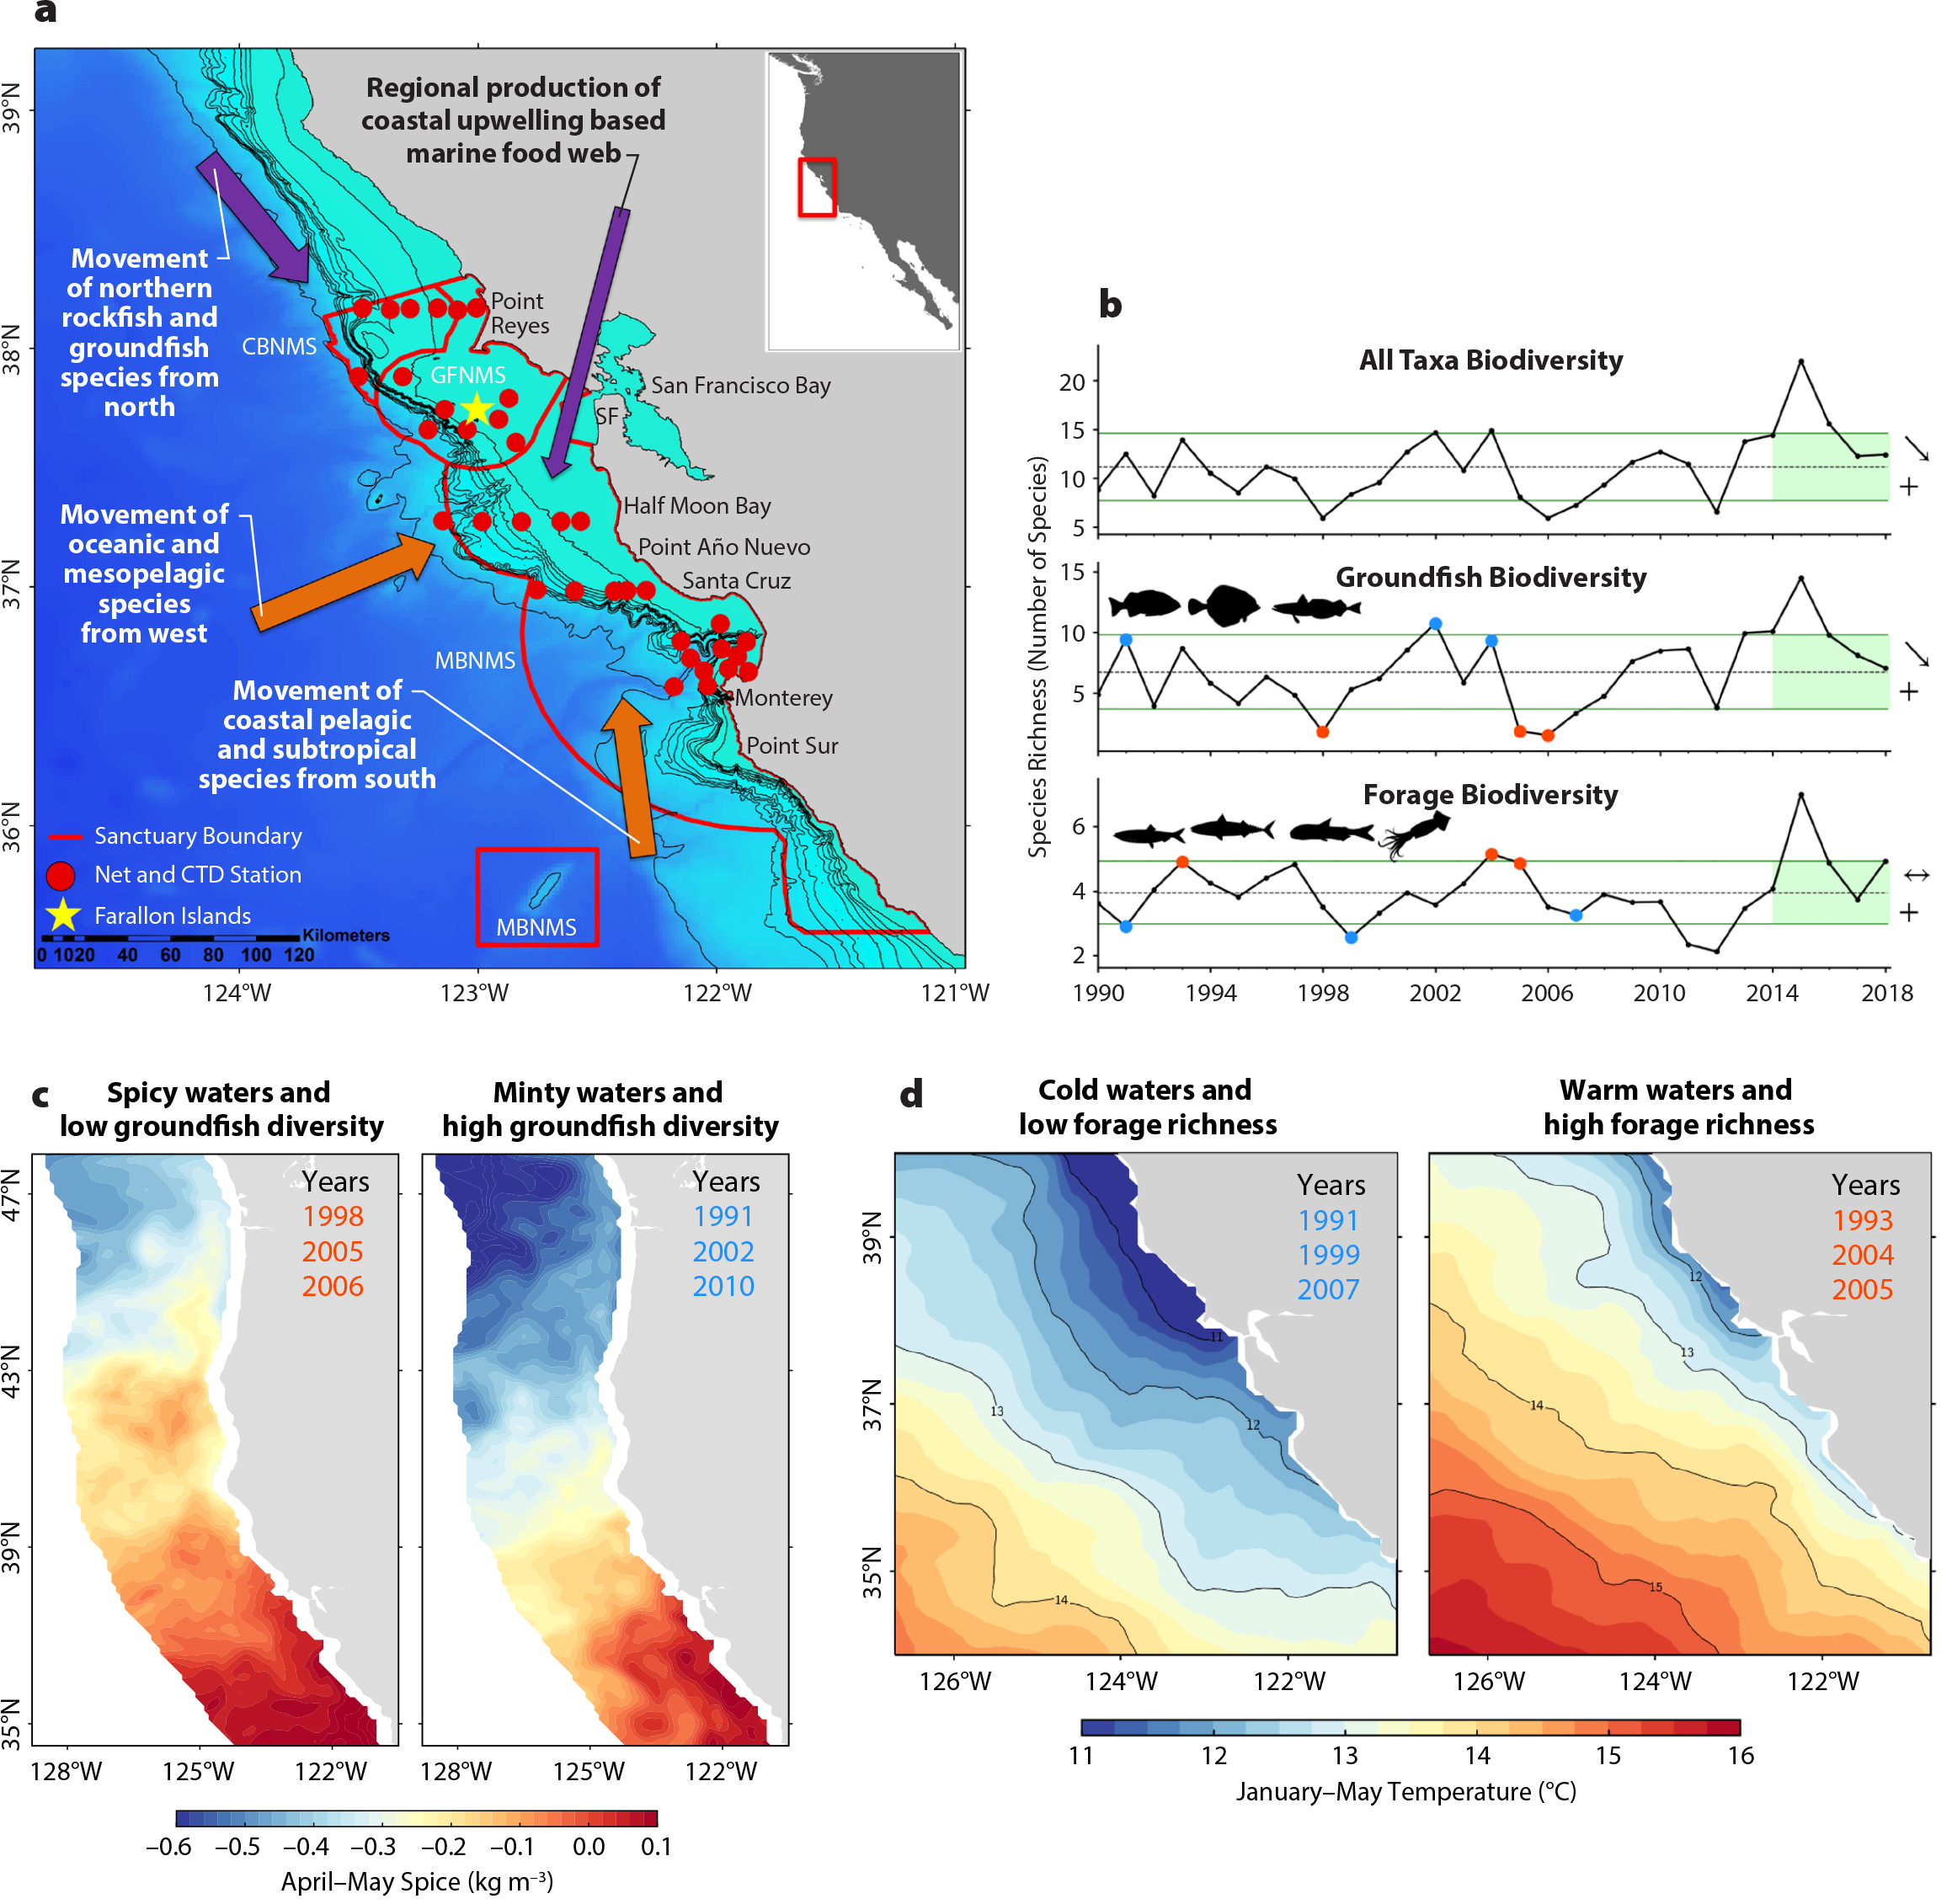
Figure 3. Ocean and climate drivers of pelagic biodiversity. (a) A summary of changes in biodiversity of pelagic organisms monitored by the RREAS (in the central study region only) reflects regional production of the coastal upwelling ecosystem and advection (transport) and movement patterns of organisms with either northern, southern, or offshore habitat affinities. CBNMS = Cordell Bank National Marine Sanctuary. GFNMS = Greater Farallones National Marine Sanctuary. MBNMS = Monterey Bay National Marine Sanctuary. From Santora et al. (2017a) (b) Examples of the primary modes of variance of midwater trawl species richness time series derived from the RREAS central monitoring region. The categories reflect coding in the Figure 2a. The horizontal dashed line is the mean and green lines are ± standard deviation. Green shading (five-year trend) and symbols reflect trend analysis based on California Current Integrated Ecosystem Assessment standardization. Years marked with blue (red) dots are associated with cool (warm) oceanic conditions (climatological time period of 1980–2010) (c) Source water variability and flux of subtropical (“spicy”) and subarctic (“minty”) waters relates to YOY groundfish biodiversity. Spiciness (kg m–3) at the depth of the 26.0 isopycnal is mapped during high and low groundfish biodiversity years. Years of low groundfish biodiversity occur during “spicy” periods (warm and salty) and high groundfish biodiversity during “minty” periods (cool and fresh). Composites were created using spiciness averaged over April–May. From Schroeder et al. (2019) (d) Variation in winter sea surface temperature reflects ocean basin and climate conditions and interannual variability in upwelling-favorable winds within the California Current Ecosystem (CCE) that relates to biodiversity of pelagic “forage species” (non-groundfish signal). Here, years of low and high biodiversity of forage species are partitioned to illustrate changes in winter and spring ocean surface temperatures pertaining to observed shifts in biodiversity patterns, with higher forage biodiversity during warm years. From Santora et al. (2017a). > High res figure
|
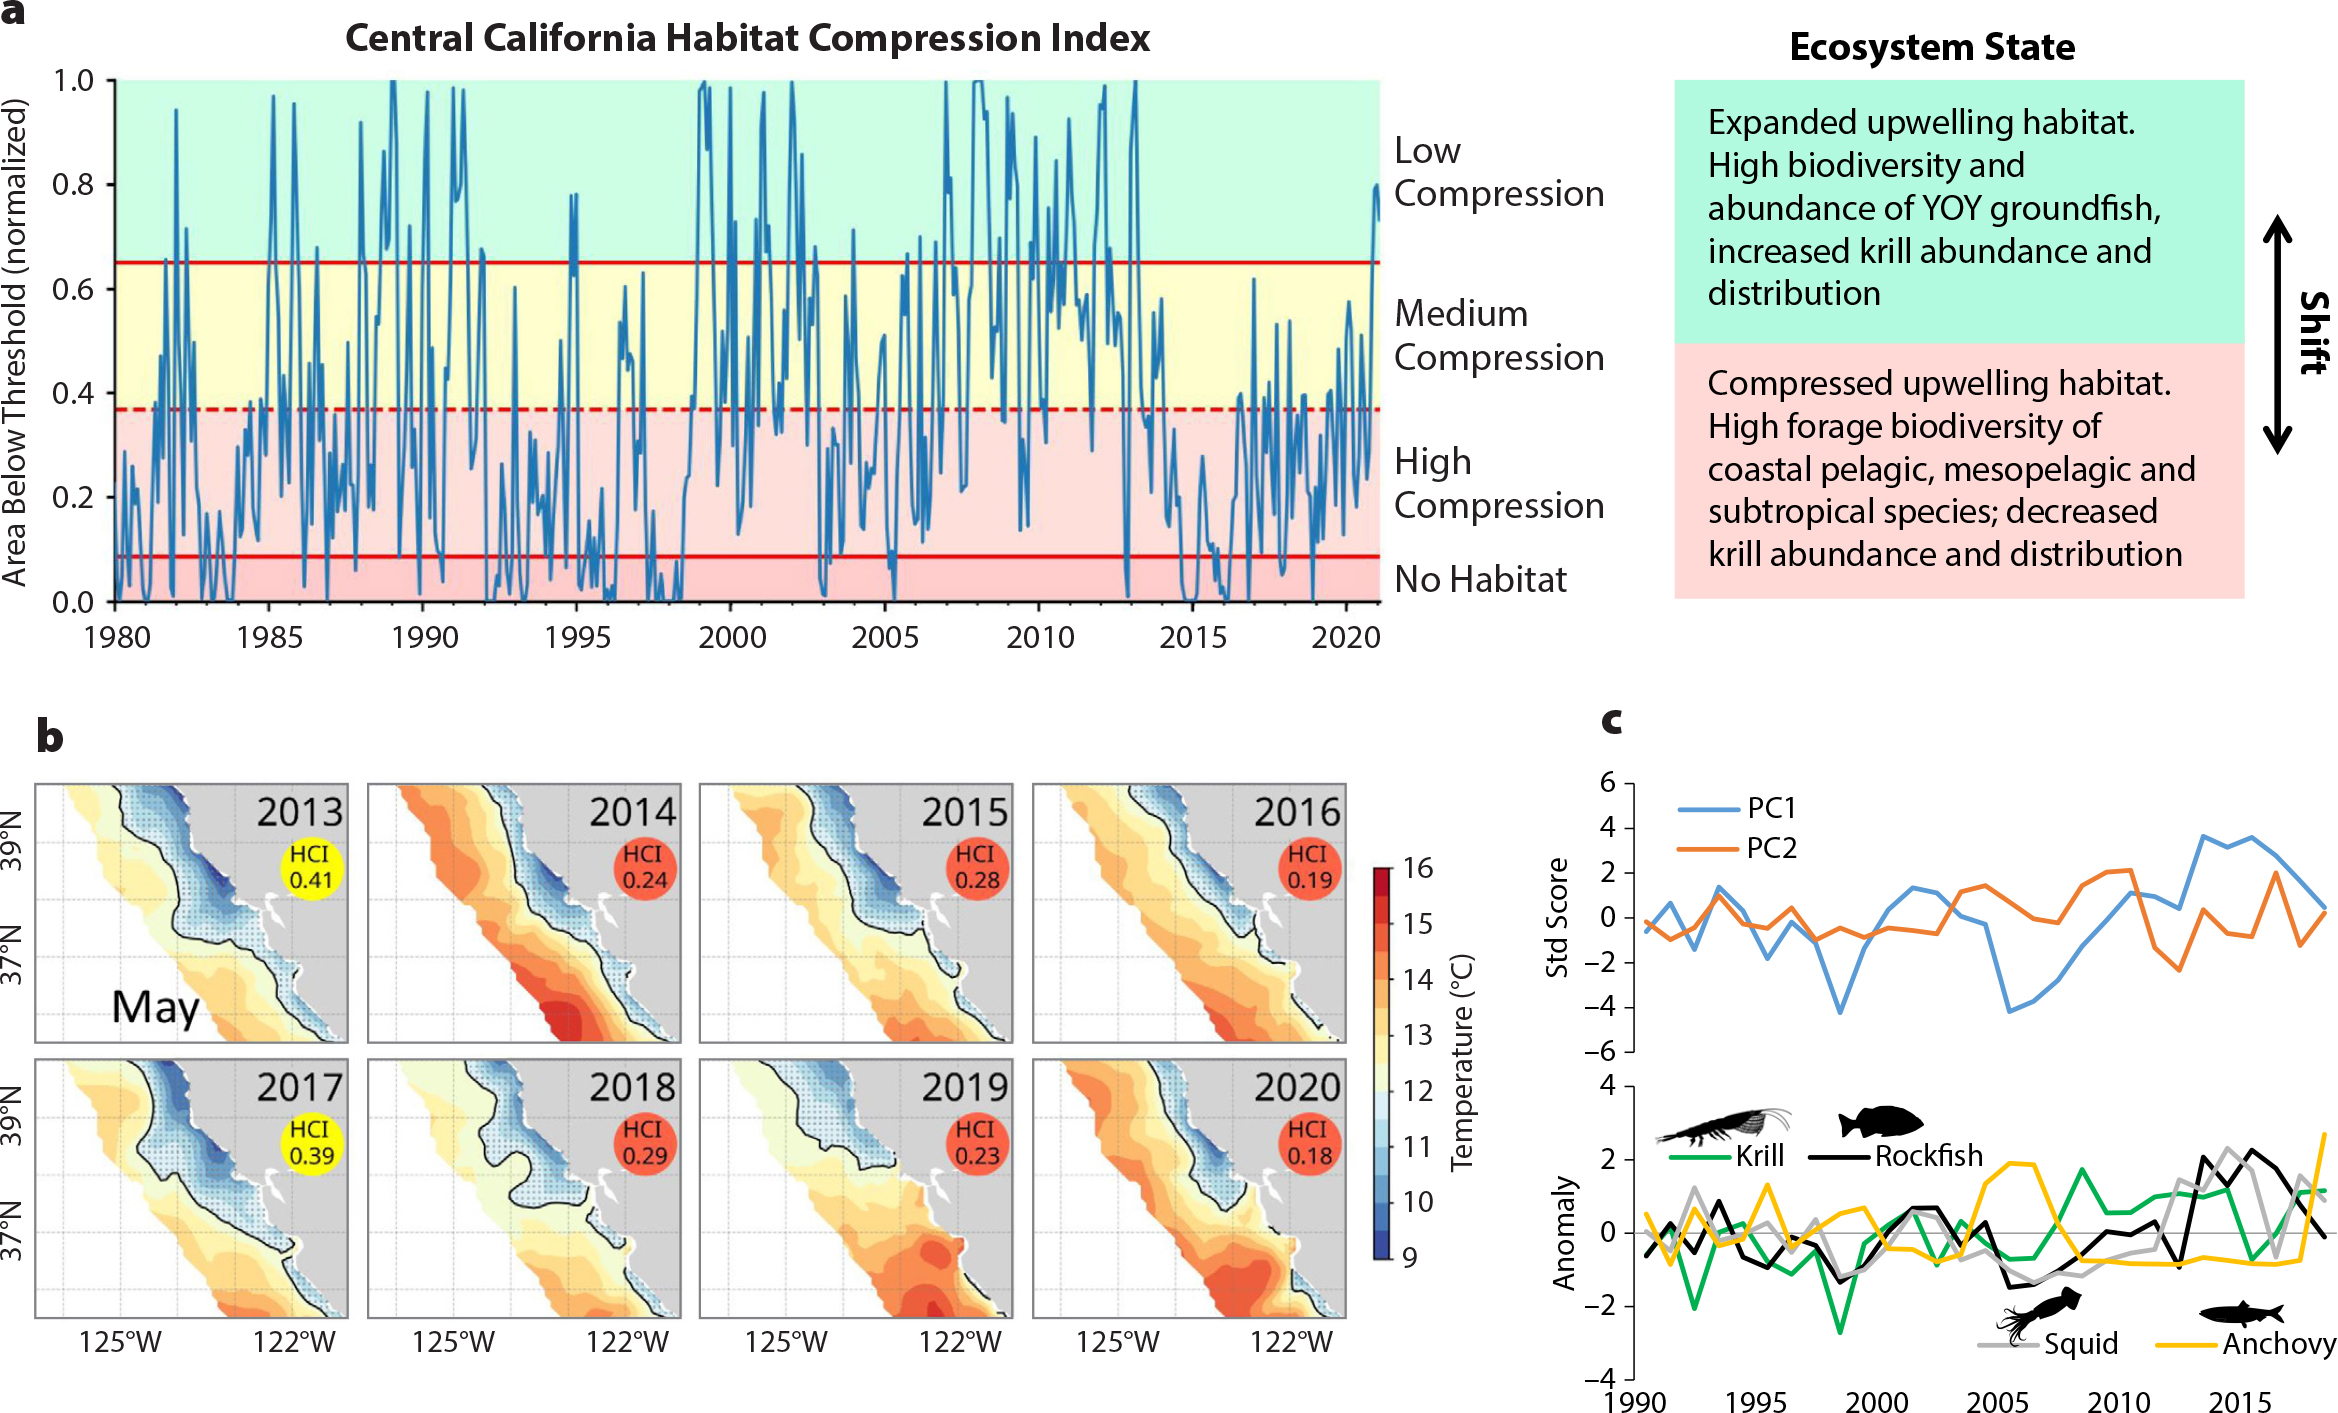
Figure 4. (a) Habitat Compression Index (HCI)—a process-based metric to monitor near-real time changes in pelagic biodiversity and ecosystem state in the central CCE. The HCI tracks the area of cool upwelled water monthly, and generally, during periods of low compression (cooler conditions), ecosystem state reflects higher biodiversity and abundance of coastal organisms, whereas during compressed states (limited cool habitat compressed along the coast), there is a tendency to observe increased occurrence and biodiversity of pelagic species with either offshore or subtropical affinities. (b) Spatial changes in habitat compression during recent large marine heatwaves (2014–2016 and 2019–2020) resulted in major shifts in pelagic ecosystem state and function. Note that similar levels of habitat compression occurred during the 1982–1983 and 1997–1998 ENSO events. (c) (top) Changes in community composition (multivariate index, PC1 and PC2; Ralston et al. 2015) represent different assemblage patterns of micronekton that are used to monitor changes in ecosystem state to inform potential species interactions and trophic transfer. PC1 informs changes in krill and juvenile groundfish assemblages, and PC2 informs changes in coastal and mesopelagic species. > High res figure
|
We evaluated three interrelated ocean-climate processes that may explain variability of pelagic micronekton biodiversity, species assemblages, and overall pelagic ecosystem function: (1) winter upwelling and ecosystem preconditioning, (2) ocean basin source-water variability, and (3) processes impacting upwelling extent (e.g., compression). Atmospheric conditions, such as the area and intensity of the winter North Pacific High, have been shown to influence winter upwelling and a corresponding spring coastal community with higher abundance of krill, juvenile rockfish, sanddabs, and market squid (Schroeder et al., 2013; Wells et al., 2016). The forage richness time series is related to winter and spring ocean surface temperature conditions (Figure 3). YOY rockfish diversity, species abundance, and ultimately recruitment relate to source water variability (Schroeder et al., 2019). Application of source water variability analysis and oxygen declines (Bograd et al., 2008), combined with research on winter upwelling ocean conditions (Schroeder et al., 2013), reveal a connection with variability of source waters in the CCE as environmental driver of juvenile rockfish abundance and recruitment variability (Schroeder et al. 2019). During late winter, when the survey-targeted rockfish species release their young (Ralston et al., 2013), interannual variability of temperature and salinity, or spiciness (kg m–3), at the depth of the 26.0 isopycnal is positively related to trawl catch indices of abundance and diversity. Partitioning years of low and high YOY rockfish abundance and diversity reveals increased input of subarctic waters that coincide with higher rockfish diversity (Figure 3b–c). A hypothesized mechanism is that subarctic water (cooler, fresher water that has more nutrients, also termed “minty” water; small negative spice values) relates to higher dissolved oxygen at the depth ranges occupied by rockfish and other groundfish, improving reproductive output (Schroeder et al., 2019).
Interdecadal variability of North Pacific Ocean temperature and atmospheric regimes, indexed by the Pacific Decadal Oscillation, has long shown that the CCE has regular periods of prolonged cooling and warming. Peterson et al. (2014) showed how variation in copepod biomass reflected warm and cool periods, and their biodiversity data indicated that species were associated with subarctic or subtropical source waters. A similar shift occurs in the forage biodiversity measured by the RREAS, where higher biodiversity is associated with warmer subtropical waters (Figure 3b–d). Shifts in pelagic biodiversity therefore have a spatial footprint and history, and measurement of the spatial extent and area of cooler upwelling habitat can be used as an ecosystem tool to monitor effects of past warming and, more recently, an extended marine heatwave (Santora et al., 2020).
During the large marine heatwave, winter ocean sea surface temperatures were persistently warm and expansive. Upwelling indices off central-northern California in spring 2015 and 2016 were close to average, but a cooler habitat was highly compressed along a narrow coastal band (Figures 3d and 4). The habitat compression index (HCI) is a measure of cooler upwelling habitat area that provides evidence for inferring the impacts of marine heatwaves. An ecosystem shift in which oceanic and pelagic species assemblages converge in coastal waters results when warm water compresses cooler water shoreward (Santora et al., 2017a, 2020). During 2014–2016, throughout the marine food web, persistent harmful algal blooms associated with the marine heatwave led to high levels of domoic acid, which caused major disturbances to upper trophic levels and fisheries (McCabe et al., 2016). The heatwave and persistent habitat compression resulted in distribution shifts of oceanic and subtropical species shoreward, a decline in krill abundance, and increased concentration of YOY anchovy (Engraulis mordax) nearshore (Santora et al., 2020). As observed by the RREAS, anchovy abundance was higher during previous warm ocean years (1990s, mid-2000s), with greater concentration over the shelf (Santora et al., 2012, 2014), so it was not a surprise they would potentially increase in abundance. In following years, anchovy abundance continued to surge and expand within the CCE (Thompson et al., 2019). Compression conditions relaxed partially in 2017–2018, but high compression resumed in 2019–2020 in response to new heatwave conditions (Figure 4). However, the extent of the 2019–2020 heatwave was held further offshore due to increased upwelling intensity during the fall and winter, with compression now trending medium to low (Figure 4).
These physical, biodiversity, and ecosystem responses to the 2014–2016 marine heatwave perturbation resulted in major impacts to protected species, fisheries, and fishing communities (McCabe et al., 2016; Santora et al., 2020) and had direct climate and biodiversity impacts on the socioecological function of the CCE. Given that pelagic biodiversity shifts have marked periodic and event-scale dynamics related to ocean-climate conditions, they can be predicted from integrated observations of biodiversity and ecosystem function. Changes in magnitude of variability of pelagic biodiversity should be anticipated (Tittensor et al., 2010), especially if upwelling variability increases and effects of North Pacific Ocean warming occur with greater frequency (Sydeman et al., 2013).
Questions and Recommendations
Do projected increased intensity and variability of upwelling result in more or less stable species composition and/or trophic interactions? What is the potential for biodiversity and ecosystem function to change with increasing climate change and human uses? Future climate change assessments and conservation planning should consider, independently, how biodiversity of YOY groundfish and of coastal pelagic and mesopelagic species may respond to variable source-water and habitat compression conditions in the CCE. Combining assessments of biodiversity and biomass with measurements of fluxes (productivity) may improve understanding of trophic transfer efficiency. We recommend: investment in creating more commonalities among surveys so they may be combined to ensure collection of consistent ecosystem information in order to improve seasonal predictive capabilities; improvement of biodiversity assessments through integrating high-frequency sampling (moorings, gliders); development of spatiotemporal models of pelagic biodiversity using remote sensing and ocean-ecosystem model output to predict and monitor biodiversity patterns; and including time for process-based investigations in annual coastwide surveys to evaluate model performance.
Seascape Variations
Establishing connections among pelagic biodiversity patterns and metrics derived from satellite remote sensing is a research component of MBON. Globally, satellite-derived measurements of physical and biological ocean conditions are integrated using multivariate methods to broadly classify areas of the ocean surface into seascapes (Kavanaugh et al., 2016). Seascapes have been put forth as an efficient biodiversity monitoring tool because they reduce the number of ocean variables and may delineate the boundaries and areas of important dynamic physical processes (e.g., upwelling and primary productivity patterns) that govern the spatial organization of life in a moving ocean. However, seascapes have not been extensively evaluated with biodiversity observations or species assemblage patterns, nor were ecological aspects considered during development of the seascape classification process. How do seascape products relate to RREAS observations?
We evaluated the utility of seascapes (global monthly product at 5 km resolution) to inform pelagic biodiversity conditions and previously identified environmental drivers of ecosystem variability. Within the central CCE, we examined the global seascape product and determined there are three regularly occurring seascapes within our monitoring region, those numbered 12 (“subpolar”), 14 (“blooms and upwelling”), and 21 (“warm and high nutrients”) (Figure 5). Following a similar process and an area-based approach to estimating the HCI, the area of each seascape and its percent coverage during the primary RREAS sampling period (April to May) were estimated for mapping purposes and for evaluating time series with observations. As discussed previously, ocean temperature patterns are primary drivers of forage species richness, so we anticipated correspondence with seascapes relating to temperature and upwelling. Partitioning of the seascape time series into time periods reflecting low and high forage species richness permits comparisons of seascape heterogeneity (Figure 4). The coverage and variability of seascape 12 suggests this seascape may be of lesser importance in spring. Higher forage richness occurs during the lower and higher coverages of seascapes 14 and 21, respectively. The converse relationship and occurrences of seascapes 14 and 21 generally reflect the well-established pattern of warm/weak and cool/strong upwelling years, and they are further established by comparison with the Oceanic Niño Index, the Habitat Compression Index, krill abundance, and forage species richness time series (Figures 3 to 5). Although this is encouraging for monitoring purposes, how biodiversity and species assemblages may be distributed within seascapes is not known. That is, the seascape area does not imply that a particular indicator species or assemblage is present throughout the spatial extent
of the seascape.
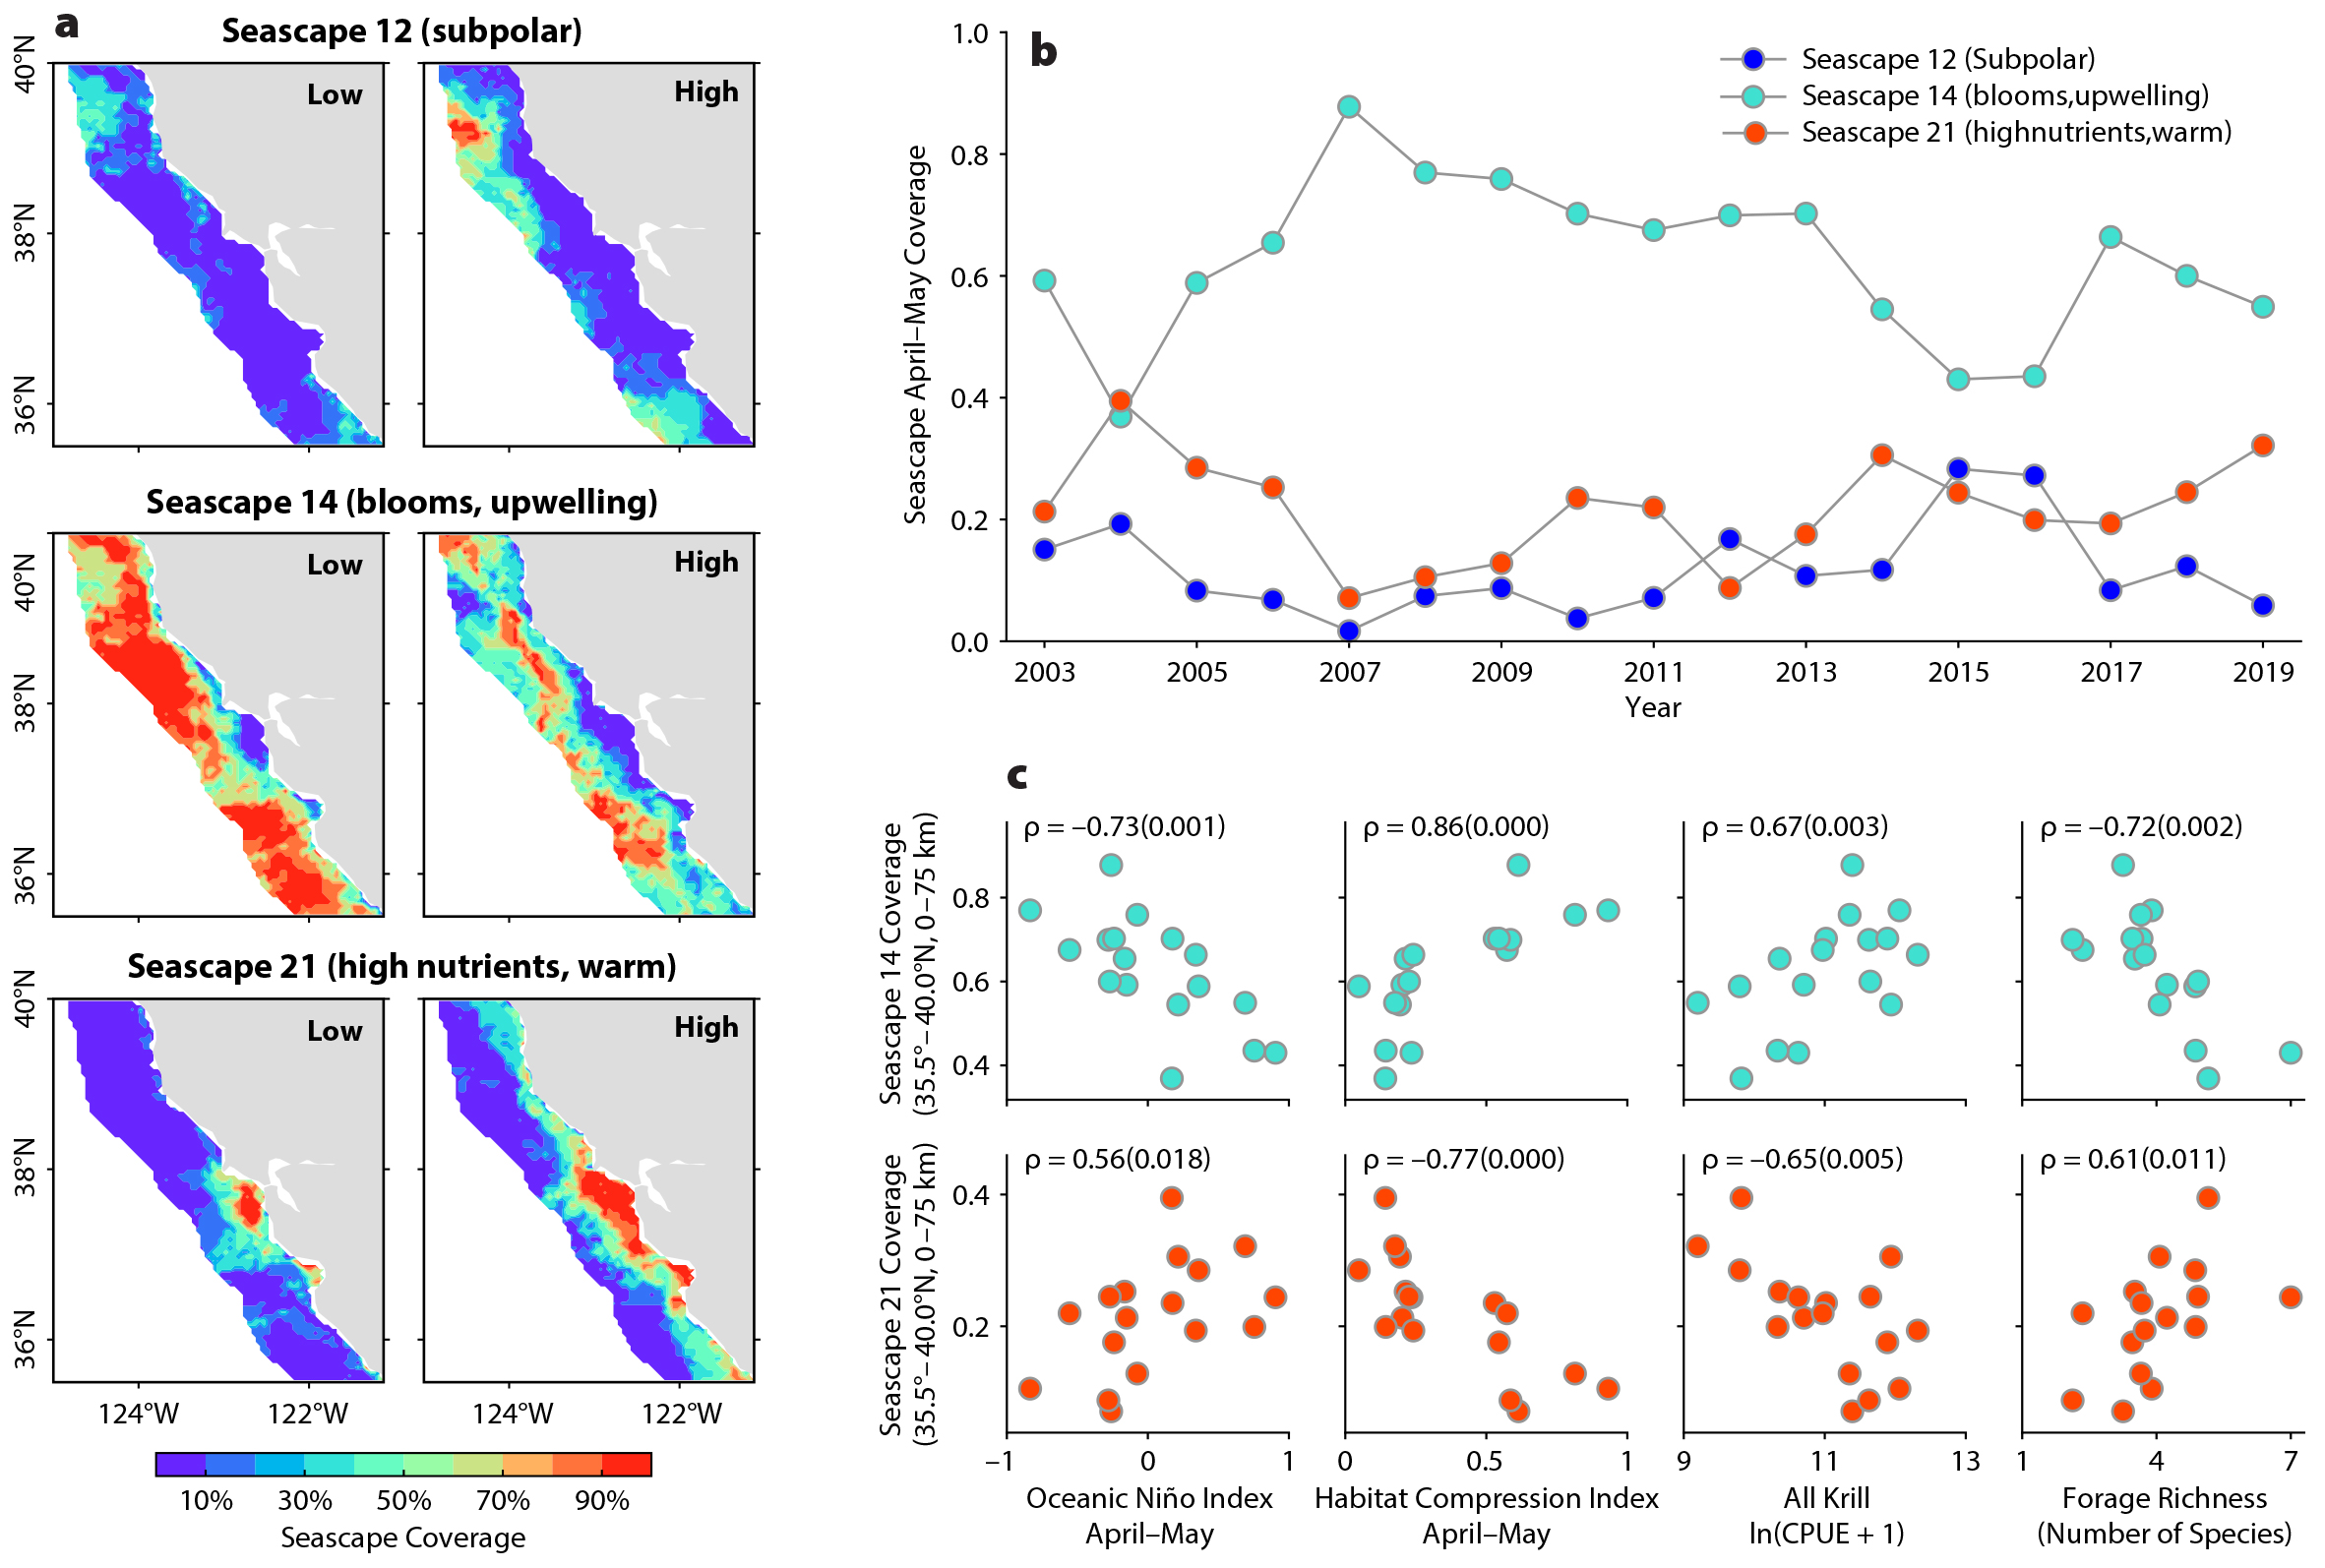
Figure 5. Example of pelagic biodiversity patterns used to evaluate the realism and utility of remotely sensed seascapes. There are currently three predominant recurrent seascapes pertaining to biodiversity conditions monitored by the RREAS: 12 (subpolar), 14 (blooms, upwelling), and 21 (high nutrients, warm). (a) Variation in seascape coverage (% coverage) partitioned by high (2004, 2015, and 2018) and low (2007, 2011, and 2012) forage richness years (see Figure 4). (b) Temporal variability of seascape coverage. (c) Correlation (Spearman’s rho and p-value) between seascapes 14 and 21 coverage, with Oceanic Niño Index (ONI), Habitat Compression Index (HCI), krill abundance, and forage species richness displayed. > High res figure
|
Questions and Recommendations
Can improvements in monitoring biodiversity be made with global seascape products, or are regional seascapes needed? Properties of seascape 14 suggest it may be useful for monitoring ecosystem shifts and changes in pelagic biodiversity, but a regional product might perform better, or perhaps relate to biodiversity hotspots. We recommend Sanctuary Condition Reports and that the MBON track aspects of seascape 14, potentially as an early warning indicator of possible biodiversity shifts. Finer-scale variability is likely within seascape 14, and effort should be made to resolve features within this seascape to assess its utility for predicting the distribution of organisms and fished resources. Improvements in seascape applications could be derived from data-assimilative regional oceanographic models (i.e., ROMS) that are linked to biogeochemical models in order to classify additional seascapes and potentially inform greater vertical and horizontal structure.
From the Top
Micronekton diversity begets upper trophic level diversity, so it follows that the diverse pelagic micronekton communities of the CCE support a diversity of top predator species with specialized niches (Figure 2). The RREAS has a long-term record of visual surveys of predators and takes an integrated approach to understanding connections between forage fish species (rockfish, anchovy, krill) and the seabird populations, diets, and reproduction on the Farallon Islands (Figure 1). RREAS observations of forage species abundance are closely linked to seabird consumption, reproduction, and population growth data (Field et al., 2010a; Santora et al. 2014; Ainley et al., 2018; Warzybok et al., 2018). However, little work has been done on assessing biodiversity patterns and species assemblages or what ecosystem conditions may drive changes. Systematic identification and enumeration of species in visual surveys provide an excellent resource for spatiotemporal analysis and description of seabird and mammal biodiversity patterns (Figures 2 and 6). The pelagic biodiversity of seabirds and marine mammals in the CCE shows a mix of resident species and seasonal migrant visitors (Ainley and Hyrenbach, 2010; Sydeman et al., 2015). Given the diversity of seabirds and marine mammals and their feeding, reproductive, and migration ecology, we should expect distinct biodiversity patterns related to locations of central-placed breeding species (those that carry resources back to a particular site such as a nest or colony—for example, seabirds and sea lions). Furthermore, seabird and mammal diversity hotspots are collocated within trophic hotspots mediated by coastal upwelling, where nutrients, zooplankton, and forage species are elevated (Santora et al., 2012, 2017b; Hazen et al., 2013). Synthesis of RREAS visual surveys informs knowledge about temporal changes in upper trophic level biodiversity, species assemblage patterns, and the locations of diversity hotspots (Figure 6).
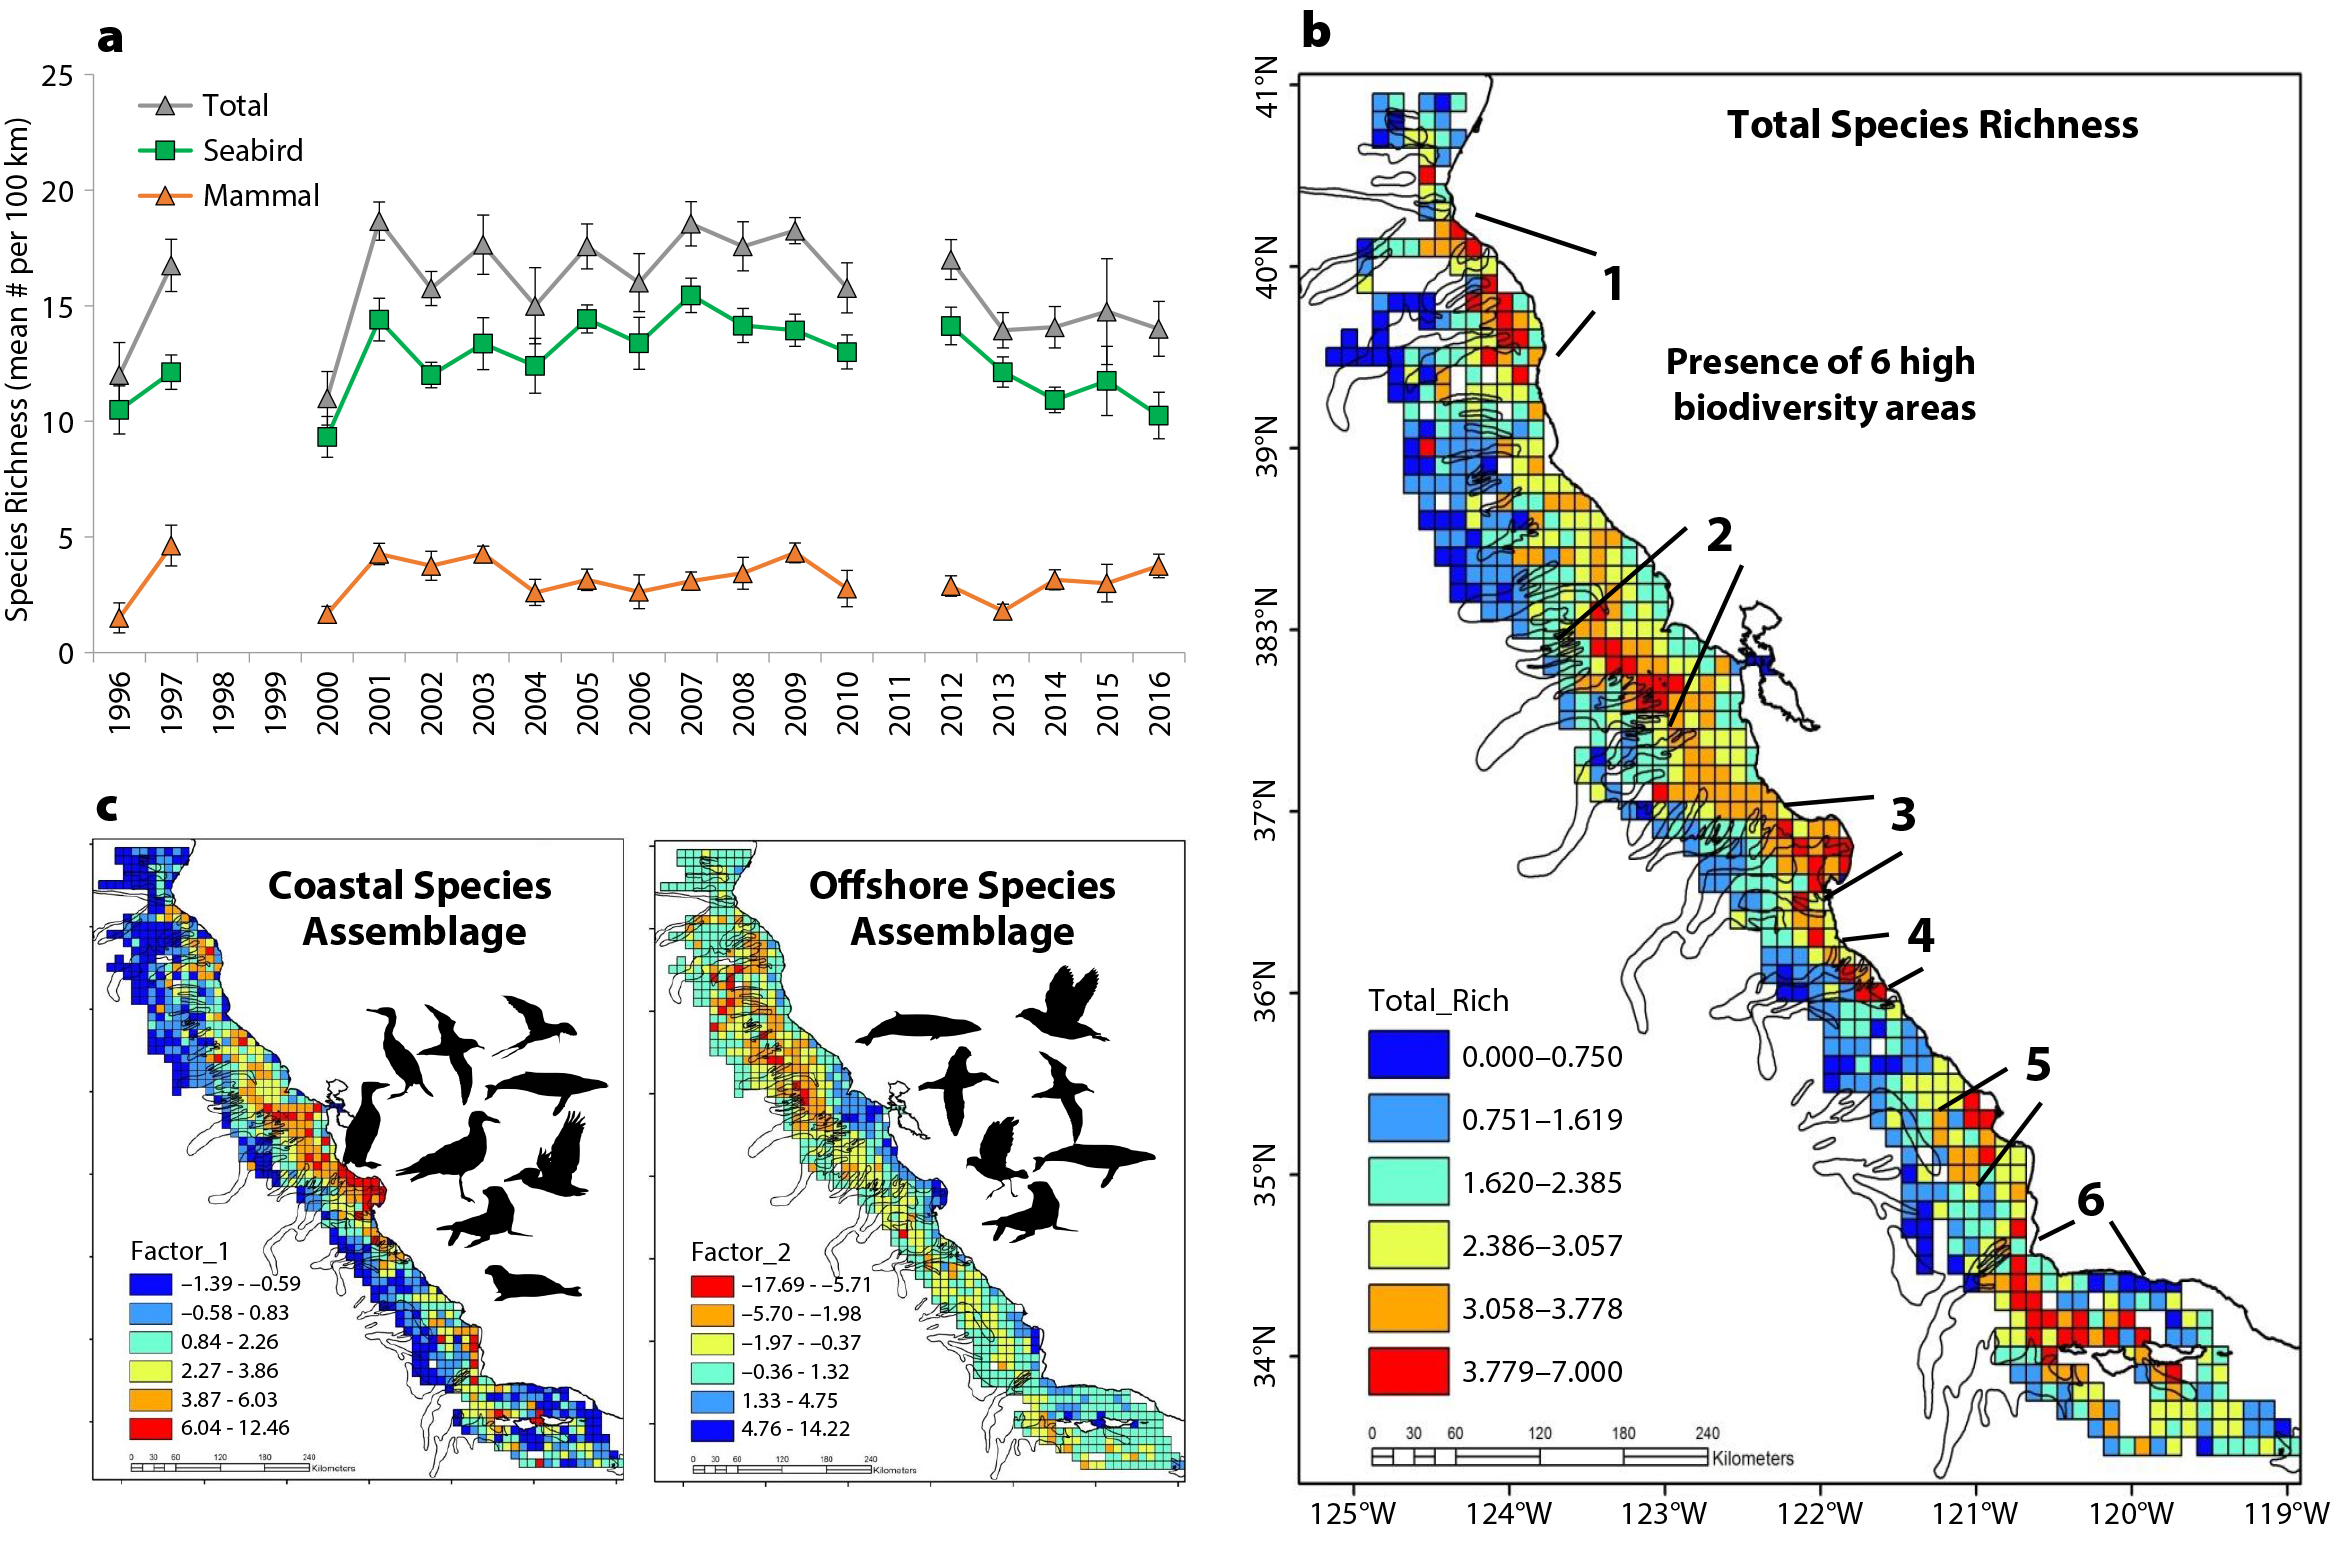
Figure 6. Biodiversity patterns of seabirds and mammals derived from long-term RREAS visual surveys (see Figure 2 for phylogeny). (a) Species richness time series (mean ± SD per 100 km) per total (seabirds and mammals), seabirds, and marine mammals. (b) Spatial mean climatology of total species richness by 100 km2 grid cells indicating presence of several high biodiversity areas, overlaid on submarine canyons. (c) Primary composition (multivariate) patterns of seabirds and marine mammal species reflect two patterns (factor-1 and -2): (left) a coastal species assemblage and (right) an offshore species assemblage (loadings from multivariate analysis). Species silhouettes of certain representative species are shown from the phylogeny. Interannual variability of the distribution of these patterns also reflects onshore and offshore distribution shifts. > High res figure
|
What is the temporal status of seabird and mammal biodiversity in the CCE? Overall, species richness time series show seabirds and mammals to be relatively stable in the central CCE (Figure 6) This likely reflects the consistent survey effort in neritic and oceanic waters within 75 km of the coast, and sampling in waters around a major seabird colony and the productive waters of Monterey Bay as well as upwelling shadows to the north and south (Santora et al., 2012). However, in the southern CCE, species richness of seabirds has declined over the past few decades (Santora and Sydeman, 2015). Do species assemblages reflect coastal and offshore regionalization? A multivariate analysis of the standardized survey effort representing spatial mean abundance of seabird and marine mammal taxa (see phylogeny) indicates an ordination reflecting coastal and offshore species assemblage patterns (Figure 6c). Mapping of species assemblage scores resolves the geographic structure of assemblage patterns and indicates the coastal assemblage extends over the continental shelf, and the offshore assemblage extends over the continental slope and into deeper waters. Coastal species are mostly resident breeding species and a mix of migrant species that feed in coastal waters (e.g., colonial seabirds, sea lions, and baleen whales), whereas the offshore assemblage contains highly migratory species adapted to feeding in open pelagic ocean waters (e.g., albatross, petrels, storm petrels, baleen whales, and toothed cetaceans). These two assemblages are not static but shift dynamically in relation to ocean conditions and perturbations. Distribution shifts, attributed to variation in upwelling strength and source waters (subtropical shift), typically result in the offshore species assemblage moving shoreward, thus bringing them into greater proximity to and overlap with coastal species and human activity (Santora et al., 2020). Therefore, these species assemblage patterns may be considered predator-scapes pertaining to pelagic ecosystem function.
Mapping standardized spatial mean species richness of total seabirds and mammals reveals areas of high biodiversity (Figures 2 and 6). What do high biodiversity areas represent? Top predator biodiversity hotspots are indicative of productive areas of the pelagic ecosystem and can also be considered trophic hotspots, where elevated species interactions may occur in response to biophysical features that act to stimulate, enrich, and concentrate low and mid trophic-level species (Santora et al., 2017b). Overall, the locations of seabird and mammal biodiversity hotspots (six primary regions) identify important colonies and breeding centers as well as known regional and mesoscale variability of ocean conditions within the CCE (Figure 6b). These hotspots are similar to observed and modeled krill hotspots (Santora et al., 2011; Messié and Chavez, 2017; Cimino et al., 2020; Fiechter et al., 2020), and they overlap with large submarine canyon systems, especially those canyons that intersect the continental shelf and terminate close to the coastline (Figures 6 and 7; Santora et al., 2018).
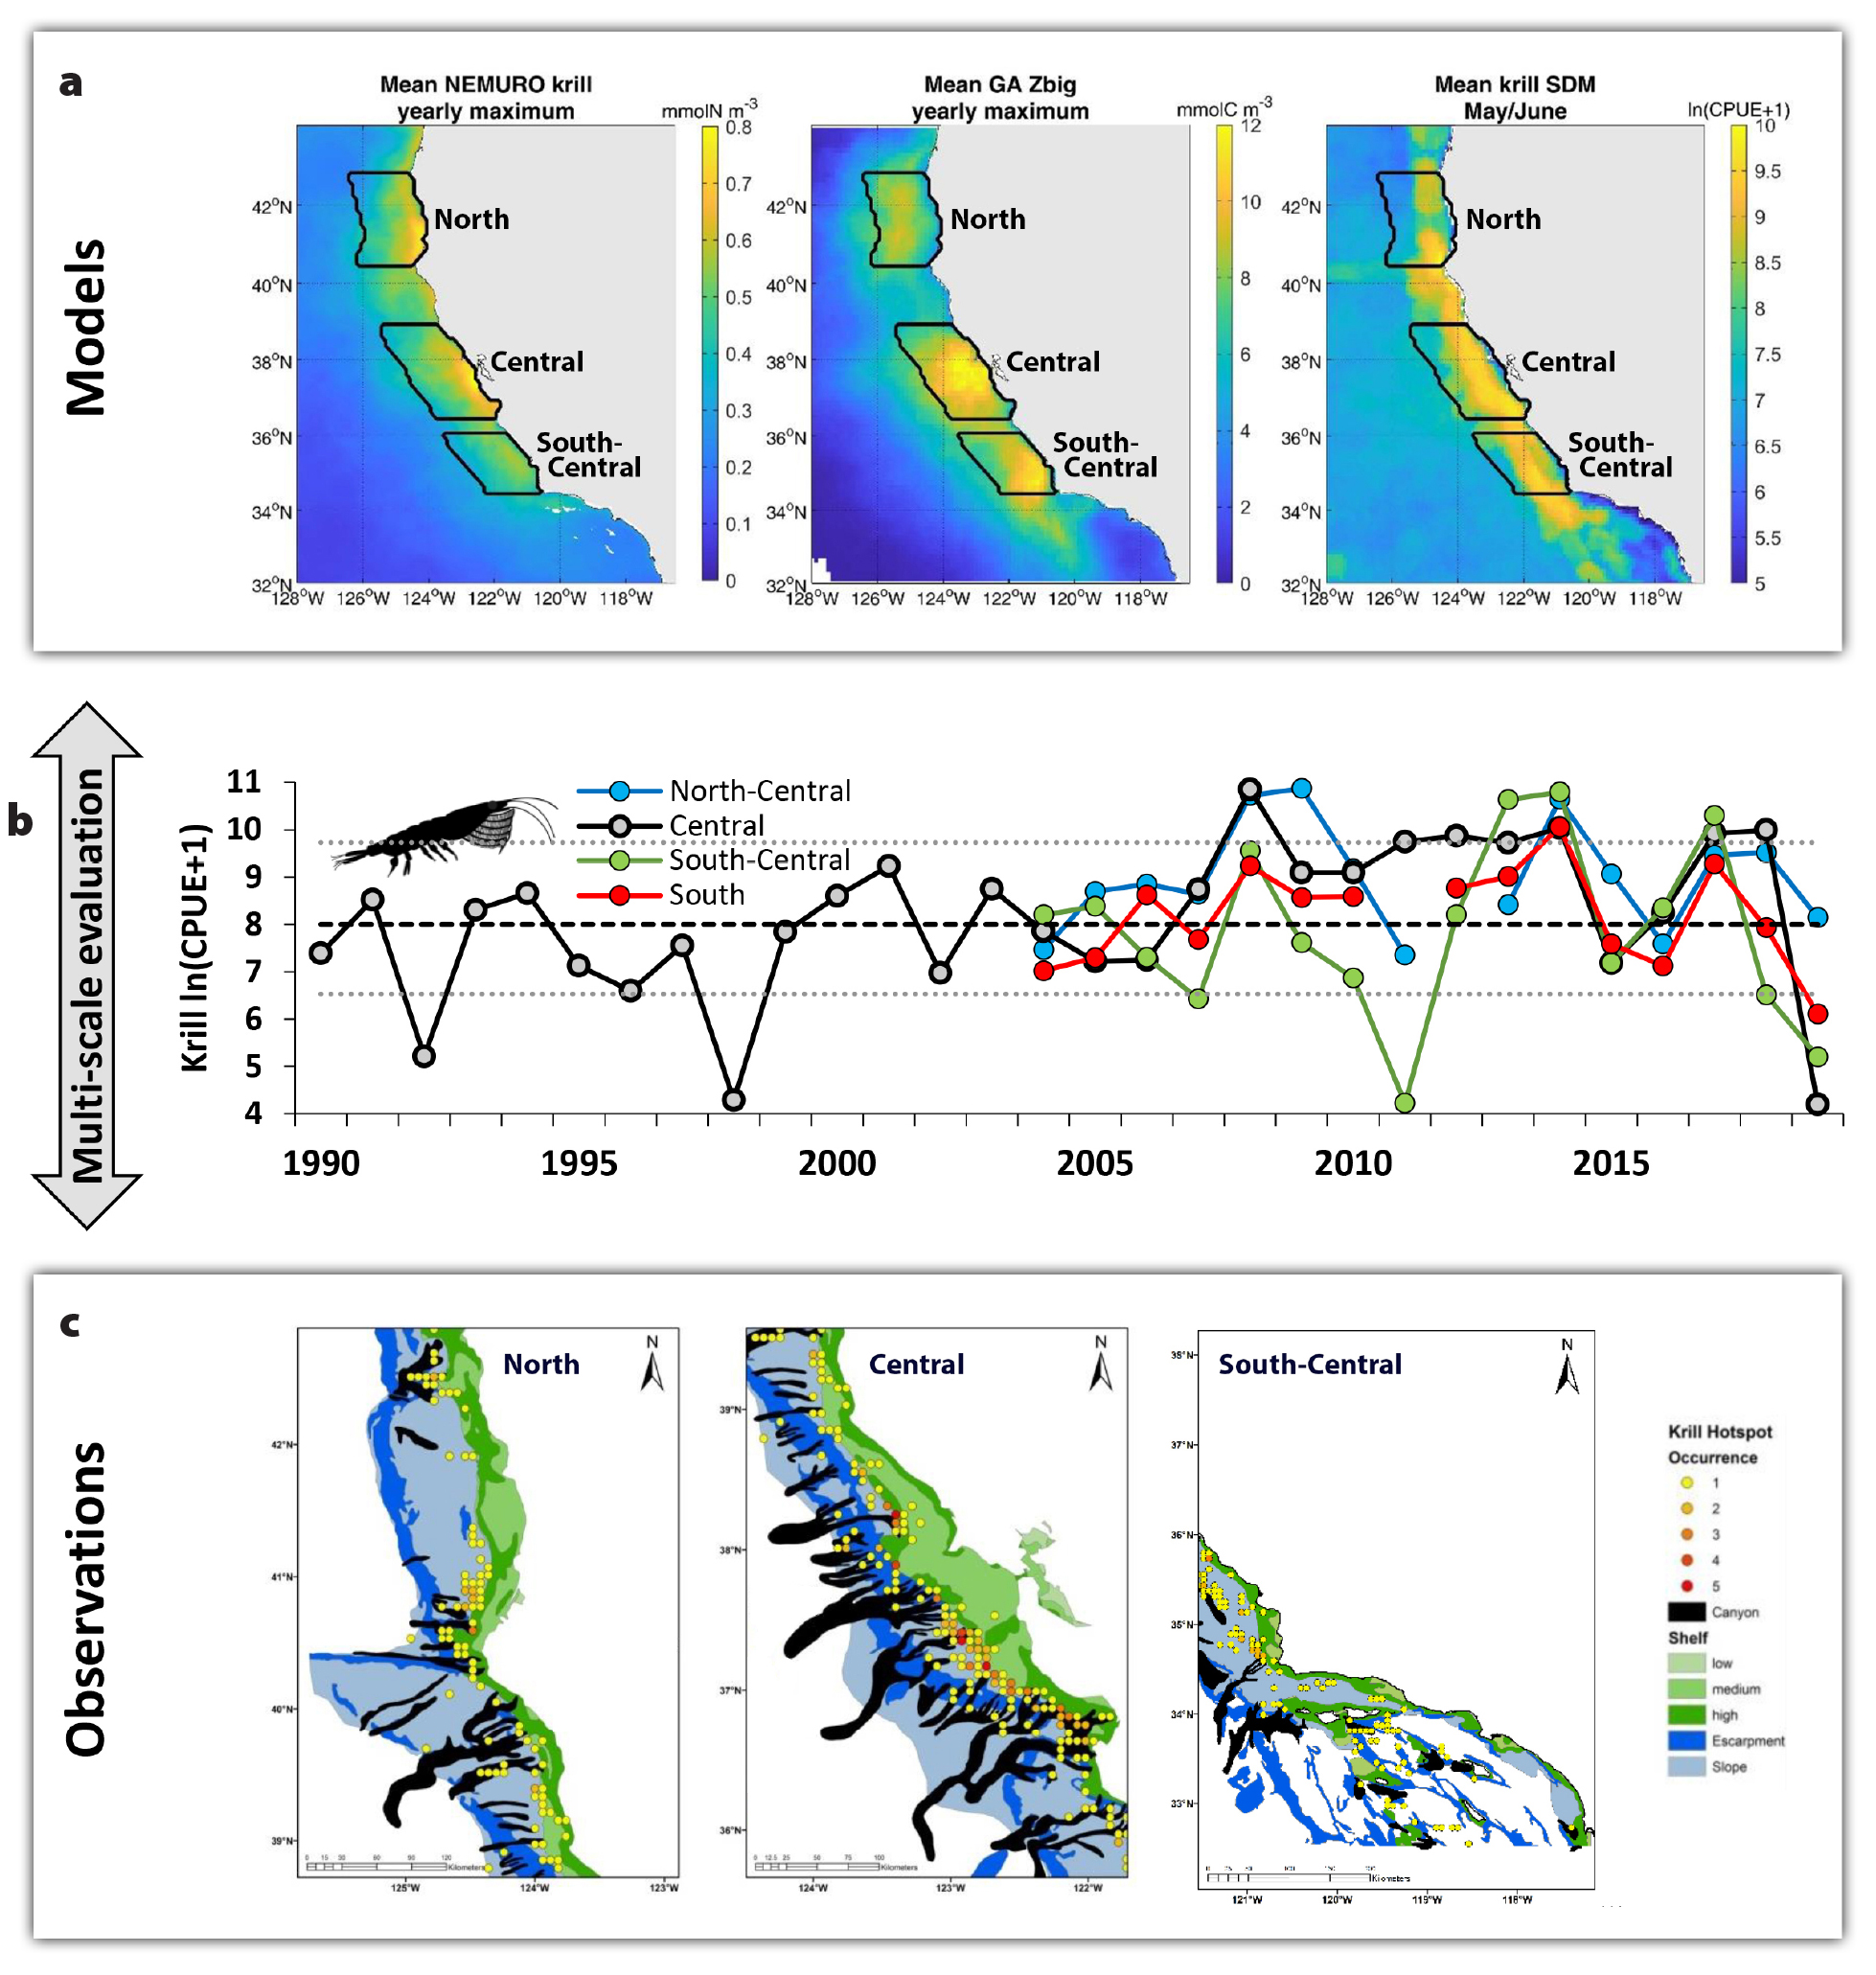
Figure 7. Linking observations and ocean-ecosystem models to understand and predict the location, formation, phenology, and persistence of ecosystem hotspots. (a) Climatological distribution patterns derived from three krill models that were informed by synthesizing RREAS krill observations. (left) NEMURO (North Pacific Ecosystem Model for Understanding Regional Oceanography, an Eulerian, coupled ocean-biogeochemistry-ecosystem model). (middle) Growth-Advection (GA) model (Lagrangian, particle-tracking, coupled satellite and ocean-ecosystem model). (right) SDM (Species Distribution Model, boosted regression trees; trained on RREAS trawl observations, satellites and data-assimilative oceanographic model available in near-real time). (b) Temporal variability of observed krill relative abundance per geographic region. (c) Observations of persistent krill hotspots derived from RREAS acoustic surveys indicate strong regional variability and association with submarine canyons, providing fine-scale information for incorporating influence of benthic-pelagic coupling in ocean-ecosystem models to assess biodiversity hotspots. > High res figure
|
Over much of the past century or more, seabird and mammal populations were severely reduced through exploitation and alteration of their coastal and offshore habitats by humans, as were many groundfish and coastal pelagic species in the CCE (Ainley and Boekheilde, 1990; Ainley et al., 2018). However, successful conservation and ecosystem-based management plans have facilitated recovery of many seabird, pinniped, and whale populations in the CCE over the past 50 years. The increase in predator populations presents new challenges for fishery management, ranging from ensuring forage populations are sustainably harvested to preventing adverse impacts on protected species to mitigating bycatch (DeMaster et al., 2001). However, mutualistic and competitive interactions among predator species may need to be accounted for in climate-ready fishery management plans, as the foraging and reproductive ecology of one species may lead to the success or failure of another. Multispecies foraging aggregations of seabirds and mammals represent an evolved coadaptation involving facilitation of foraging success on high-density aggregations of forage species. For example, mixed flocks of surface-feeding and diving seabirds benefit from feeding behavior of predatory fishes (e.g., tunas, salmon), seals, and whales that concentrate prey near the surface. Therefore, conservation planning for seabirds, mammals, and predatory fishes should account for their diversity and community organizations.
Questions and Recommendations
With increasing climate change and the likelihood of poleward range shifts (Molinas et al., 2015), how will biodiversity of top predators change? It is unlikely that major breeding colonies will shift, so populations of resident species may experience strong effects involving increased climate variability and prey availability during critical reproductive periods. Migratory species may shift the timing of their stopovers within the CCE or concentrate in fewer suitable locations, leading to shifts in marine resource use and potentially greater interaction with human activity. Synoptic eDNA sampling and visual surveys of predators is promising for biodiversity assessments of top predators. Recommendations for further research include: (1) explore the mechanisms underlying shifts of species assemblages from offshore to coastal waters and their interactive effects on trophodynamics, (2) study mutualism and facilitation of multispecies feeding aggregations, (3) measure resource use (energy development, fishing activity) and other human disturbances (shipping, tourism) within biodiversity hotspots, and (4) apply predator biodiversity hotspot distribution to inform design and performance of food web models (shuffle and shift species assemblages), spatial realism of coupled ocean-ecosystem models, and strategic conservation planning.
Analog and Digital Ecosystem Hotspots
Enrichment, concentration, and retention are the key biophysical upwelling processes that drive the location, formation, and persistence of trophic hotspots (Santora et al., 2017b). Due to their density, energy concentration, and tendency to form dense aggregations, euphausiids (krill) are a critical food web species in the CCE where they have a broad reach in the marine food web. They help fuel the production of mid and upper trophic levels of the pelagic upwelling ecosystem, sustaining forage fish, seabirds, baleen whales, and important fished species such as hake, squid, salmon, and groundfish (Field et al., 2006). Krill hotspots, persistent areas of varying intensity and abundance, are therefore a fundamental unit of pelagic ecosystem functionality and spatial organization of trophic interactions (Santora et al., 2017c). Put simply, krill hotspots often result in biodiversity hotspots due to the vast trophic connections that they support. Although there is a ban on fishing krill commercially (PFMC, 2008), observations and models of krill dynamics provide context for the management of other fisheries and for strategic ecosystem advice regarding both harvested and protected species that depend on krill.
Our krill observing and modeling efforts are directed at resolving population dynamics and ecosystem structure, function, and trophodynamics, and at quantifying environmental drivers of the phenology, formation, and persistence of krill hotspots. Krill species abundance metrics derived from midwater trawls provide a temporal observation record, and acoustic surveys have quantified the spatial organization of krill hotspots and their environmental and habitat associations (Figure 7; Santora et al., 2011, 2012, 2018). Krill abundance relates to basin-scale ocean climate conditions (El Niño-Southern Oscillation, Pacific Decadal Oscillation) and annual upwelling strength (Santora et al., 2014; Schroeder et al., 2014; Ralston et al., 2015). The mesoscale distribution of abundance hotspots is disassociated from strong upwelling centers; the hotspots occur regionally within productive upwelling shadows where retentive processes result in high nutrient concentrations (Santora et al. 2011, 2017b). Temporally, krill abundance within shelf waters displays a low-frequency (interdecadal) signal that is attributed to coastal upwelling and climate conditions that impact populations of Thysanoessa spinifera, whereas abundance of Euphausia pacifica in offshore waters is comparatively stable through time but declines steeply during warming periods (Santora et al., 2014; Schroeder et al., 2014). During warming events, thermal refugia, such as coastal upwelling shadows and submarine canyon systems, may support striking changes in aggregation intensity of krill and predator populations in nearshore habitats (Santora et al., 2020).
The diverse spatiotemporal observation record is a resource for parameterizing and evaluating models that simulate krill population dynamics and distribution (Figure 7). For example, observed krill spatiotemporal dynamics have been used to evaluate the performance of mechanistic coupled ocean-ecosystem models (Santora et al., 2013; Fiechter et al., 2020), Lagrangian individual-based models (particle-tracking models that incorporate diel vertical migration behavior to simulate krill swarms; Dorman et al., 2015; Santora et al., 2017c), and Lagrangian growth and advection models (Messié and Chavez, 2017); they have also been employed to train krill species distribution models (SDMs) built on hydrographic model output and satellite metrics (Cimino et al., 2020). All krill ecosystem models capture the seasonal cycle and resolve the location of observed krill hotspots and their dissociation from strong upwelling centers, as well as previously observed temporal variability. Patterns of coherence and disagreement among modeling approaches may be exploited to understand how physical properties translate to ecosystem response. Further, spatial distribution and abundance of top predators have been used to inform the size, spacing, and distribution of predicted krill hotspots to better understand where, when, and how ecosystem hotspots are formed and how trophic interactions may govern their structure and function (Santora et al., 2017c; Cimino et al., 2020; Feichter et al., 2020). Each of these krill modeling approaches has expanded our understanding of pelagic biodiversity and ecosystem dynamics and informed strategic advice for ecosystem-based management.
Questions and Recommendations
How will krill population dynamics, hotspot distributions, and the diverse pelagic communities they support respond to increased climate variability and change? How do biodiversity and species assemblages vary within krill hotspots as a function of habitat compression? Combining climate projections with multiple krill ecosystem models may be used to explore sensitivities and uncertainties of krill dynamics under different climate change scenarios. Effort is needed to determine the scaling of krill biomass in the CCE, and coordinated observation and modeling efforts can inform biomass estimation and improve survey design and sampling. Future krill and ecosystem modeling of hotspots should account for predation pressure on krill and species interactions. Summarizing predator distribution patterns from visual and tracking studies of krill predators could lead to improvements in modeling krill hotspot formation and persistence. For example, the frequency of occurrence and the sizes of multispecies predator feeding aggregations may inform the scaling of krill hotspots, and behavioral tracking of predators (whales) could illuminate encounter rates of krill patches and predation pressure. Collectively, these metrics would inform spatially explicit estimation of pelagic species consumption patterns and improve food-web model design and implementation.
The Wealth of Pelagic Biodiversity
Ecosystem services derived from eastern boundary upwelling systems, as a function of biodiversity and production of coastal pelagic species, have fueled human population growth for millennia. The sustainable harvest of living marine resources is only possible based on a resilient, healthy, and functioning pelagic ecosystem (Palumbi et al., 2009). From fishery and socioecological perspectives, an index of ecosystem services can be derived from tracking fishery landings and ex-vessel value (the value of the fish when unloaded from a vessel) to estimate spatially explicit values (per fished species habitat) for tons of landed catch and monetary value through time (Miller et al., 2017). However, we don’t have a good historic (and often contemporary) record of discarded catch or incidental bycatch. For the presentation of RREAS biodiversity monitoring and its connection to ecosystem services, we highlight a synthesis of the history of fishery extraction and value (standardized to 2010 US dollars per km2) for the major commercial marine fisheries in California (1930–2005; Miller et al., 2017). We are fortunate to have such information (acknowledging there are caveats and assumptions) in order to draw connections among fished resources, ecosystem function, and pelagic biodiversity (Figure 8).
The RREAS includes monitoring of several commercially important species, such as recruitment patterns of YOY rockfish and other groundfish and the abundance of many coastal pelagic species (anchovy, sardine, and market squid Doryteuthis opalescens) and the status of ocean and food web processes related to salmon survival and recruitment. Data from the survey also provide context for ecosystem changes that help managers understand shifts in the distribution of highly migratory fish species (tunas, billfish, and sharks) and ecosystem changes that impact the Dungeness crab (Cancer magister) fishery (Figure 8). Rapid increases in the range, power, and efficiency of fishing vessels led to rapid commercial exploitation of salmon and coastal pelagic species over 100 years ago and later of groundfish (such as rockfish, flatfish, and fishes such as lingcod Ophiodon elongatus and sablefish Anoplopoma fimbria), while invertebrate fisheries for species such as market squid and Dungeness crab have also sustained fishing communities for generations (Figure 8). Spatially, the value and magnitude of these fisheries have distinctive footprints with regional intensity and habitat effects. A variety of RREAS targeted studies have benefited stock assessment, management, and ultimately ecosystem services of these fisheries (Field et al., 2010b; Wells et al., 2017; Ralston et al. 2018; Santora et al., 2020). With the history of these ecosystem services now spatially quantified (Miller et al., 2017), there is greater potential to derive diversity metrics for fishing activity and its value in order to determine those areas of the ocean that support a variety of fishing opportunities. This in turn could help with efforts to evaluate the extent to which spatial patterns in species diversity may or may not be associated with spatial patterns of extraction and value of ecosystem services.
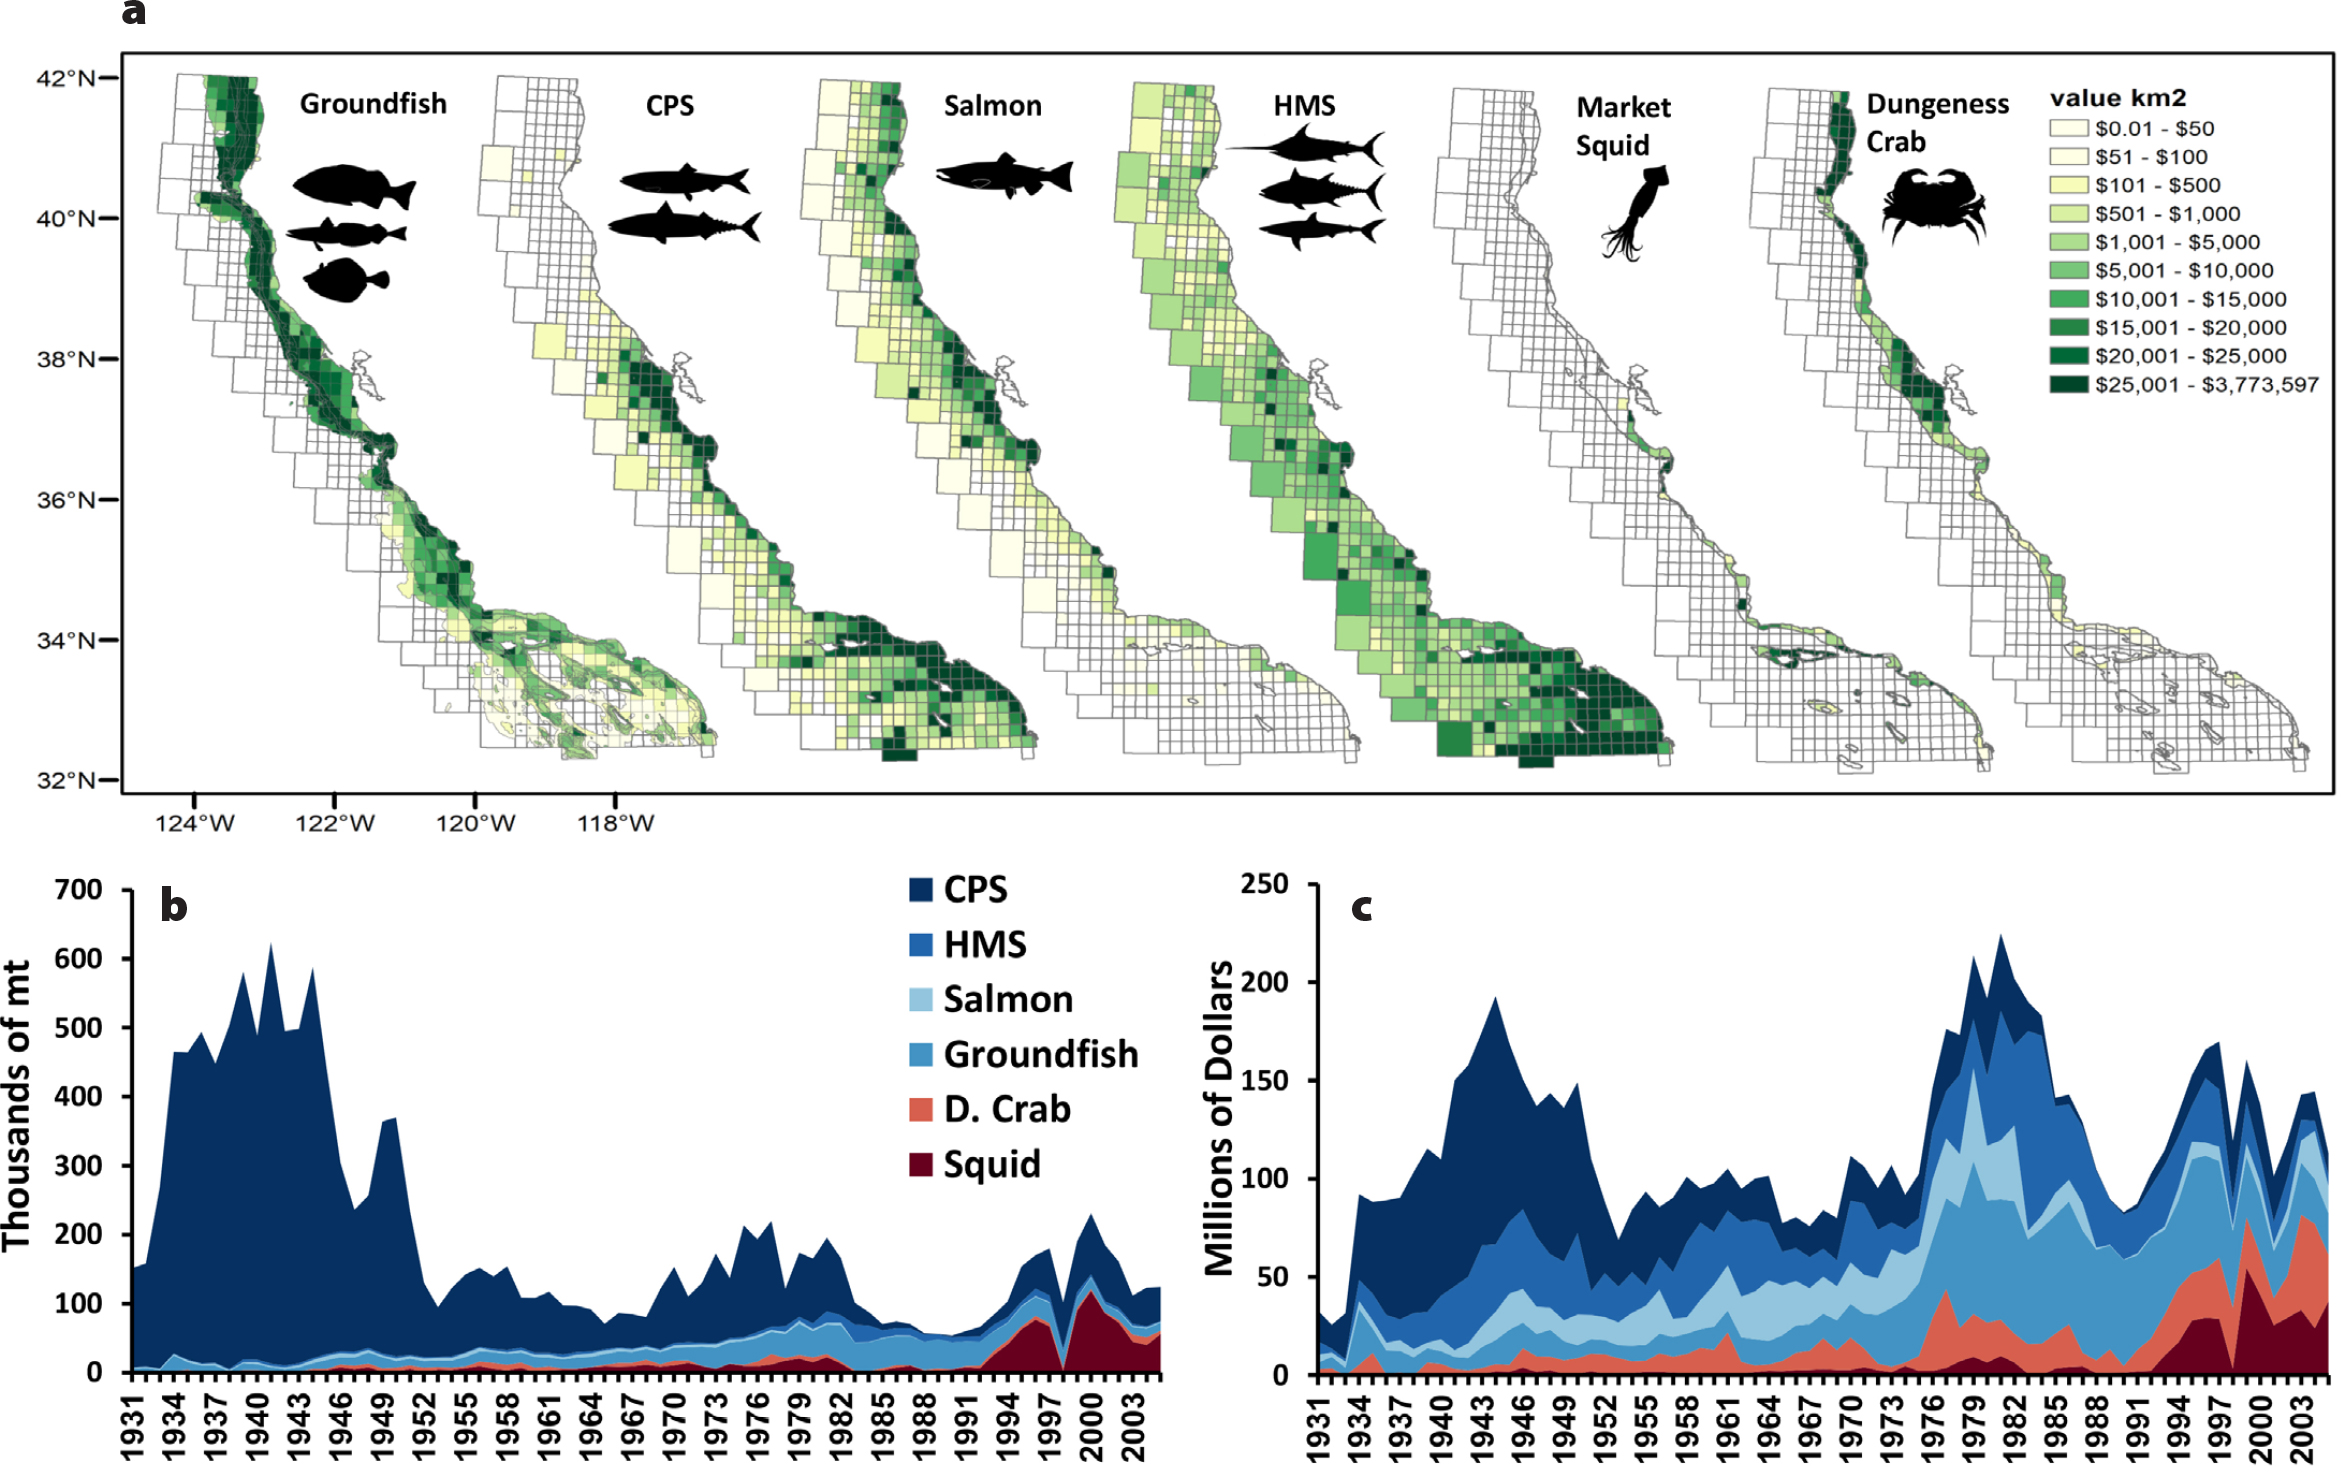
Figure 8. Fishery ecosystem services related to RREAS biodiversity monitoring within the central California Current, 1930–2005. (a) Spatial value (standardized to 2010 US dollar value) of extracted groundfish, coastal pelagic species (CPS), salmon, highly migratory species (HMS), market squid, and Dungeness crab. History of ecosystem services: temporal variability of (b) extracted metric tons, and (c) millions of dollars. The biodiversity of life monitored by the RREAS is directly related to the fisheries targeted (adult stages of groundfish, market squid, CPS), or the variation in the forage community relates to status of target species (salmon, highly migratory species). Additionally, RREAS biodiversity monitoring informs ecosystem conditions for mitigating adverse impacts of trap-based fisheries (Dungeness crab) on protected species (whales). From Miller et al. (2017). > High res figure
|
Ecosystem services, such as those provided by the iconic California salmon fishery, are intrinsically linked to pelagic biodiversity dynamics. Resilience of services may be maintained by monitoring biodiversity and then enacting management strategies when alternate ocean and ecosystem conditions arise. Analysis of micronekton species assemblages benefited the understanding of effects of regional salmon feeding ecology associated with their juvenile survival and return (Wells et al., 2016; Friedman et al., 2018). Recently, Thiamine Deficiency Complex (TDC) was identified as a contributing factor to increased mortality of salmon eggs and fry in hatcheries (this was derived from data on females returning from the ocean), prompting concern regarding marine food web impacts on the health of California salmonid populations (https://www.fisheries.noaa.gov/west-coast/science-data/monitoring-thiamine-deficiency-california-salmon). TDC is a nutritional deficiency of thiamine (vitamin B1) that impacts salmon when their prey are either thiamine deficient or high in thiaminase (an enzyme that breaks down thiamine). TDC is thought to impact survival and productivity of salmonids due to a diet primarily composed of clupeids and forage taxa that accumulate high levels of thiaminase (Balk et al., 2017; Harder et al., 2018). During 2017–2020, the unusually high abundance of anchovy and low abundance of alternative prey may have exacerbated TDC. Historical records and recent observations indicate a narrowing of salmon diet diversity in California over time (Thayer et al., 2014). Therefore, a potential hypothesis regarding prevalence of TDC in California salmon may concern a narrowing of adult food habit diversity, including a persistent high diet of northern anchovy, which are high in thiaminase.
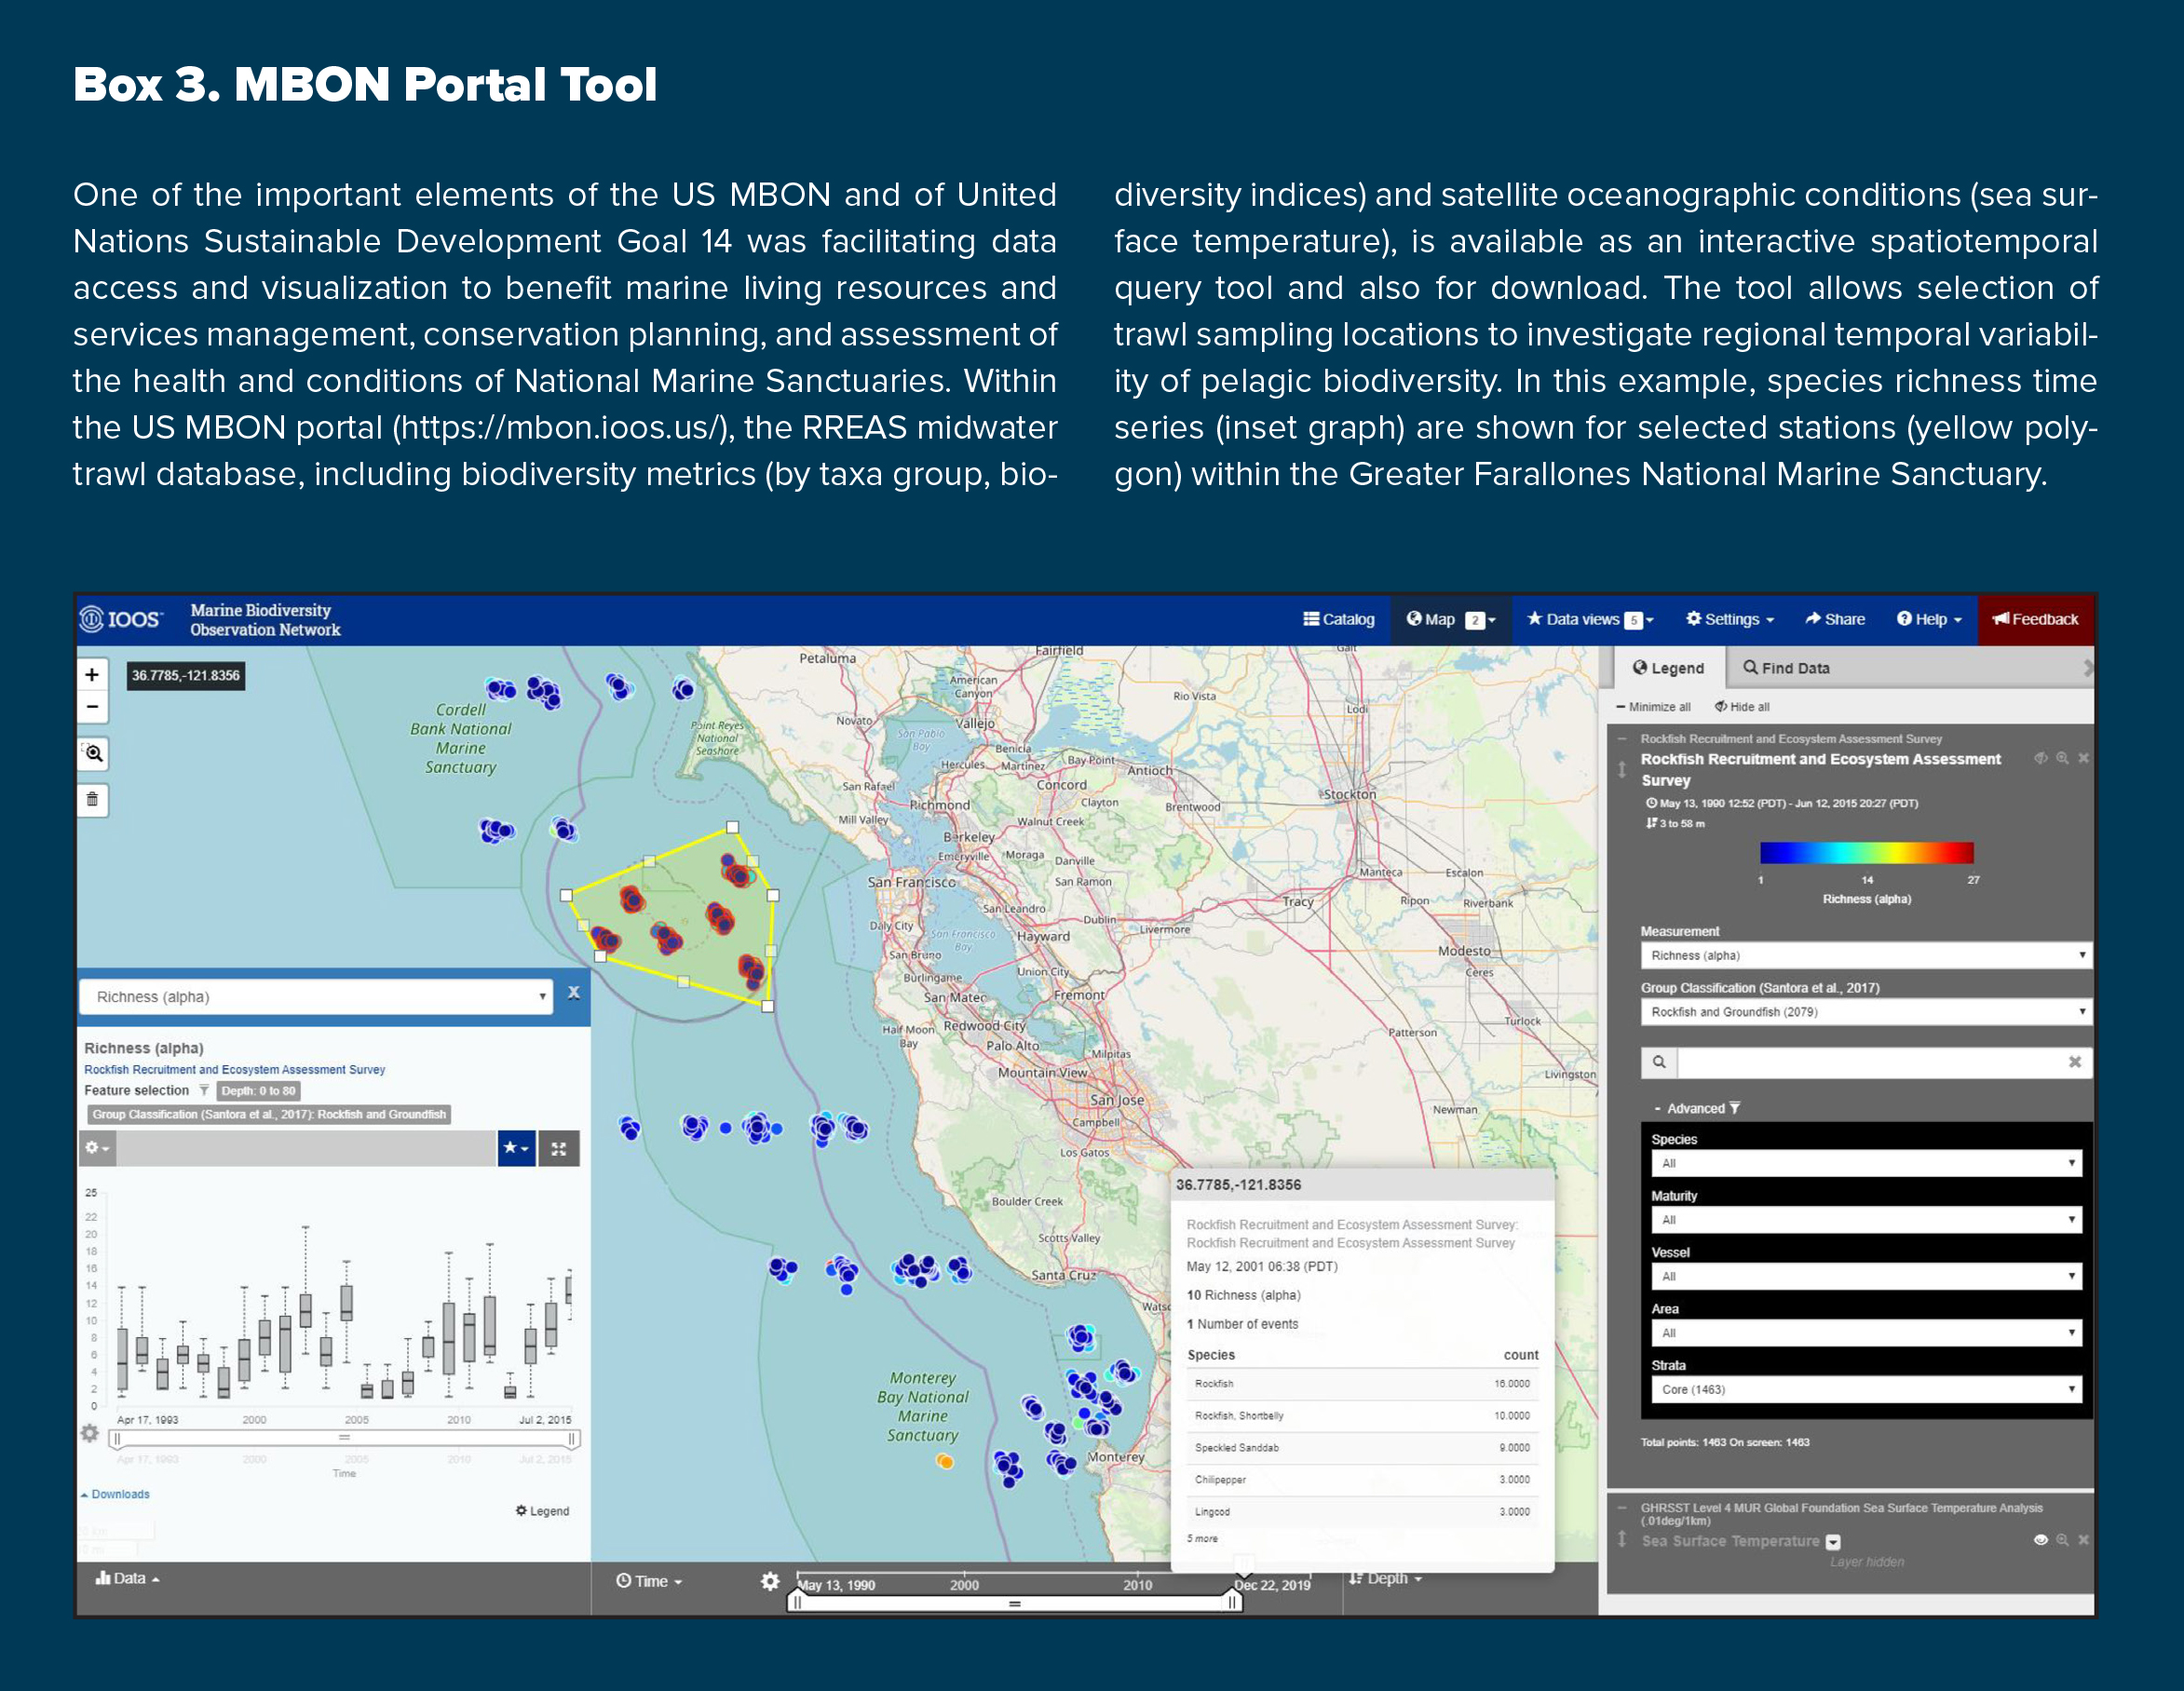
Our integrated ecosystem and biodiversity assessment benefits a broad spectrum of ecosystem management through outreach to a diverse group of stakeholders. RREAS biodiversity indices are currently used to assess the status of several US West Coast National Marine Sanctuaries Condition Reports, and the established baseline and environmental drivers provided a primary example for communicating new management challenges for the United Nations Sustainable Development Goals (SDG-14) program. Within the US MBON portal (see Box 3), RREAS data are available along with custom tools for visualizing changes in pelagic biodiversity. As part of the NOAA California Current Integrated Ecosystem Assessment (CCIEA), RREAS time series are critical ecological integrity indicators that provide context and baselines for strategic advice to the Pacific Fishery Management Council (Harvey et al., 2020).
|
The synthesis of RREAS observations and ecosystem modeling was also instrumental in the development of the California Dungeness Crab Fishing Gear Working Group’s Risk Assessment and Mitigation Program (RAMP), an approach that provides metrics pertaining to habitat compression, climate processes affecting biodiversity, and forage species distribution patterns in order to reduce risk of whale entanglements in fixed-trap gear (Santora et al., 2020). RAMP is composed of commercial fishers, resource managers, environmental organizations, and scientific advisors—a diverse stakeholder group invested in developing solutions to benefit protected species and support fishing communities. Equipped with ecosystem knowledge from the RREAS and research partners, RAMP developed strategies for mitigating whale entanglement risk. To facilitate communication of data and research to stakeholders, the CCIEA set up a website based on RREAS syntheses to share information about and tools for mitigating whale entanglements (https://www.integratedecosystemassessment.noaa.gov/regions/california-current/cc-projects-whale-entanglement). This is an example of how monitoring the status and trends of biodiversity informs ecosystem management of fisheries and protected species as well as habitat conservation planning. Again, no species or ecosystem service can be understood in isolation.
Questions and Recommendations
How will future climate perturbations impact ecosystem services? Can we predict and proactively ameliorate the next human-wildlife conflict in coastal (shelf) waters? What is the history of fishery extractions and value within top predator biodiversity hotspots and other habitat used by protected or endangered species? Are there ecosystem service hotspots that require fine-scale management and protection to ensure stability of fishing communities? How do we incorporate pelagic biodiversity into ecosystem models to examine trade-offs among climate change, species conservation, and increasing demand for ecosystem services? Building partnerships with diverse stakeholders and fishery resource managers facilitates application of ecosystem science to support realistic climate-ready fishery planning. Climate and marine ecosystem functioning projections should account for known modulations of pelagic biodiversity. As we have learned from long-term monitoring, changes in pelagic biodiversity may be anticipated (i.e., cycles, impacts of climate events), and observations that account for shifts in ecosystem productivity and function, such as winter upwelling, source water variability, and habitat compression, are now available in near-real time to anticipate future ecosystem shifts. Rewilding of the CCE is well underway and many seabird and marine mammal populations are growing. As species continue to recover from past exploitation, increasing conflicts between fishing and protected species management should be anticipated.
Coda
A quintet, with skills and practices pertaining to physical and biological oceanography, marine spatial ecology, ecosystem modeling, and fisheries biology and management are the components of our ecosystem oceanography approach, all orchestrated to monitor and address biodiversity-related ecosystem function and services. Each of these components alone requires major focus, investment, and research effort, but it is their integrated synthesis that is needed to overcome the looming challenges that are already being posed by the combined effects of climate change and increasing demand for ocean ecosystem services. Long-term ecosystem and fisheries monitoring surveys will be critical sources of empirical information from which to draw inference and inspiration for developing, refining, and parameterizing models to test what we know, don’t know, or could learn from simulations or additional measurements. Regardless, as part of the US MBON, the RREAS has provided an invaluable baseline of pelagic biodiversity and a framework for investigating ocean climate processes from physical perturbation to ecosystem production and services.
The majority of RREAS observational and sampling techniques (trawls, acoustics, CTD and visual surveys) are now considered traditional methods as compared to satellite remote sensing, molecular techniques (eDNA), or use of autonomous aerial and underwater vehicles (drones and gliders). We should continue to invest in new technology for application to biodiversity and ecosystem monitoring, but extensive comparison and evaluation with traditional methods will be needed, likely indefinitely, as an integrated observing approach is more informative than any one observational data stream alone (McClatchie et al., 2014; Peterson et al., 2014; Chavez et al., 2017). There are no one-size-fits-all approaches and no singular metric for solving the complex climate- and biodiversity-related changes facing pelagic ecosystems. It will require a coordinated effort, building on the past to support the future.
Although we know a lot about the baseline of pelagic biodiversity, we know very little about the vast majority of species interactions or how they may vary as a function of ecosystem state. This is the basis of ecosystem oceanography—to examine environmentally varying trophic and human interactions. Improvements in biodiversity and food web modeling can benefit from incorporating species diet and food habits (Wells et al., 2016) to resolve how ecosystem shifts relate to function and resilience of services. Combining biodiversity and biomass with measurements of energy flux will improve understanding of trophic transfer efficiency. Coupled with climate projections and simulations, we can conduct sensitivity analyses to better understand how biodiversity and trophic transfer efficiency may change in the future. Further, if we can link biodiversity, remote sensing, and species distribution modeling products to derive Ecoscapes—statistical classifications of the ecological community, including biodiversity—we can quantify changes in different habitats that favor key organisms and communities throughout the CCE. That is, we can find the biologically or ecologically meaningful patterns in the ocean first, and then derive associated Ecoscapes to inform construction of more meaningful biodiversity patterns in order to track their variation through space and time. This applies to fishing activity and human disturbances to the pelagic ecosystem as well. Ecoscapes will enable us to target traditional and innovative forms of biological sampling at higher resolution to determine where and why species may be concentrated and how they may shift location in the future.
Two summary questions emerge from this synthesis of pelagic biodiversity observations, modeling, and services: What is the potential for biodiversity and ecosystem function to change with increasing climate change and human uses? Does projected increased intensity and variability of upwelling result in more or less stable species composition and/or trophic interactions? Most likely, increased variance of upwelling and latitudinal shift of upwelling-favorable winds (Bakun et al., 2015), mixed with effects of anthropogenic warming and increased frequency of marine heatwaves, may result in greater instability of coastal food webs and provision of ecosystem services. If apparent cycles of biodiversity of YOY groundfish or forage (coastal and mesopelagic) species communities become less predictable due to increasing frequency of extreme events, then new models accounting for stochastic processes will be needed. To that end, there are still plenty of important inferences yet to be unlocked with the RREAS and other long-term ecosystem monitoring data sets.
The record high diversity observed during the 2014–2016 heatwave was an unexpected surprise that generated research into unifying connections of ecosystem components related to source water variability and evaluation of upwelling habitat compression as processes underlying observed biodiversity and ecosystem shifts. However, we don’t advocate waiting to learn from surprises or basing recommendations regarding ecosystem-based fisheries management or conservation of biodiversity purely on ecological surprises. Surprises mean we may not have been able to foresee these changes to pelagic biodiversity and ecosystem function, and we should be mindful that climate change will increase recurrence of similar surprises. A diverse integrated ecosystem approach that incorporates a framework of ecosystem oceanography should result in fewer surprises. Don’t wait to learn from surprises, but do keep an eye out for new signals from biodiversity to improve ecosystem predictions. We now have a greater capacity for marine ecosystem monitoring, with new methods allowing greater resolution than ever before, but it still needs to be integrated, modeled, and evaluated, and communicated effectively.
Acknowledgments
We acknowledge and thank the many institutions that have invested in supporting and maintaining long-term ecosystem monitoring. Support for this synthesis was in part provided by the US Marine Biodiversity Observation Network, jointly funded by NOAA, NASA, and the National Oceanographic Partnership Program (80NSSC20M0001), and the Interdisciplinary Science NASA ROSES Program Life in a Moving Ocean (80NSSC17K0574).