Full Text
Since the advent of industrial manufacturing of petroleum-based plastics, their use in everyday products has become ubiquitous due to their durability, moldability, low weight, and affordability. Consequently, plastics have quickly become one of the largest components of solid waste pollution on the planet and can now be found in marine sediment, coastal waters, surface waters of oceanic gyres, and marine organisms. However, the extent of this problem has yet to be fully understood, in part due to the challenges associated with discrete water sampling in the vast global ocean. Optical detection of microplastics is one promising approach with the potential to circumnavigate the temporal and spatial limitations of discrete water sampling, though methodological techniques are still in their infancy and libraries of inherent optical properties (IOPs) of microplastics are sparse.
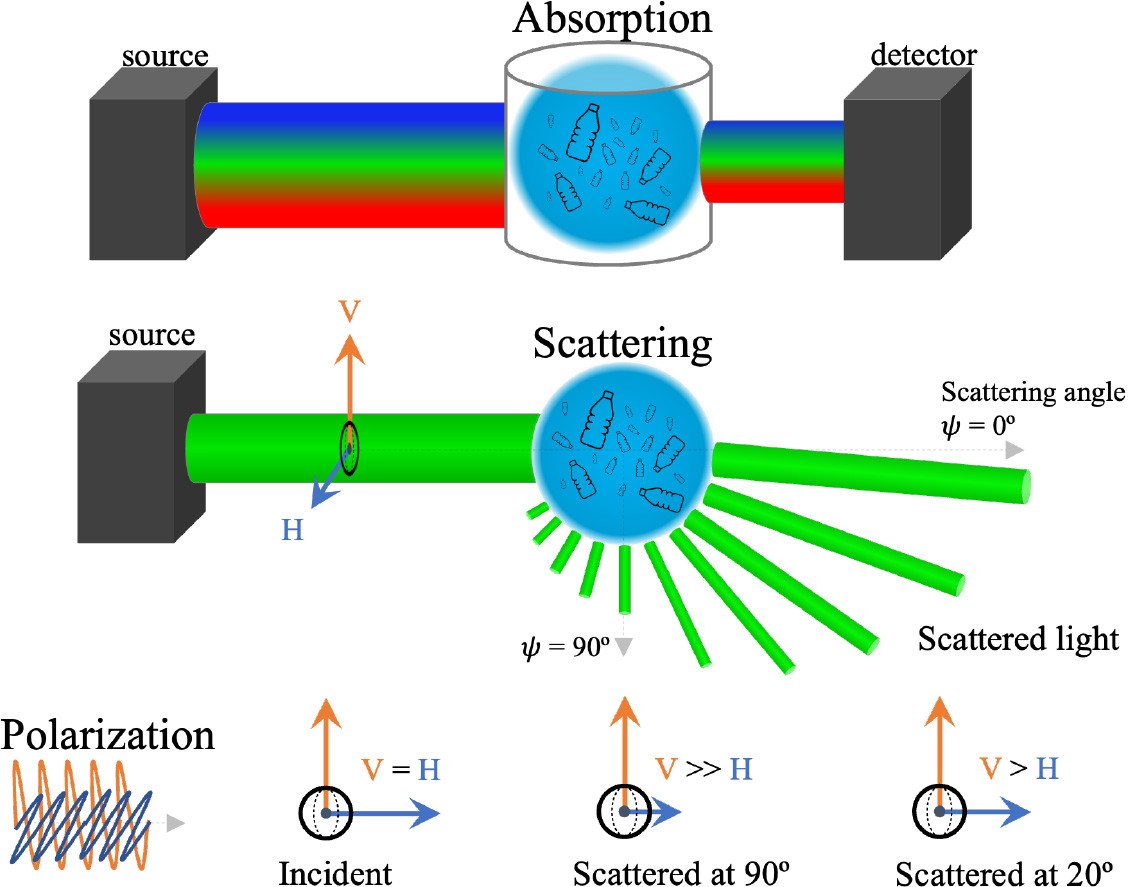
The IOPs of any particle suspended in seawater describe the amount of absorption (loss) and scattering (redirection) of light per unit distance. Scattering events also involve changes in the polarization state of light, which describes the orientation of electromagnetic field oscillations. These optical properties are functions of material properties such as particle concentration, size, shape, and composition. Measurements of the IOPs are key to unlocking the potential for remote detection of any specific particle type from satellite or above-water observations. Furthermore, knowledge of the IOPs is useful for interpreting underwater measurements that are not accessible by above-water observations but that can be collected by profiling or autonomous platforms surveying subsurface waters.
The current state of our understanding of the abundance and distribution of marine plastic pollution using above-water optical measurements is limited to positively buoyant macroplastics (Hu, 2021; Zhou et al., 2021) that are large enough to be detected by satellite sensors or other above-water observations. However, marine microplastics are of particular concern given their higher concentrations and strong potential for bioaccumulation through ingestion by smaller organisms near the bottom of marine food webs. Microplastics are typically defined as >1 µm and <5 mm in size; however, the microplastics that can be ingested by zooplankton and other small filter feeders are typically missed by the standard 333 µm sampling mesh used in many field studies (Cole et al., 2013; Brandon et al., 2020). Because detection and quantification of small phytoplankton from optical observations is possible, it is reasonable to believe that microplastics can be detectable as well, despite challenges related to concentration and particle variability. If we are to overcome these challenges, we need to advance our knowledge of the IOPs of microplastics.
We have begun to address this knowledge gap by making a comprehensive suite of optical measurements on virgin microplastic samples (Figure 1). These measurements can be utilized to identify optical fingerprints of microplastics and aid in the development of detection approaches. We present some results from this research, including measurements of six microplastic samples. These include four samples generated from industrial-grade sheets of commonly utilized plastic (i.e., glycol-modified polyethylene terephthalate [PETG], polystyrene [PS], polyvinyl chloride [PVC], and polypropylene [PP]), and two samples of other common plastic pollutants derived from washing of synthetic fabrics and clothing (i.e., dryer lint [DL] and polyester fibers [PEF]).
|
|
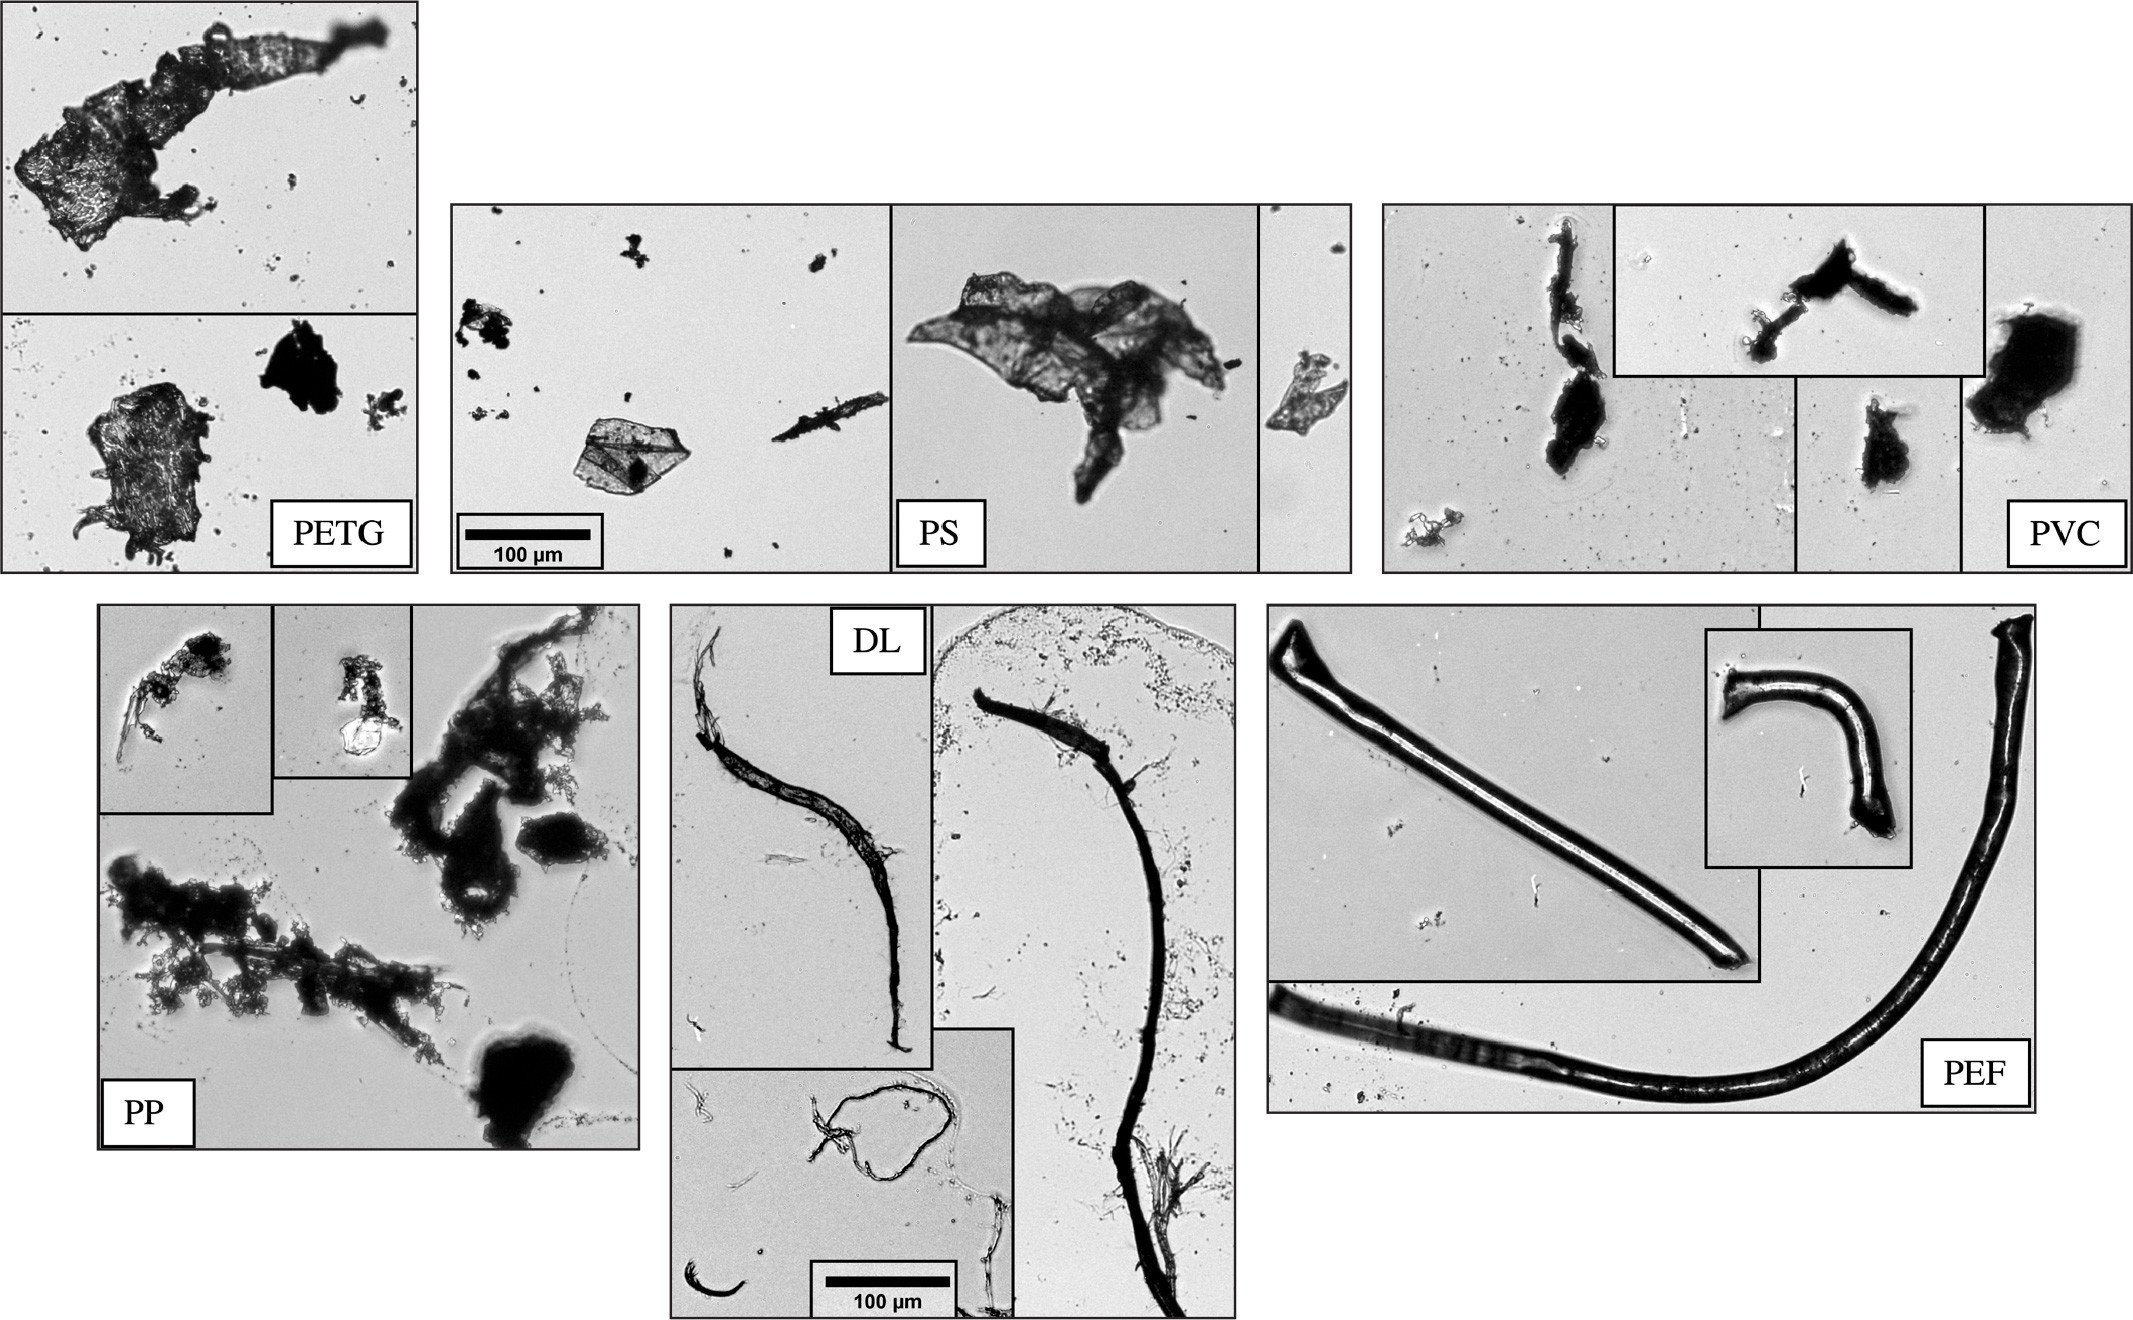
To generate a size-spectrum of relatively small microplastic particles that generally remain suspended in water, the original samples were shaved into small pieces and blended using a typical kitchen blender with ice cubes made from deionized and 0.2 µm filtered water. The blended and concentrated samples were then further subsampled for optical characterization. Figure 2 shows example images of particles from the six plastic samples. These microplastic samples contained particles of many sizes and irregular shapes, with some notable differences between plastic types. The particles generated from the sheet-based samples are irregularly shaped with lots of rough edges. The PS particles have some unique dimensionality with visible folding, while PETG, PP, and PVC appear more solid and rigid. The DL particles tend to have fibers with rough surfaces, while PEF have soft and round edges (Figure 2).
|
|
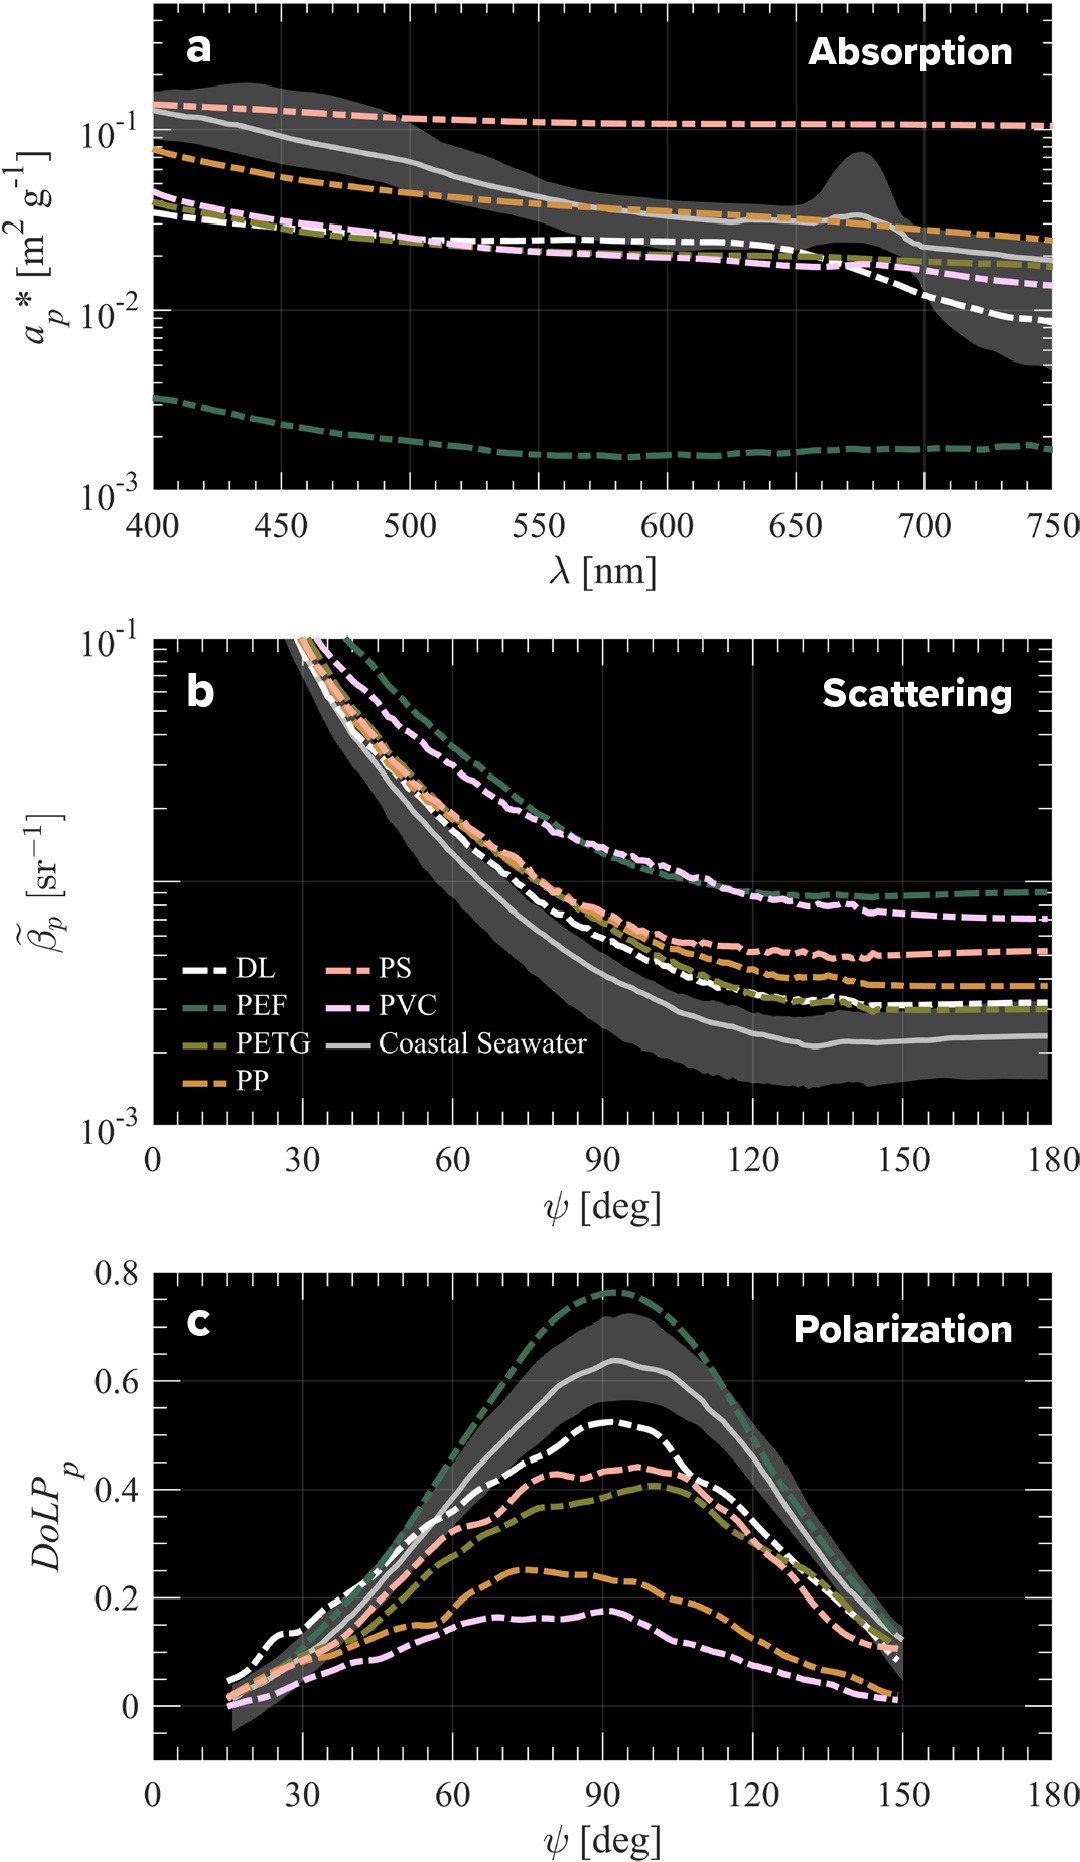
Figure 3 depicts measurement results of the inherent optical properties for the microplastic samples. For comparison, Figure 3 also includes measurement results from a selection of contrasting natural seawater samples from Southern California and Northern Alaska (Koestner et al., 2021). The seawater samples represent a large range of conditions, from turbid and inorganic-dominated to phytoplankton and organic-dominated particle assemblages. Generally, microplastic particles have several unique optical features in comparison with typical seawater samples. First, the microplastic samples tend to have spectrally flat absorption and relatively low absorption of blue and green light (λ = 400–550 nm; Figure 3a). Second, the microplastic samples have relatively high scattering in the backwards angles (ψ = 90°–180°; Figure 3b). A signal observed by a satellite or above-water sensor becomes stronger with increased backscattering and decreased absorption, two areas where microplastics exhibit noteworthy differences from natural seawater samples. Finally, microplastic samples generally have low values of the degree of linear polarization, which indicate that these particles depolarize light more effectively than typical marine particles (Figure 3c). In this sense, the use of polarizing filters may provide an additional advantage in terms of detectability.
|
|
These results are quite promising, though more work is needed to develop specific algorithms or instrumentation capable of detecting and quantifying microplastic particles suspended in seawater. For example, the optical properties of microplastics are expected to change after photodegradation and pigmentation, and when bacteria or phytoplankton live on the surface in biofilms; therefore, measurement results of virgin microplastic samples may have some limitations (Garaba and Dierssen, 2018). Our results also suggest that differentiating between polymer types may be challenging using optical measurements with visible light (note both similarities and differences in optical properties of different microplastics in Figure 3). Nonetheless, these measurements are extremely useful for further development of optical detection techniques and understanding of limitations because they can be used in modeling simulations of the ocean light field. In particular, the measurements we present are more representative of the types of microplastics (smaller than about 333 µm in diameter) that are likely entering marine food webs (Cole et al. 2013; Brandon et al., 2020), as opposed to microplastics greater than about 333 µm, which have been examined in other studies (e.g., Garaba and Dierssen, 2018; Hu, 2021).


