Introduction
Since the early 1990s, global sea level rise has accelerated, with roughly one-quarter of that acceleration caused by mass loss from the Greenland Ice Sheet (Nerem, 2018). Rates of ice loss are largest in the southeast and northwest sectors of Greenland (Khan et al., 2010; Joughin et al., 2010; McMillian et al., 2016), where marine-terminating glaciers place ice in direct contact with ocean waters, and also where ocean surface temperatures have increased the most rapidly (Reynolds et al., 2007; Figure 1). In the 1990s, about half of Greenland’s ice loss was due to speed up and thinning of glaciers around the ice sheet margins, with the other half caused by increased melting at the surface (van den Broeke et al., 2009), although these dynamic effects accounted for only about one-third of ice loss in more recent years (Enderlin et al., 2014). Recent work suggests that warming ocean temperatures around Greenland may be responsible for the accelerated ice loss from marine-terminating glaciers (Rignot et al. 2012; Straneo and Heimbach, 2013). Indeed, as discussed by Nowicki and Seroussi (2018) elsewhere in this issue, uncertainty in the magnitude and likelihood of such ocean-ice interactions remains one of the largest challenges for producing realistic projections of ice sheet mass loss in the warming climate of the twenty-first century.
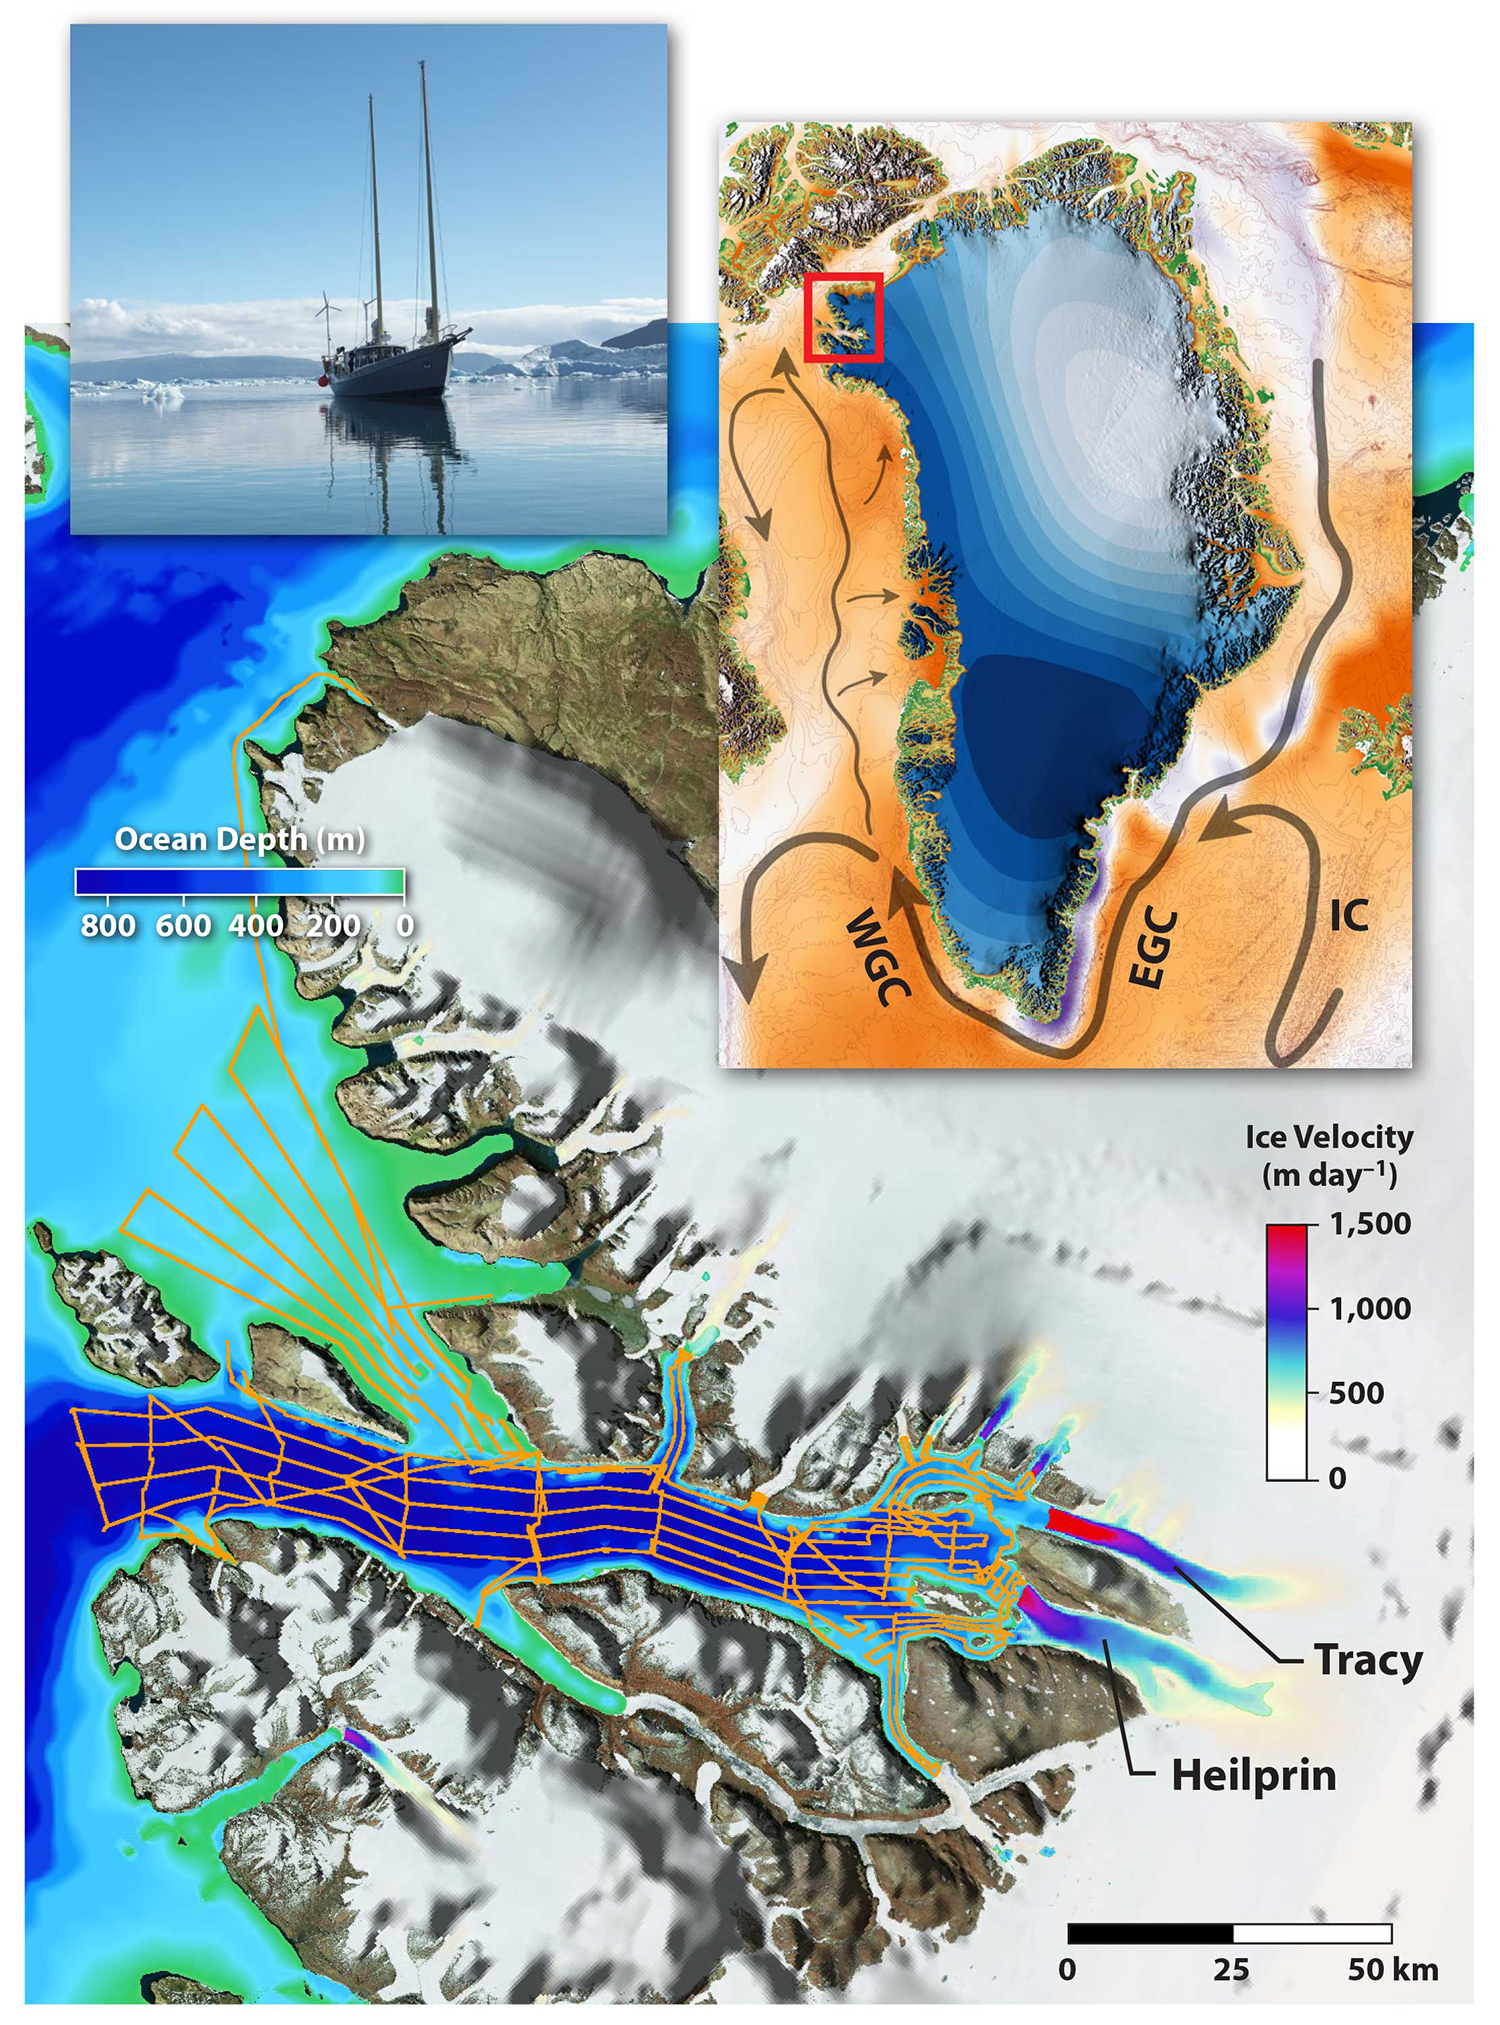
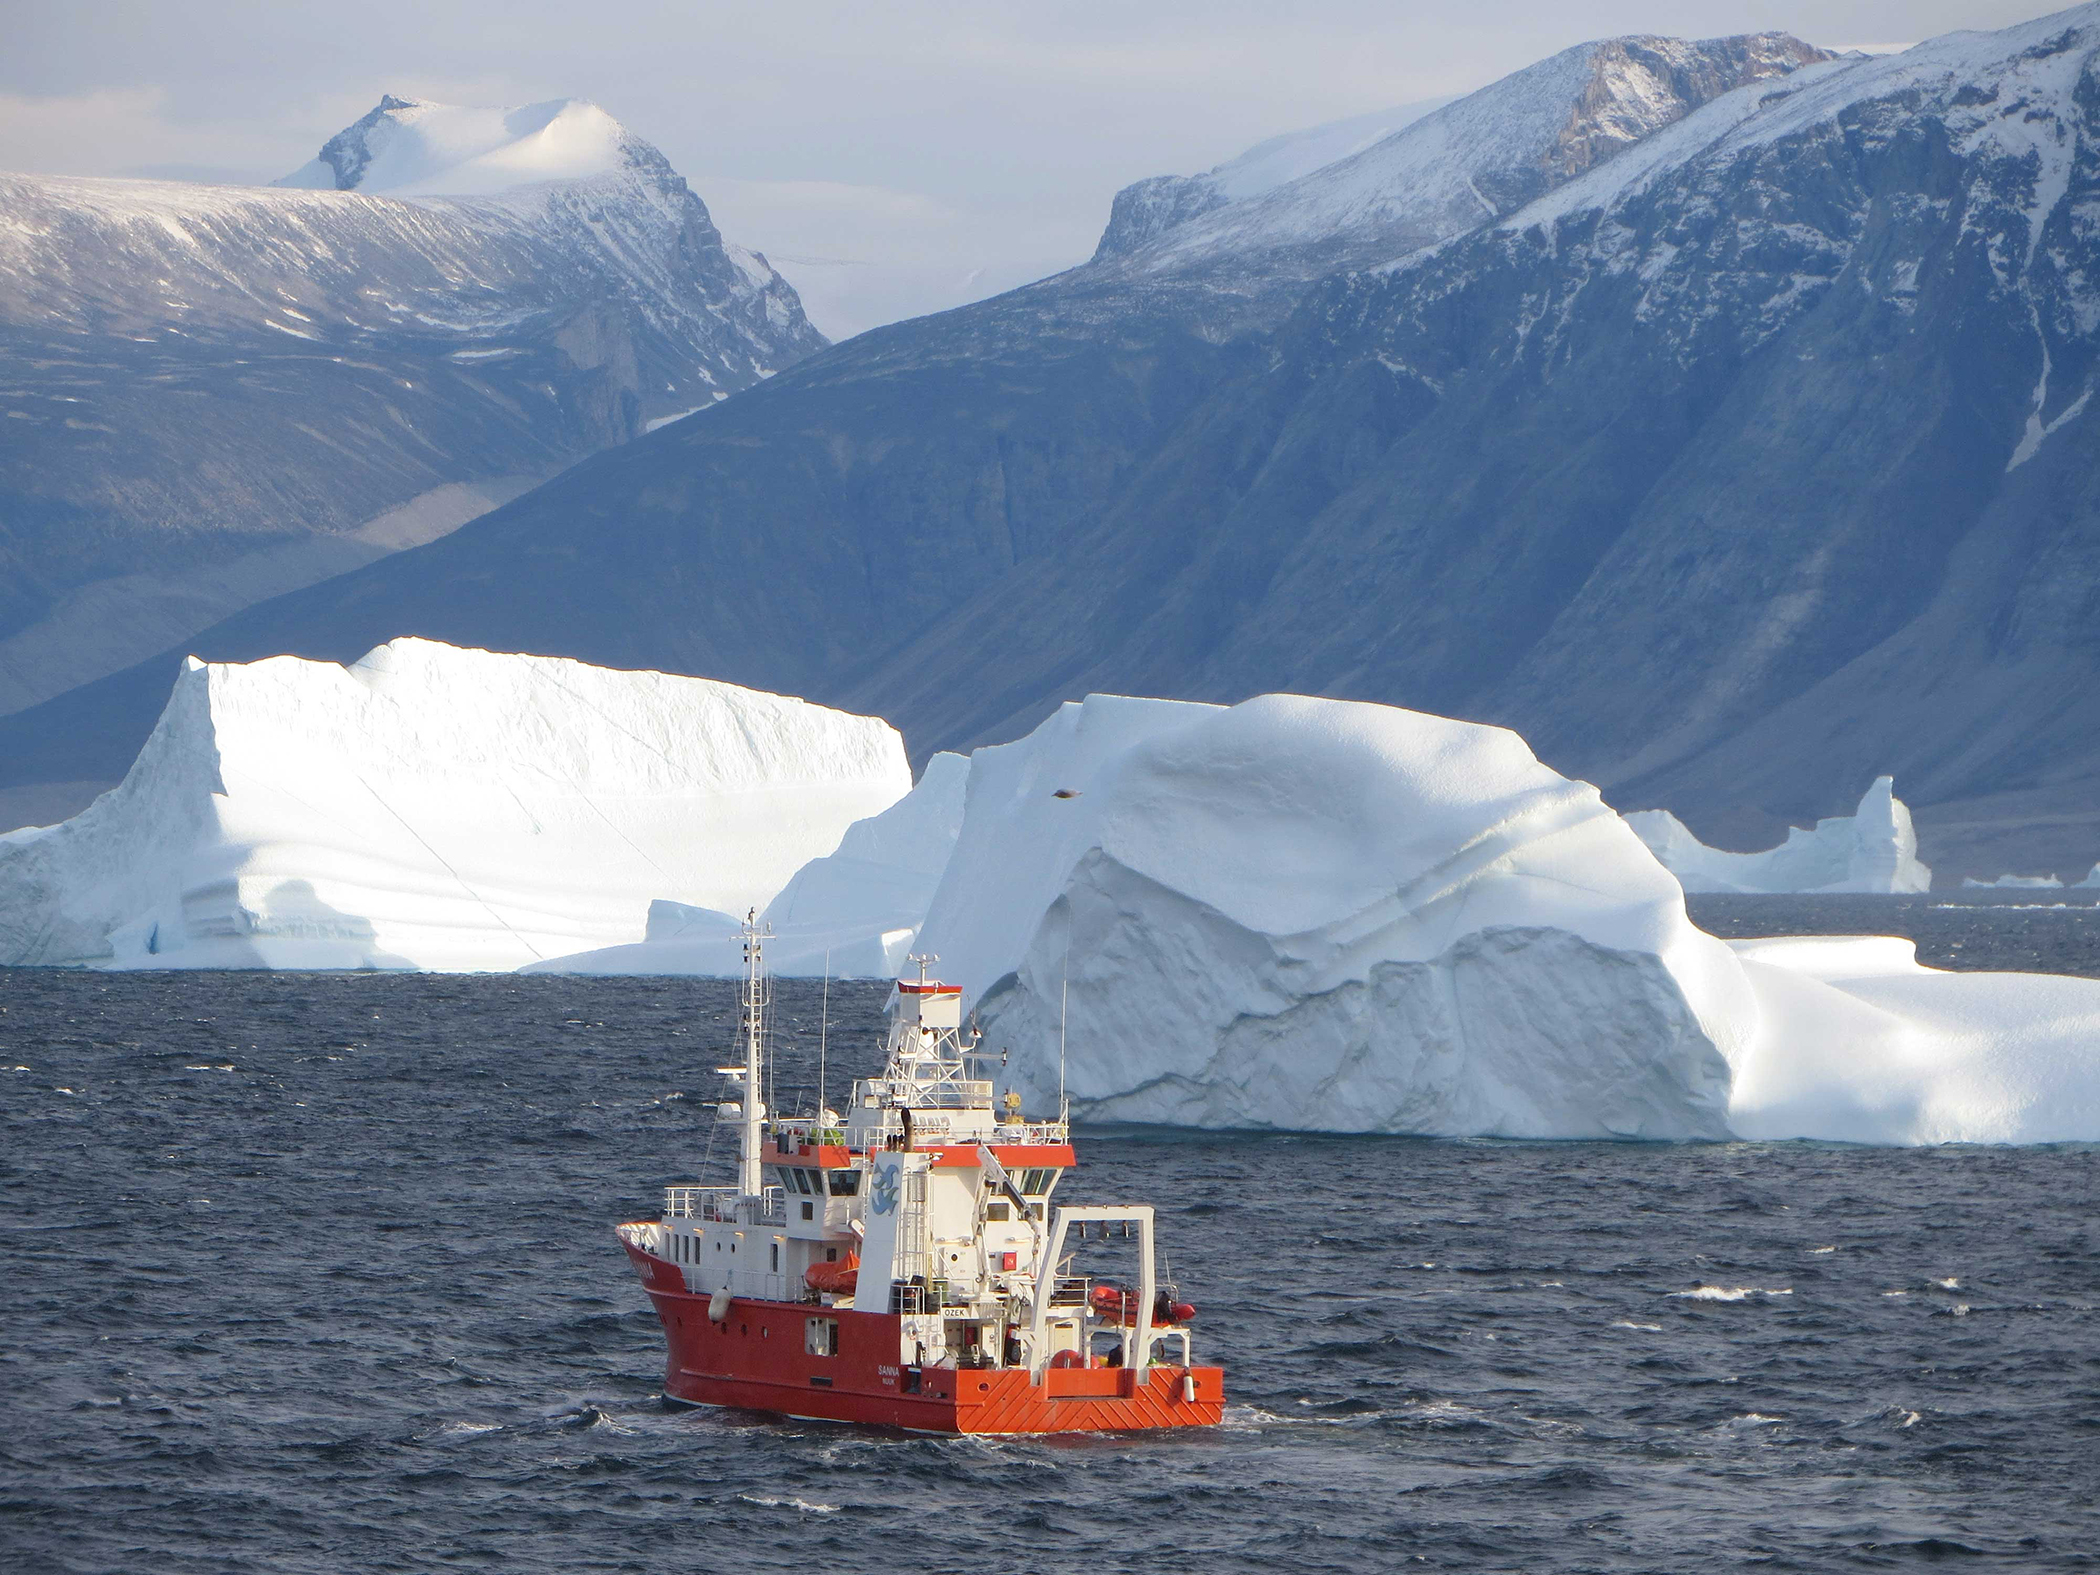
Figure 1. The study region showing Inglefield Gulf as well as Tracy and Heilprin Glaciers. The thin orange line plots the track the Ocean Research Project (ORP) survey by R/V Ault, which is pictured at upper left. Colors over the ocean indicate depth as estimated from BedMachine V3. Colors over the ice show ice velocity as estimated from the Measures Greenland Ice Velocity observations for 2016 (Joughin et al., 2010). The upper right inset shows the Greenland Ice Sheet with major currents illustrated and the study area highlighted. The orange shading in the inset highlights regions around Greenland where the ocean warmed most rapidly from 1993 through 2017 based on gridded satellite sea surface temperature data from NOAA (Reynolds et al., 2007). Blue colors over Greenland show regions of most rapid ice mass loss between 2002 and 2016 based on GRACE satellite gravity data. IC = Irminger Current. EGC = East Greenland Current. WGC = West Greenland Current. > High res figure
|
On the continental shelf surrounding Greenland, ocean waters tend to be warmer at depth than at the surface. With water temperatures lower than 6°–7°C throughout the water column, the thermal expansion coefficient is relatively small, and salinity is primarily responsible for the gradient in density. Mixtures of warm, salty Atlantic waters are found at depths greater than about 200 m, and are overlain by a layer of cold, fresh polar waters that originate from the Arctic Ocean (Straneo et al., 2012). This means that for warm Atlantic waters to come in contact with the calving front of a glacier face, the glacier must usually terminate at a depth greater than 200 m.
Despite a great deal of recent work connecting the warming of ocean waters with increased glacier melt, retreat, and acceleration (Holland et al., 2008; Straneo and Heimbach, 2013; Rignot et al., 2016; Truffer and Motyka, 2016), it remains challenging to quantify the amount of ice loss associated with ocean warming across the entirety of the Greenland Ice Sheet. Making this assessment is one of the primary objectives of NASA’s five-year Oceans Melting Greenland (OMG) mission (Fenty et al., 2016). Through 2020, OMG will conduct airborne surveys of ocean conditions and ice surface elevations around Greenland’s entire coastline. As part of this project, OMG has already carried out a number of extensive ship-based ocean bathymetry surveys and airborne gravity surveys in regions where knowledge of fjord depths and the complex seafloor topography on the shelf were inadequate. Together, these observations of ocean conditions, glacier change, and seafloor topography can provide a holistic view of ocean-ice interactions and their impact on mass loss from the Greenland Ice Sheet.
Here, we consider OMG observations in Inglefield Gulf, an isolated fjord system in northwest Greenland. There, observations of ocean temperature and salinity, seafloor shape and depth, and changes in glacier thickness provide insight into ocean-ice interactions and glacier retreat, and highlight the importance of ocean warming to Greenland ice loss.
Study Region and Background
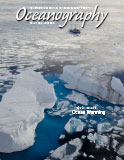
In 2016, OMG contracted the Ocean Research Project (ORP) to survey Inglefield Gulf and collect observations of seafloor depth as well as ocean temperature and salinity throughout this previously unmeasured system of fjords (see Figure 1). The survey was carried out by coauthors Rutherford and Trenholm aboard R/V Ault, a small sailing vessel (see Figure 1) equipped with single-beam sonars for measuring seafloor depth and a CTD instrument for collecting vertical profiles of ocean temperature and salinity. R/V Ault spent most of the summer in Inglefield and surrounding waters and collected 1,300 nautical miles (2,400 km) of single-beam echosounder measurements and over 130 CTD casts.
Although subsurface Atlantic water temperatures are greater than 0°C around almost all of Greenland, they are warmest in the southeast where the Irminger Current (denoted IC in Figure 1) delivers 5°–7°C subtropical Atlantic waters to the continental slope. These warm, subsurface waters make a roughly year-long journey around the southern tip of Greenland and flow poleward in an offshore boundary current along the island’s west coast (Grist et al., 2014). During this transit, they mix with shallower, colder waters as well as runoff and ice melt from the Greenland Ice Sheet. By the time they reach Inglefield, subsurface waters have cooled to temperatures ranging from 0.5°C to 1.5°C.
Despite a lack of historical measurements, Inglefield has been studied previously because it contains two medium-sized, fast-moving glaciers that have behaved differently throughout the warming of the past century. Tracy and Heilprin Glaciers are the two largest and fastest-flowing glaciers in the small northwest basin that empties primarily into Inglefield Gulf (see Figure 1). Although small in terms of their overall contribution to the drainage of the Greenland Ice Sheet (Enderlin et al., 2014), they are of interest because of their close proximity to one another and their remarkably different behaviors. Although both the atmospheric and oceanic conditions affecting these two glaciers are assumed to be similar, their retreat patterns over the past 100 years have differed considerably. Since 1892, Tracy has retreated more than 15 km, but Heilprin has retreated fewer than 4 km (Dawes and van As, 2010).
Porter et al. (2014) attribute the difference in behavior to the bed depth of each glacier at its calving front, and hence the extent of interaction they each have with warm subsurface Atlantic waters. Tracy’s terminus sits in roughly 610 m of water, while the calving front of Heilprin is only 350 m deep.
Here, we revisit the ocean-ice interactions in this area using a new, extensive survey of ocean conditions. We also update the thinning rates of these glaciers between 2016 and 2017 with new elevation maps collected during the OMG ice campaigns.
OMG Data
Ice Elevation
In 2016 and 2017, OMG surveyed Tracy and Heilprin Glaciers using NASA’s high-resolution airborne Glacier and Ice Surface Topography Interferometer (GLISTIN-A), hereafter GLISTIN (Moller et al., 2011; Fenty et al., 2016). The data collected have a vertical accuracy of ~1 m and horizontal postings of ~3 m. The swaths covered both glaciers from their termini to roughly 5 km to 6 km inland. Although thinning rates could not be computed far upstream (only to an elevation of about 250 m), the swath covered the entire glacier width, permitting an accurate estimate of volume change over the area observed. In both years, data were collected in March, just before the spring melt season began, in order to ensure a strong radar return and better performance for the GLISTIN instrument.
Figure 2 shows the difference in elevation between 2016 and 2017 for the two glaciers. The large area of color saturation at the front of Tracy results from a retreat of about 2 km during this time. The front of Heilprin Glacier, however, remained nearly stationary over the same period. Unlike prior ice elevation observations (e.g., from NASA’s Airborne Topographic Mapper or ATM), which measured only single tracks typically along glacier flowlines, the GLISTIN radar used for OMG provides a full digital elevation map, making it possible to calculate the complete glacier-wide average thinning rate. The thinning rates for each glacier are shown in the inset as a function of distance from the most recent front position. These rates are calculated within the boxes shown for each glacier, which extend about 6 km upstream from the fronts. Within these boxes, Heilprin thinned by about 1.8 m between 2016 and 2017 and Tracy by 9.9 m. These amounts are similar in magnitude to the thinning observed by Porter et al. (2014) between 2011 and 2012.
Figure 2. Changes in elevation of Tracy and Heilprin Glaciers between 2016 and 2017 as observed by the Glacier and Ice Surface Topography Interferometer during the Oceans Melting Greenland surveys. The black boxes indicate the regions used for calculating the mean elevation change as a function of distance from the 2017 ice front, shown in the inset. > High res figure
|
Ship Survey
The ORP ocean survey campaign took place during July and August of 2016, coincident with the peak glacier surface melt season—and hence peak runoff and subglacial discharge—between the two OMG ice surveys. The single-beam echosounders aboard R/V Ault provided the first comprehensive look at the bathymetry of Inglefield Gulf. Depths near the central part of the gulf reach over 900 m. Near Tracy and Heilprin, however, depths can be as shallow as 250–350 m. Remarkably, R/V Ault was able to collect data within 1–2 km of the ice front at Heilprin Glacier, measuring depths of 330–340 m and confirming previous estimates of the depth at the calving front (Porter et al., 2014). However, at Tracy, the ship was only able to survey within ~4 km of the glacier front because of icebergs. At these locations, depths were between 200 m and 450 m; however, the ship measurements of bathymetry did not reach the center of the fjord, so the deepest depths near the ice front may not have been sampled. Nevertheless, the slopes of the sill surrounding Tracy were adequately sampled to show that no pathway deeper than 350 m is open to the glacier.
Figure 3 shows depths computed as part of BedMachine v3 (Morlighem et al., 2017), an analysis designed to improve maps of the seafloor and bed topography by incorporating a suite of available bathymetric measurements. BedMachine incorporated depth observations from the ORP survey (along with many others) into a blended estimate of fjord bathymetry and glacier bed depth. Although we find no reason to suggest that previous estimates of the fjord depth at the glacier front of ~600 m are too deep (Porter et al., 2014), our ship survey did not find depths near the glacier front deeper than about 450 m. Nevertheless, further analysis of the ORP bathymetry measurements could provide better insight into the shape and depth of the seafloor near the front of Tracy.
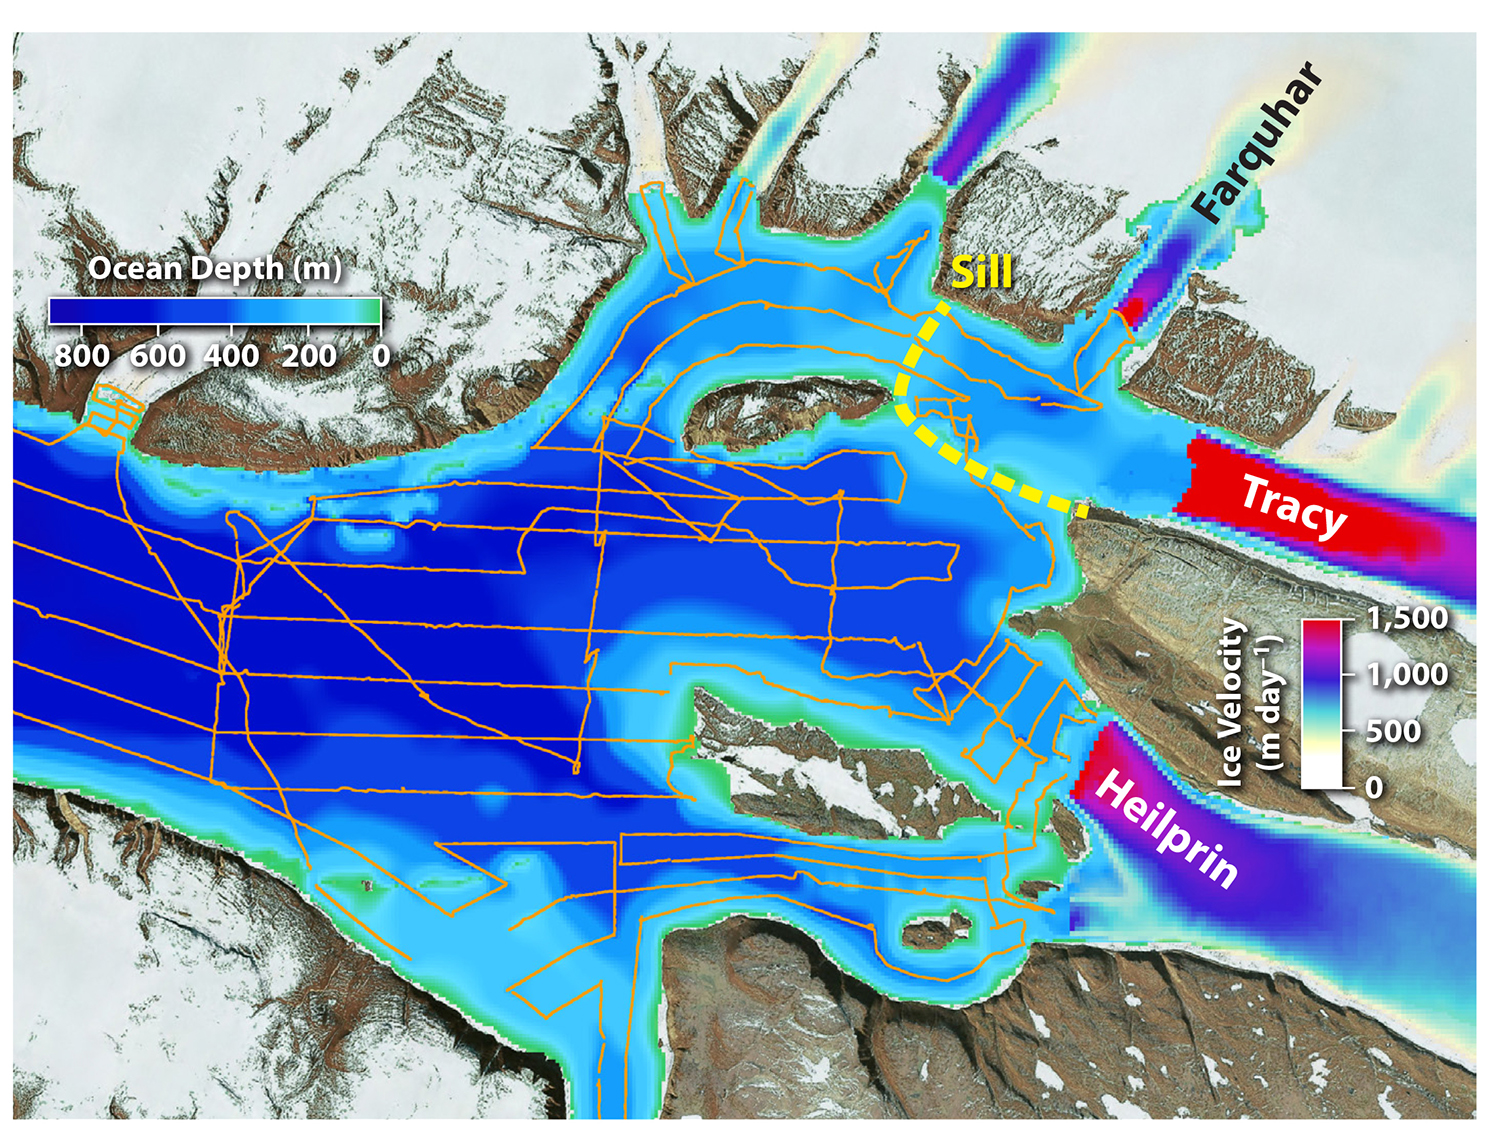
Figure 3. Bathymetry in Inglefield Fjord from the ORP cruise combined with estimates generated by BedMachine. The thin orange line plots the R/V Ault cruise track. The yellow dashed line traces the sill near Tracy Glacier. Colors overlaid on the glaciers show ice velocity, as in Figure 1. > High res figure
|
During its 2016 survey, R/V Ault also collected 130 CTD casts in Inglefield Gulf and the surrounding region. These data not only provide the first recent look at temperature and salinity conditions in the gulf but also provide a means of estimating the ocean circulation near the glaciers. Based on the temperature and salinity data collected in the fjord, we estimate the internal Rossby radius to be ~6.8 km in Inglefield. With a fjord width of 15 km, geostrophic circulation in the fjord is expected.
We estimate the geostrophic flow using the differences in density between adjacent CTD stations and the thermal wind equations in a manner similar to Johnson et al. (2011). Although the CTD stations allow us to calculate geostrophic shear, and thus the relative velocities, without additional data from moorings or other current measurements, we have no simple means of deriving a reference velocity. Here, we assume a level of no motion near the bottom, defined as the deepest depth shared between two adjacent stations. While this assumption is almost certainly violated within the fjord circulation, currents are generally expected to be slower at depth. Thus, the geostrophic velocities shown here provide a qualitative view of the general fjord circulation, and an order of magnitude estimate for the strength of the currents.
Figure 4 shows the depth-integrated geostrophic current calculated between several key CTD station pairs, as well as velocities as a function of depth for two. The general sense of the circulation is counterclockwise, or cyclonic, as expected from a gulf whose width is about twice the Rossby deformation radius. Following the contours of seafloor topography, currents are topographically steered into Inglefield Gulf as they head north in the West Greenland Current (see inset of Figure 1). These currents flow into the Gulf along its southern bank before circulating past Heilprin, then Tracy, and then exiting along the northern bank. Near the east end of Inglefield, measurements from the row of CTD stations crossing the fjord from north to south suggest that this cyclonic circulation persists as waters reach and interact with the two glaciers. Combining the eastbound currents across the southernmost three pairs gives a net flow of ~0.2 Sv. Likewise, the westbound current between the top two pairs is also ~0.2 Sv. It is likely that some of this water is recirculated within the fjord without interacting with the glaciers. Nevertheless, this provides an upper bound on the amount of ocean water available to interact with Tracy and Heilprin.
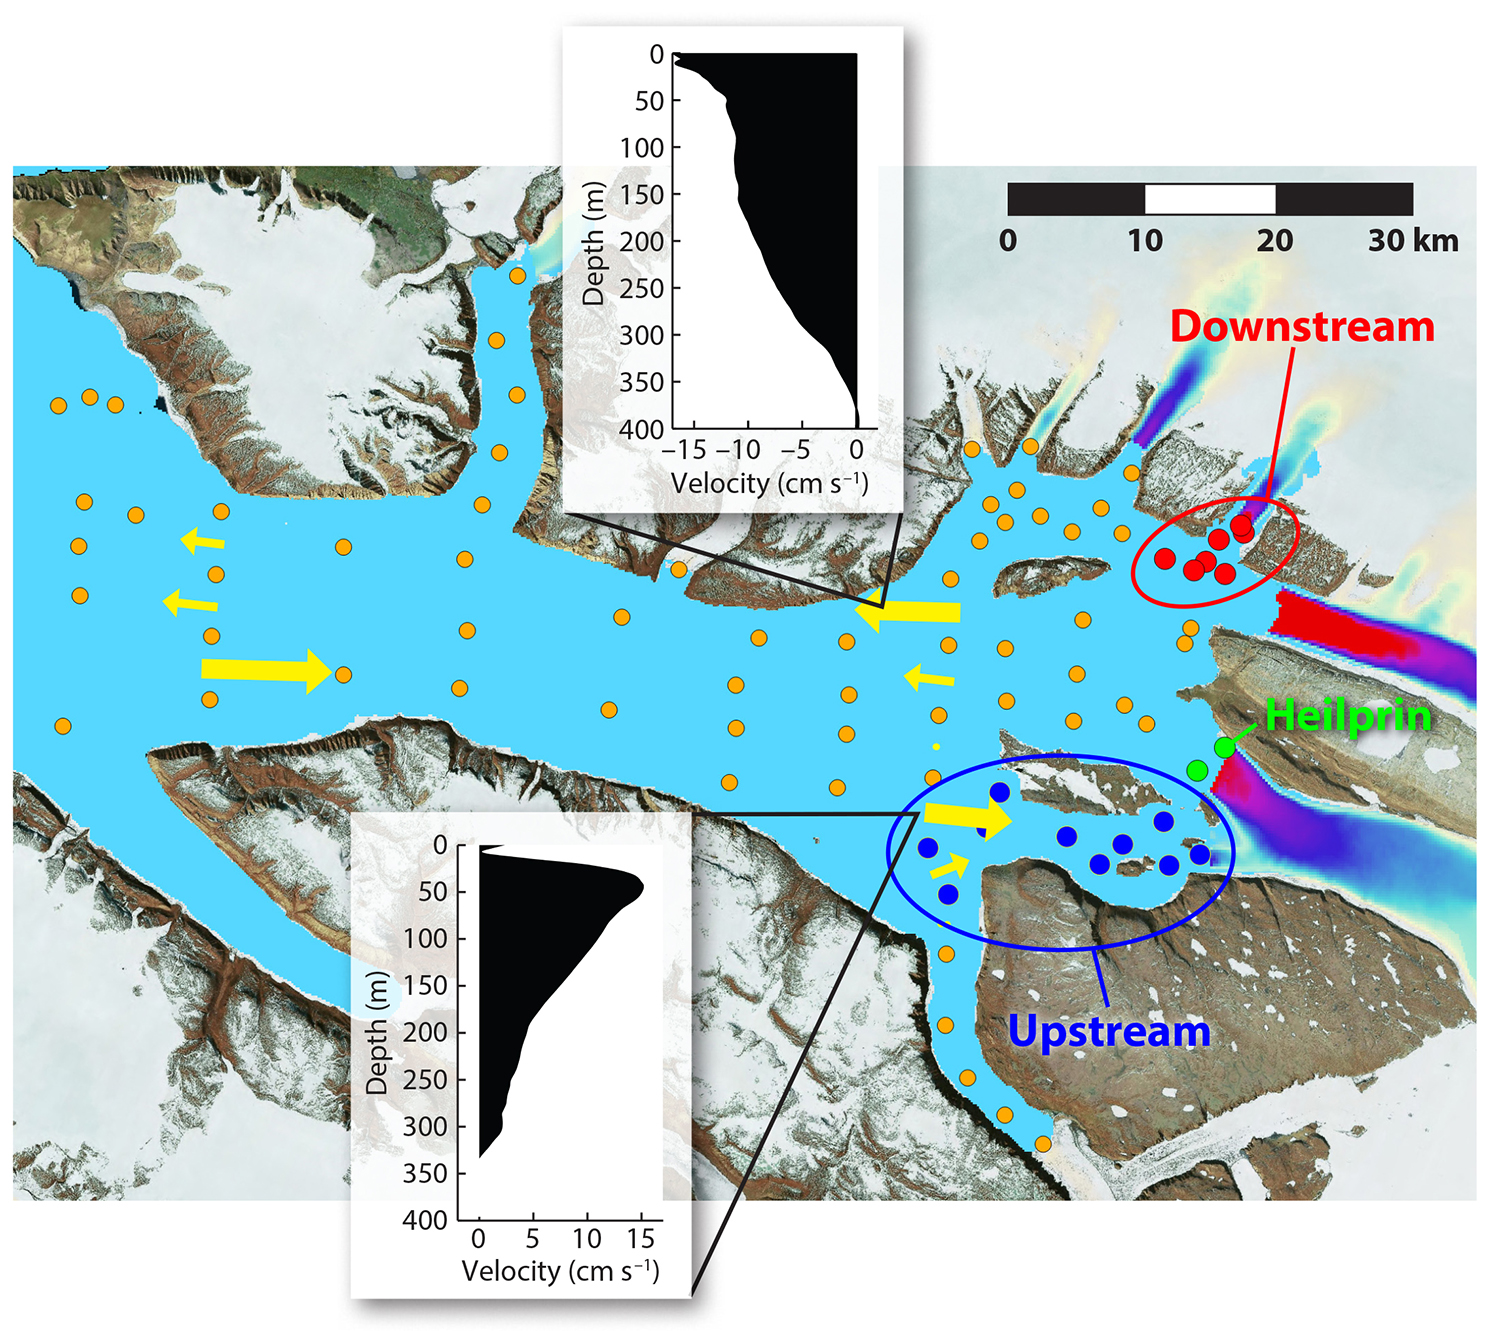
Figure 4. Colored dots mark the locations of CTD profiles collected during the 2016 ORP survey. Yellow arrows show the general geostrophic circulation estimated between several pairs of CTDs. The two insets plot the currents as a function of depth for the inflow and outflow near the end of the bay. Blue dots indicate profiles made “upstream” of Heilprin and Tracy Glaciers in terms of the direction of the currents, and red dots are profiles made “downstream” of these two glaciers. The two profiles collected near the front of Heilprin Glacier are located by green dots. Orange dots show the remaining CTD locations in the region. > High res figure
|
To better understand the interaction with the glaciers, we consider two sets of CTD profiles that we classify as being immediately “upstream” or “downstream” of the two glaciers (Figure 4). Temperature profiles for these locations are shown in Figure 5. As expected, the upstream profiles show two distinct layers at depth. Below about 250 m, waters reach temperatures of 1°C. These are warm, salty Atlantic waters that have been mixed and cooled during their journey northward along Greenland’s west coast. Polar waters in the layer shallower than 200 m have temperatures around −0.5°C.
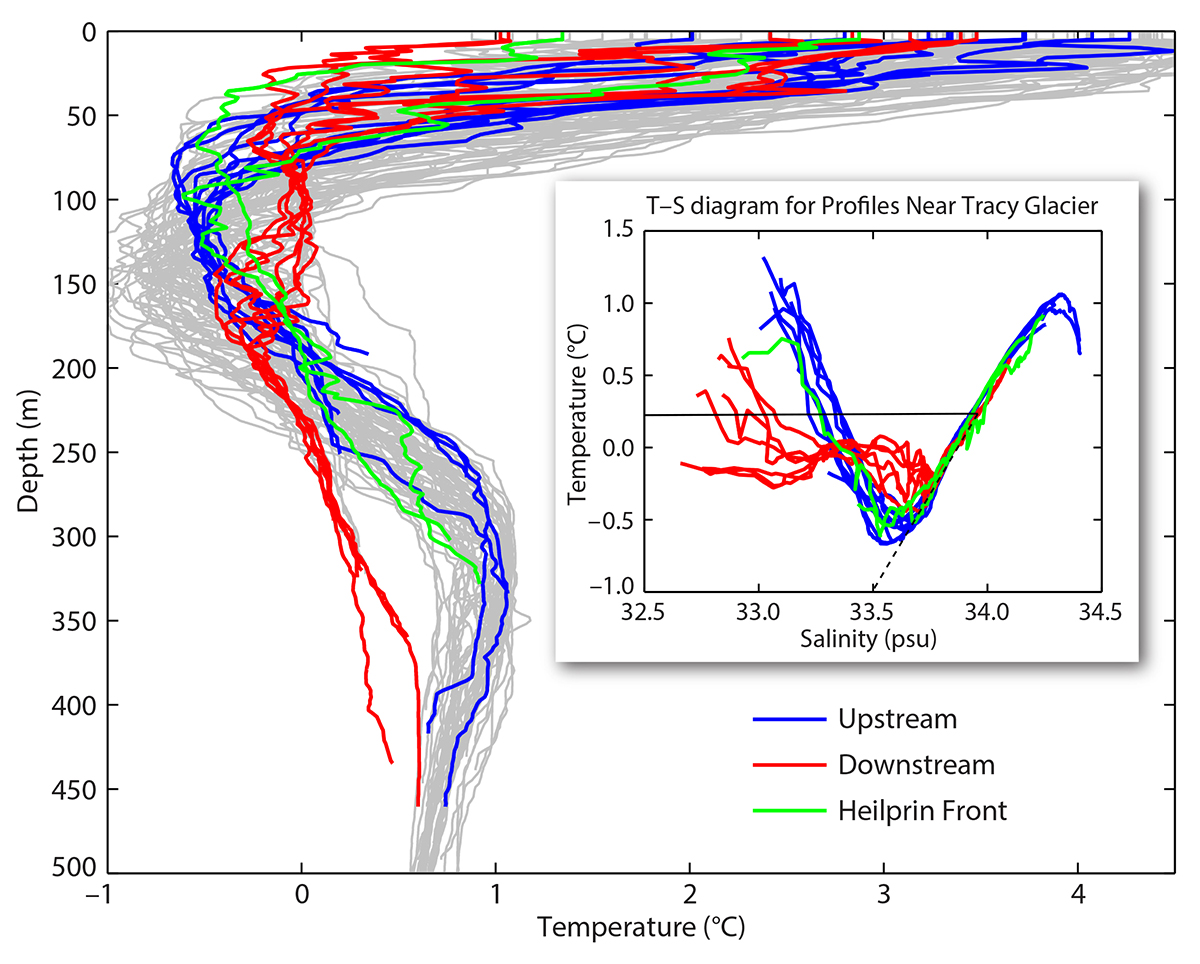
Figure 5. Temperature and salinity profiles near the fronts of Tracy and Heilprin Glaciers. The blue profiles were collected upstream of both glaciers in terms of the fjord circulation and correspond to the blue dots in Figure 4. The red profiles were collected downstream of both glaciers and correspond to the red dots in Figure 4. The green profiles were collected near the Heilprin glacier front. Gray profiles in the background show all other profiles collected in Inglefield Gulf. Note that downstream waters have warmed significantly between 75 m and 150 m depth; the profiles collected near the Heilprin front show no such warming. The background figure shows the temperature as a function of depth, while the inset shows temperature as a function of salinity for the upstream, downstream, and Heilprin front profiles. In the inset, the solid black line illustrates the runoff line, while the dashed line shows the melt line, as discussed in the text. Finally, note that the downstream temperatures below 300 m still fall along the same line of properties as the upstream profiles at depths near 300 m. This suggests that the waters below 300 m in the downstream profiles primarily consist of water that was light enough to make it over the sill. > High res figure
|
In the downstream profiles, it is clear that the waters in the shallow layer have been modified significantly by interaction with the glaciers. In addition, the deeper waters in the downstream profiles are also much cooler and fresher. However, the temperature and salinities of these waters are consistent with shallower water in the upstream profiles (see Figure 5 inset). This appears to be due to the fact that these profiles sit behind the sill that surrounds the entrances to both Tracy and Farquhar Glaciers, highlighted in Figure 3. Although the ORP survey did not follow the sill exactly, the available data and geometry of the fjord suggest that the sill depth is approximately 250–300 m. Blocked by this sill, deeper, warmer waters may not easily reach the small deep basin into which Tracy currently flows. Hence, waters below 250 m in these profiles are likely to be composed of a mixture of water that was light enough to flow over the sill (i.e., water at about 250 m depth), waters modified by interaction with the glacier, and possibly remnant waters that spilled over the sill in previous years. Despite the sill, temperatures are not completely uniform below 250 m. This could reflect connections in the sill region that are slightly deeper than 250 m, or short-term fluctuations such as tides and internal waves that allow somewhat deeper water to occasionally be pushed over the sill. In any case, the deep profiles behind the sill suggest that water temperatures at the base of Tracy could be as warm as 0.25°–0.5°C. For the remainder of the analysis, we assume that the water temperature at the base of the glacier is similar to that of the water outside the sill at 300 m depth. Given the consistency between the properties of the deep water behind the sill and the shallower waters in the upstream profiles, this assumption appears to be reasonable.
Plume Model
Summer melt on the surface of the Greenland Ice Sheet drains through moulins and fractures in the ice, often reaching the bedrock underneath before flowing down glacier beds and finally into the ocean at the bottom of marine-terminating glaciers (Nienow et al., 2017). Because the fresh meltwater has roughly zero salinity, it is buoyant and rises along the glacier face in a plume that entrains and mixes with local waters (Xu et al., 2012; Carroll et al., 2015). In the downstream profiles, we find a clear warming signal of ~0.5°C in a layer between 75 m and 175 m depth, relative to the upstream profiles, corresponding to salinities of about 33.5 (see Figure 5 inset). This strongly suggests upward transport and mixing of warmer and saltier Atlantic waters by rising subglacial plumes.
By showing the temperature as a function of salinity rather than depth, the Figure 5 inset also illustrates this mixing of warmer, saltier Atlantic waters and cooler, fresh meltwaters. Plotted this way, mixtures of water masses with different properties will fall along straight lines connecting them. For example, the runoff line, plotted in the inset of Figure 5, connects the temperature and salinity of the water at the depth of the front at Tracy (equal to the water properties at 300 m, the depth of the sill) with that of subglacial discharge water, whose temperature and salinity are assumed to be ~0°C and 0 psu, respectively. If the subglacial discharge water mixed solely with the ocean water at the bottom of the fjord, we would expect the properties of the resulting mixture to fall along this line in the T/S plot. Likewise, the melt line shown in the Figure 5 inset represents the mixture of the water at the bottom of the front with water melted from the glacier itself (calculated as in Straneo et al., 2011). The fact that the downstream profiles fall largely between these two lines suggests that the resulting water is a mixture of subglacial runoff, melt from the glacier, and water at shallower depths.
With knowledge of the depth of each glacier at its calving front, as well as the typical water properties in the fjord, it is possible to model an idealized subglacial discharge plume and its interaction with the glacier and surrounding waters (Jenkins, 2011; Carroll et al., 2016). To estimate the subglacial discharge, we used daily surface runoff from the Regional Atmospheric Climate Model (RACMO) version 2.3 (Noël et al., 2015). Carroll et al. (2016) modeled subglacial plumes at Tracy and Heilprin Glaciers using ocean temperature data collected in 2003, offshore from Inglefield Gulf. They found that the depth at the calving front at which subglacial discharge water emerges played a strong role in the amount of submarine melt at the glacier face as well as the depth of neutral buoyancy and the anomaly in temperature carried by the plume. Here, we revisit the plume model used by Carroll et al. (2016) using the 2016 CTD data collected in Inglefield. Figure 6 shows the results for the summer months, when both peak runoff occurs and the CTD survey was carried out.
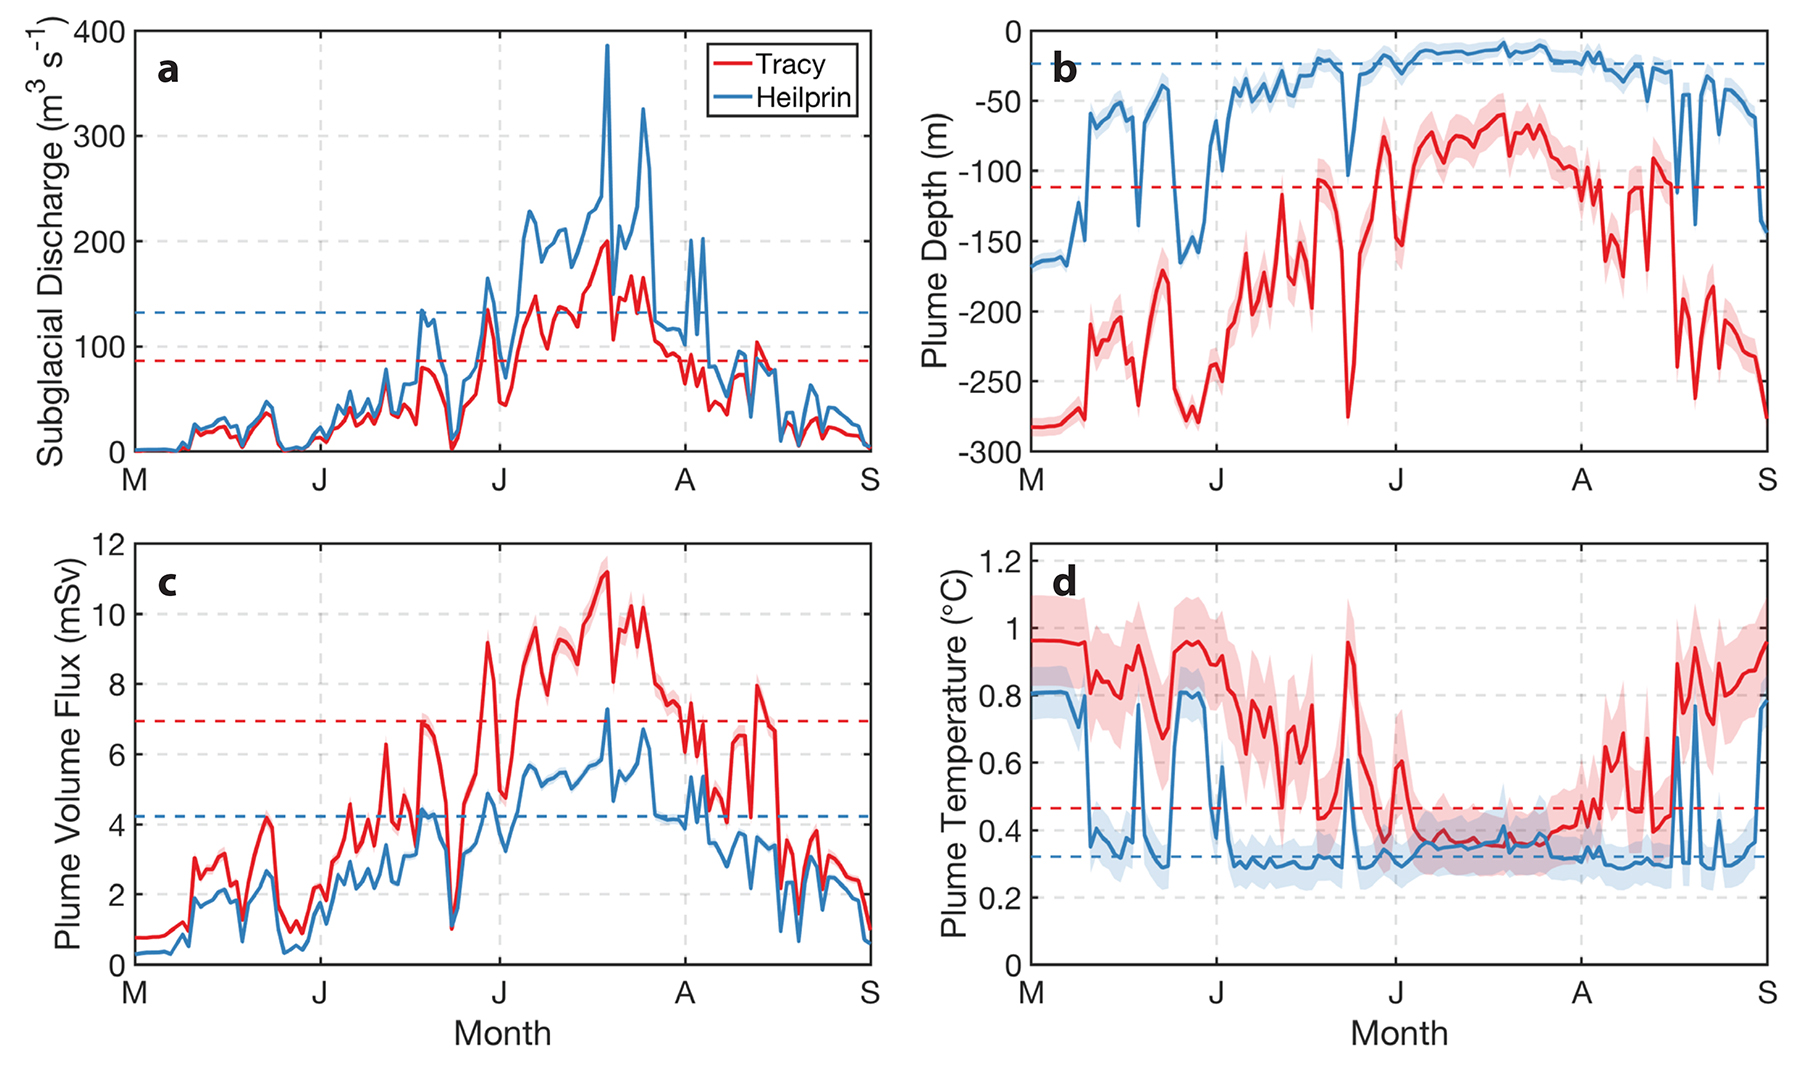
Figure 6. Results from the idealized subglacial plume model using the ORP temperature and salinity profiles, along with daily estimates of subglacial discharge in each glacier catchment from the Regional Atmospheric Climate Model (RACMO) during summer 2016. The subglacial discharge flux for each glacier is plotted as (a) a function of day, along with (b) the approximate depth where the plume reaches neutral buoyancy with the surrounding fjord waters. The plume volume flux and temperature at the neutral buoyancy depth are shown in (c) and (d), respectively. Shaded error bars in (b–d) show variability over the range of ORP profiles collected; horizontal dashed lines show mean values during the July 23 to August 13 shipboard survey. For Tracy, the effect of the sill is simulated by assuming that waters below 300 m depth are homogeneous in temperature and salinity. > High res figure
|
Heilprin Glacier has a much larger runoff catchment, resulting in higher peak subglacial discharge (Carroll et al., 2016). However, the deeper depth at the front of Tracy results in a more vigorous plume and larger entrainment of ambient fjord waters as the plume rises. This causes the plume’s volume at Tracy to be about 65% larger than that of Heilprin during July and August when the shipboard survey was completed. During this same period, the simulated plume temperature for Tracy was ~0.5°C while for Heilprin it was ~0.3°C. These plume temperatures represent a mixture of subglacial discharge, melt at the glacier face, and ambient ocean waters that are all entrained into the plume by the time it reaches the depth where it is neutrally buoyant. The model further suggests that the plumes do not reach the surface, but rather reach equilibrium depths of roughly 112 m at Tracy and 24 m at Heilprin during mean summer discharge.
Both the temperature of the plume water, and the equilibrium depth for the Tracy plume simulation are consistent with the shipboard temperature profiles shown in Figure 5. Based on the observed profiles, water between 75 m and 150 m depth warmed to about 0°C after interacting with the outflow from Tracy. This suggests that this layer contained a roughly equal mixture of local ocean water at −0.5°C (as observed in the “upstream profiles”) and water from the plume at 0.5°C. Conversely, two profiles collected within 1–2 km of the Heilprin Glacier front show no warming in this layer—that is, observed 100 m temperatures near the front of Heilprin are the same as those of the upstream profiles. This lack of warming suggests that modification of waters in this layer does not happen until after the water passes by Tracy during its counterclockwise circulation around the east end of the fjord. Taken together, the plume model results and observations suggest that the ocean-ice interactions at Tracy, not Heilprin, are responsible for the water modification in the downstream profiles at depths between 75 m and 150 m. Furthermore, these results imply that the deeper depth at the front of Tracy results in much more entrainment of ocean water into the plume and a more vigorous ocean-ice interaction, despite the larger subglacial discharge from Heilprin.
The plume model estimates local melt rates of 3.3 m day–1 near the bottom of Tracy and 2.8 m day–1 for Heilprin during mean summer discharge. The 2016 estimate of glacier velocity for Tracy is 2,200 m yr–1 (Joughin et al., 2010). The retreat of the front of Tracy Glacier by about 1 km between 2016 and 2017 suggests 3.2 km of ice was lost to either melting or calving. The plume model suggests a maximum melt rate of 4.8 m day–1, or 459 m of melt-induced retreat per summer for Tracy, meaning that calving processes may have dominated over submarine melt between 2016 and 2017. Although our model suggests that submarine melt did not account for the majority of retreat, recent work shows that plume-driven melting can undercut and erode glacier termini (Fried et al., 2015; Rignot et al., 2015), and is likely to enhance calving rates where this occurs. The front of Heilprin Glacier remained almost stationary between 2016 and 2017 and continues to flow at 1,400 m yr–1, similar to the 2011 rate reported by Porter et al. (2014). The plume model suggests a maximum summer melt rate of 4.6 m day–1 for Heilprin, or about 417 m of melt-induced retreat per summer, with reduced undercutting compared to the deeper Tracy. Thus, subglacial melt alone may have been adequate to maintain the position of the front between 2016 and 2017 without significant calving. This is consistent with typical conditions in the fjord where icebergs are abundant in front of Tracy, and far
scarcer near Heilprin.
Conclusions
Tracy Glacier not only has continued to retreat since 2011 but also has continued to accelerate, with its velocity increasing from 1,600 m yr–1 to 2,200 m yr–1. Conversely, the adjacent Heilprin Glacier has neither retreated nor accelerated significantly since 2011. Porter et al. (2014) found that the bed inland from the front of Tracy was relatively flat, while Heilprin’s bed depth increased inland of the front. Although bed slopes that deepen inland of the front—so-called “retrograde slopes”—have been associated with rapid retreat (Meier and Post, 1987), Heilprin’s relative stability suggests that it is not undergoing such a process. The only other major difference between these two glaciers is the depth of the glacier at the terminus. Thus, it appears that despite the presence of a shallow sill that is only ~250 m deep in front of Tracy, the glacier has continued to thin and retreat at a rate much higher than its neighbor. Our new ocean observations, combined with an idealized plume model, provide evidence of ocean-ice interactions and upwelling subglacial plumes at the front. The plume model suggests that the deeper front at Tracy results in a much larger plume volume and much higher melt rate than those of Heilprin.
For glaciers that are grounded below a sill depth, our results further confirm that shallow sills within a fjord are not necessarily sufficient to slow glacier wasting or prevent warm waters from reaching the ice front. A deep bed and a vigorous plume can still result in strong ocean-ice interaction and rapid retreat for glaciers of this type. In the present warming climate, the depth of the glacier at its terminus, or calving front, could be a critical factor in determining marine-terminating glacier retreat in Greenland.