Introduction
New technologies have revolutionized our understanding of Earth processes. Satellite remote sensing is one of the most well-known technological developments that has transformed our ability to collect information about the temporal and spatial dynamics of Earth’s ecosystems. For example, characterization and quantification of the extent of tropical deforestation and changes in land use over time would be difficult, if not impossible, to fully assess without remote sensing. In marine environments, details of the spatial and temporal variations in ocean temperature, sea level, and marine primary productivity have also been greatly advanced using satellite remote sensing. Here we suggest that analysis of environmental DNA (eDNA) from the water column offers a similarly novel perspective that will eventually change paradigms about the structure and dynamics of marine ecosystems.
Remote sensing and eDNA share many attributes: (1) they generate “big data” that are spatially and temporally comprehensive, (2) they require continual reprocessing of data as calibrations are improved and new algorithms or methods are developed, (3) a large number of derived products can be generated from the raw data, and (4) there was early skepticism regarding their potential utility. The thought that we could estimate ocean chlorophyll from space was first proposed half a century ago (Clarke et al., 1970). It was immediately met with doubt: How could we measure such a small signature in reflectance from the ocean surface from space, given the large amount of light scattered and absorbed by gases and aerosols in Earth’s atmosphere? Today, after many years of careful work by the marine optics community, we routinely generate reliable daily surface chlorophyll information on a global basis that complements other important Earth observations (Figure 1). Similarly, with eDNA, there is still considerable uncertainty as to how accurately it characterizes the ecological community. In this contribution, we review, at a high level, the progress, utility, and state of the art of eDNA methods for studies of marine biodiversity and ecosystem processes. The results presented are derived primarily from projects funded as demonstration studies for the development of an operational Marine Biodiversity Observation Network (MBON). The information used in this review comes from samples collected mostly within US National Marine Sanctuaries (Figure 1).
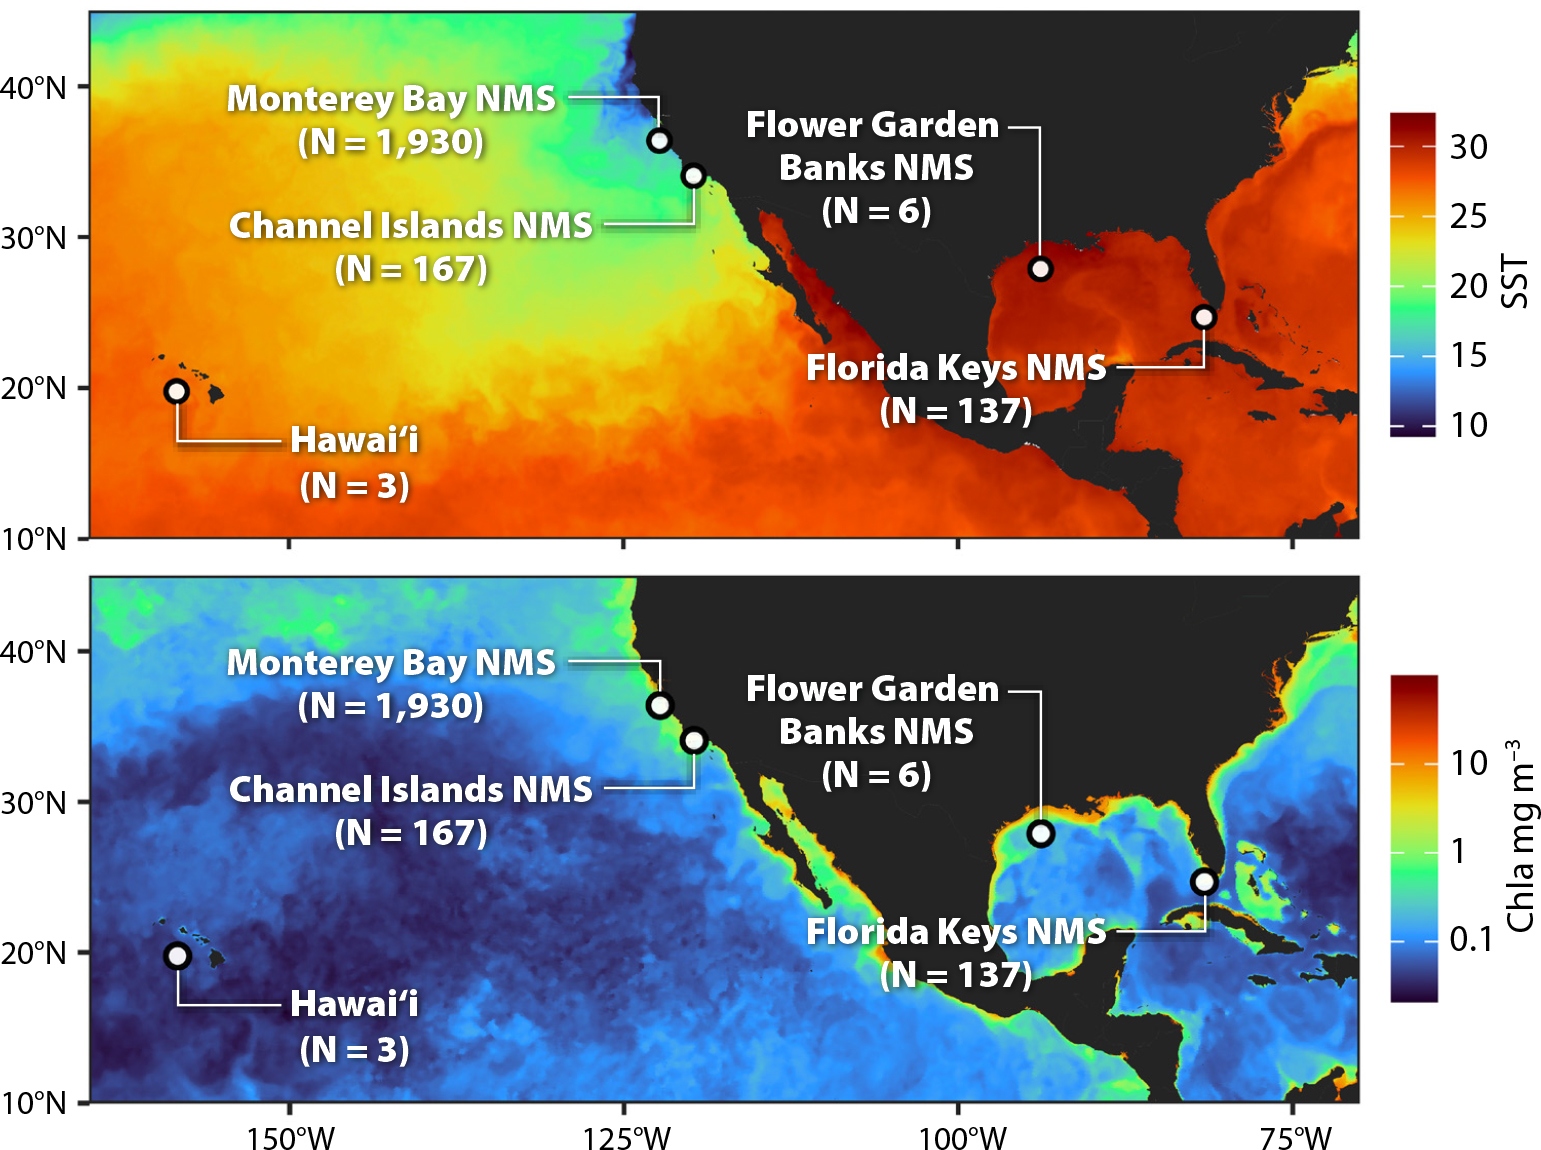
Figure 1. Map showing the locations where samples for this paper were collected and analyzed. The top map is shown over a background of satellite-derived sea surface temperature, the bottom over satellite-derived surface chlorophyll. > High res figure
|
What is Marine eDNA?
There has been considerable discussion about what the term “environmental DNA” should encompass (Darling, 2020; Pawlowski et al., 2020; Rodriguez-Ezpeleta et al., 2021). Here, we define marine eDNA as any extractable DNA that is collected by sending a volume of seawater through a filter with small porosity. In the case of smaller organisms (e.g., archaea, bacteria, phytoplankton), the majority of the DNA collected is in the form of living cells or intact organisms (Figure 2). For larger organisms (large zooplankton, fish, marine mammals), DNA can arise from shed tissue, excreta, or other dissolved molecules (Figure 2). This definition is consistent with others that consider “eDNA” to encompass all of the DNA extracted from an environmental sample (Taberlet et al., 2012; Pawlowski et al., 2020; Rodriguez-Ezpeleta et al., 2021).
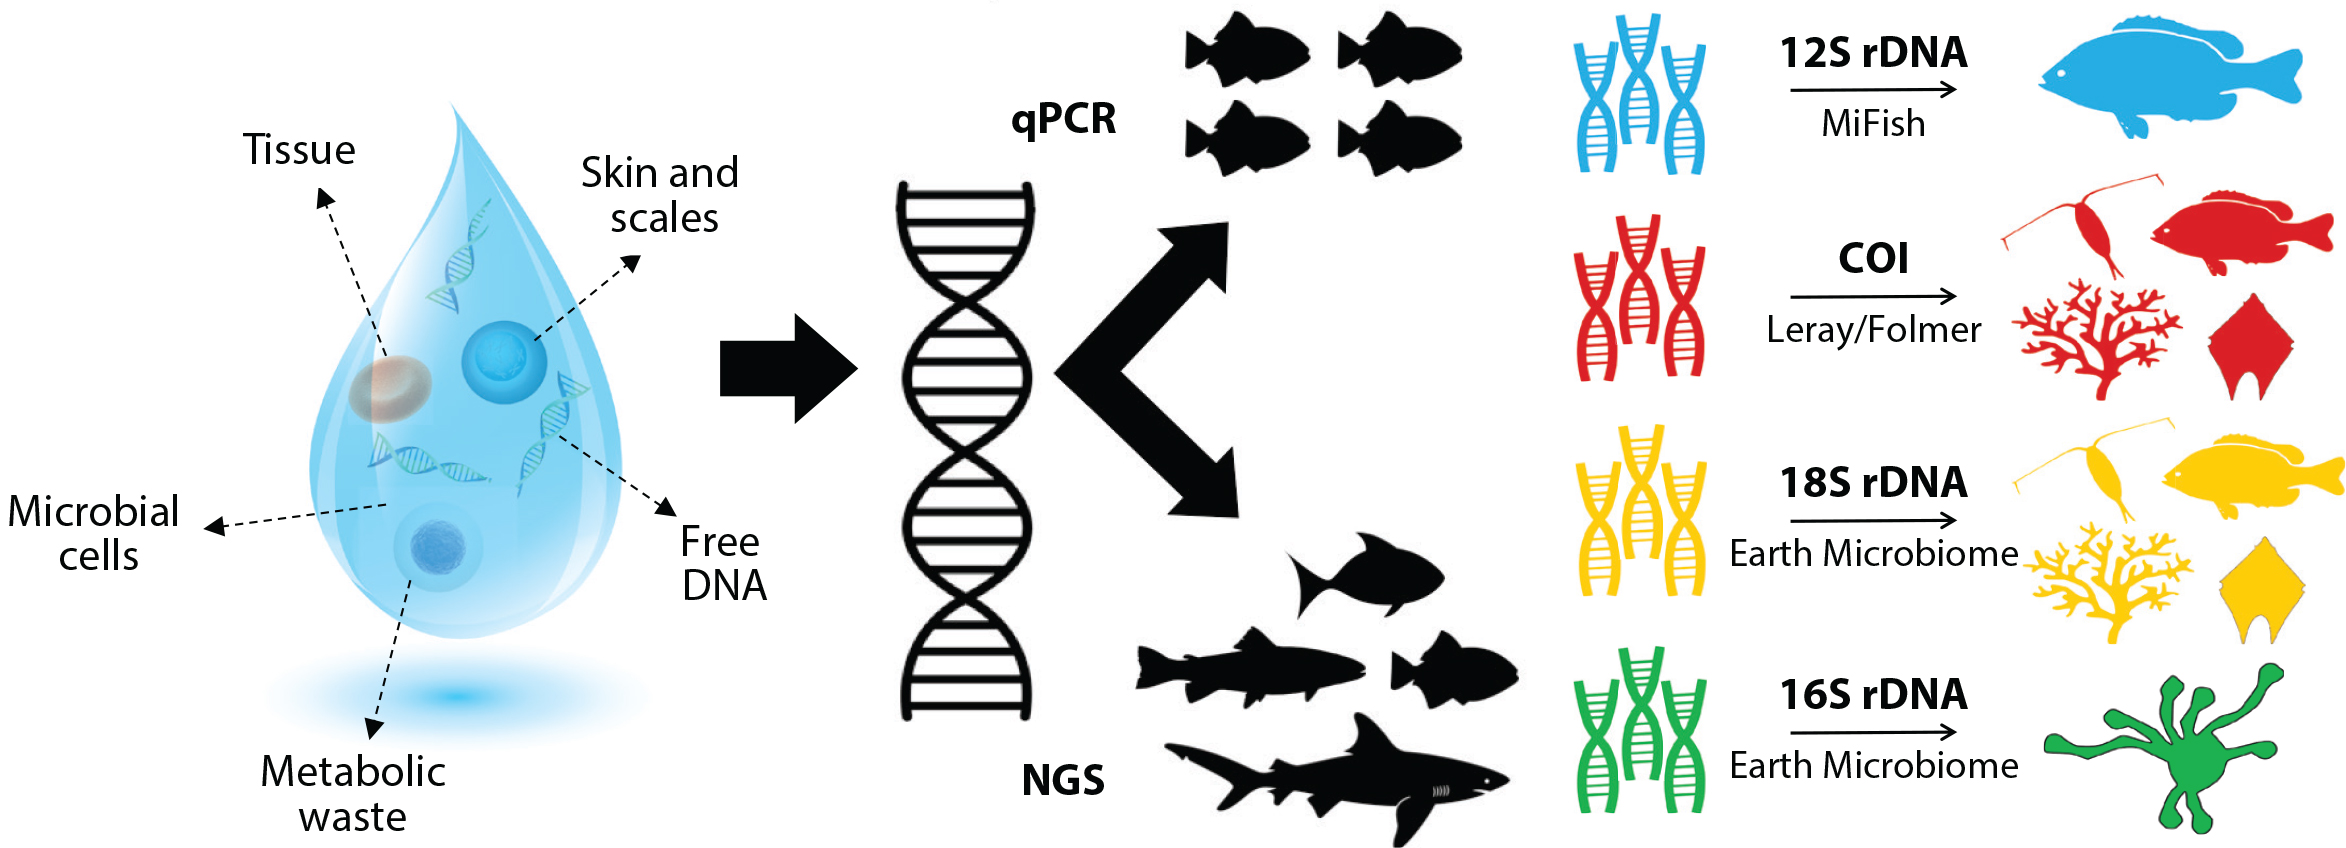
Figure 2. Marine eDNA suspended in seawater may contain living cells, metabolic waste, parts of organisms, or dissolved material. As part of the Marine Biodiversity Observation Network (MBON) projects described here, quantitative polymerase chain reaction (qPCR) and metabarcoding have been combined with so-called next generation sequencing. On the right are the primers used by the project with a representation of the range of organisms they detect. More detail can be found in the Materials and Methods section. The eDNA droplet was designed and illustrated by Kevan Yamahara. > High res figure
|
A variety of methods can be used for analyzing the extracted DNA in order to identify the presence of the full gamut of taxonomic groups representing life in the sea. These methods were first developed in the early 2000s, primarily driven by explorations of microbes in humans (e.g., gut microbiome) and in the surrounding environment (Cristescu and Hebert, 2018). Marine microbiologists were the first in the oceanographic community to be driven to molecular methods in order to: (1) identify and study microbes that, because of their high diversity, the difficulty isolating and culturing them, and their small sizes (less than a micron), made them impossible to characterize using other techniques, and (2) study their metabolic processes using environmental RNA. This methodology transformed the field of marine microbiology (Scholin et al., 2017). The advent of next generation nucleic sequencing in the middle of the first decade of this century accelerated progress in the field (Cristescu and Hebert, 2018). Years later, it was realized that the presence of higher taxa (i.e., vertebrates) could also be detected from eDNA (Thomsen et al., 2012).
Current analytical techniques for eDNA fall into two broad categories: (1) those that target a species directly (e.g., via quantitative polymerase chain reaction, or qPCR, to detect a genetic signature of a specific organism), and (2) those that use metabarcoding to target broad groups of taxa (e.g., bacteria, phytoplankton, invertebrates, vertebrates) (Figure 2). In metabarcoding, short but highly variable portions of a gene (200–400 base pairs) are targeted. The variable target region is located between two highly conserved regions where short segments of eDNA referred to as primers bind and, through PCR, allow the highly variable region to be replicated. The products can then undergo high-throughput sequencing. Following sequencing, bioinformatics software modules are used to quality control the data, identify unique sequences (amplicon sequence variants, ASVs), and then assign taxonomy to the ASVs using information available from genetic databases (see Materials and Methods). The final output for each sample is a list of ASVs detected, their associated taxonomy, and the number of times that the ASV is annotated (number of reads). There is a wide and almost unlimited variety of primers available for use in this workflow; the MBON demonstration projects have focused on four: 16S for microbes (Quince et al., 2011; Parada et al., 2016), 18S targeting phytoplankton (Amaral-Zettler et al., 2009), mitochondrial cytochrome-c-oxidase subunit I (COI) targeting invertebrates (Leray et al., 2013; Folmer et al., 1994), and 12S targeting vertebrates (Miya et al., 2015) (Figure 2). In this paper, we limit our analysis and presentation to results from the 18S, COI, and 12S primers.
The “eDNA Wheel”
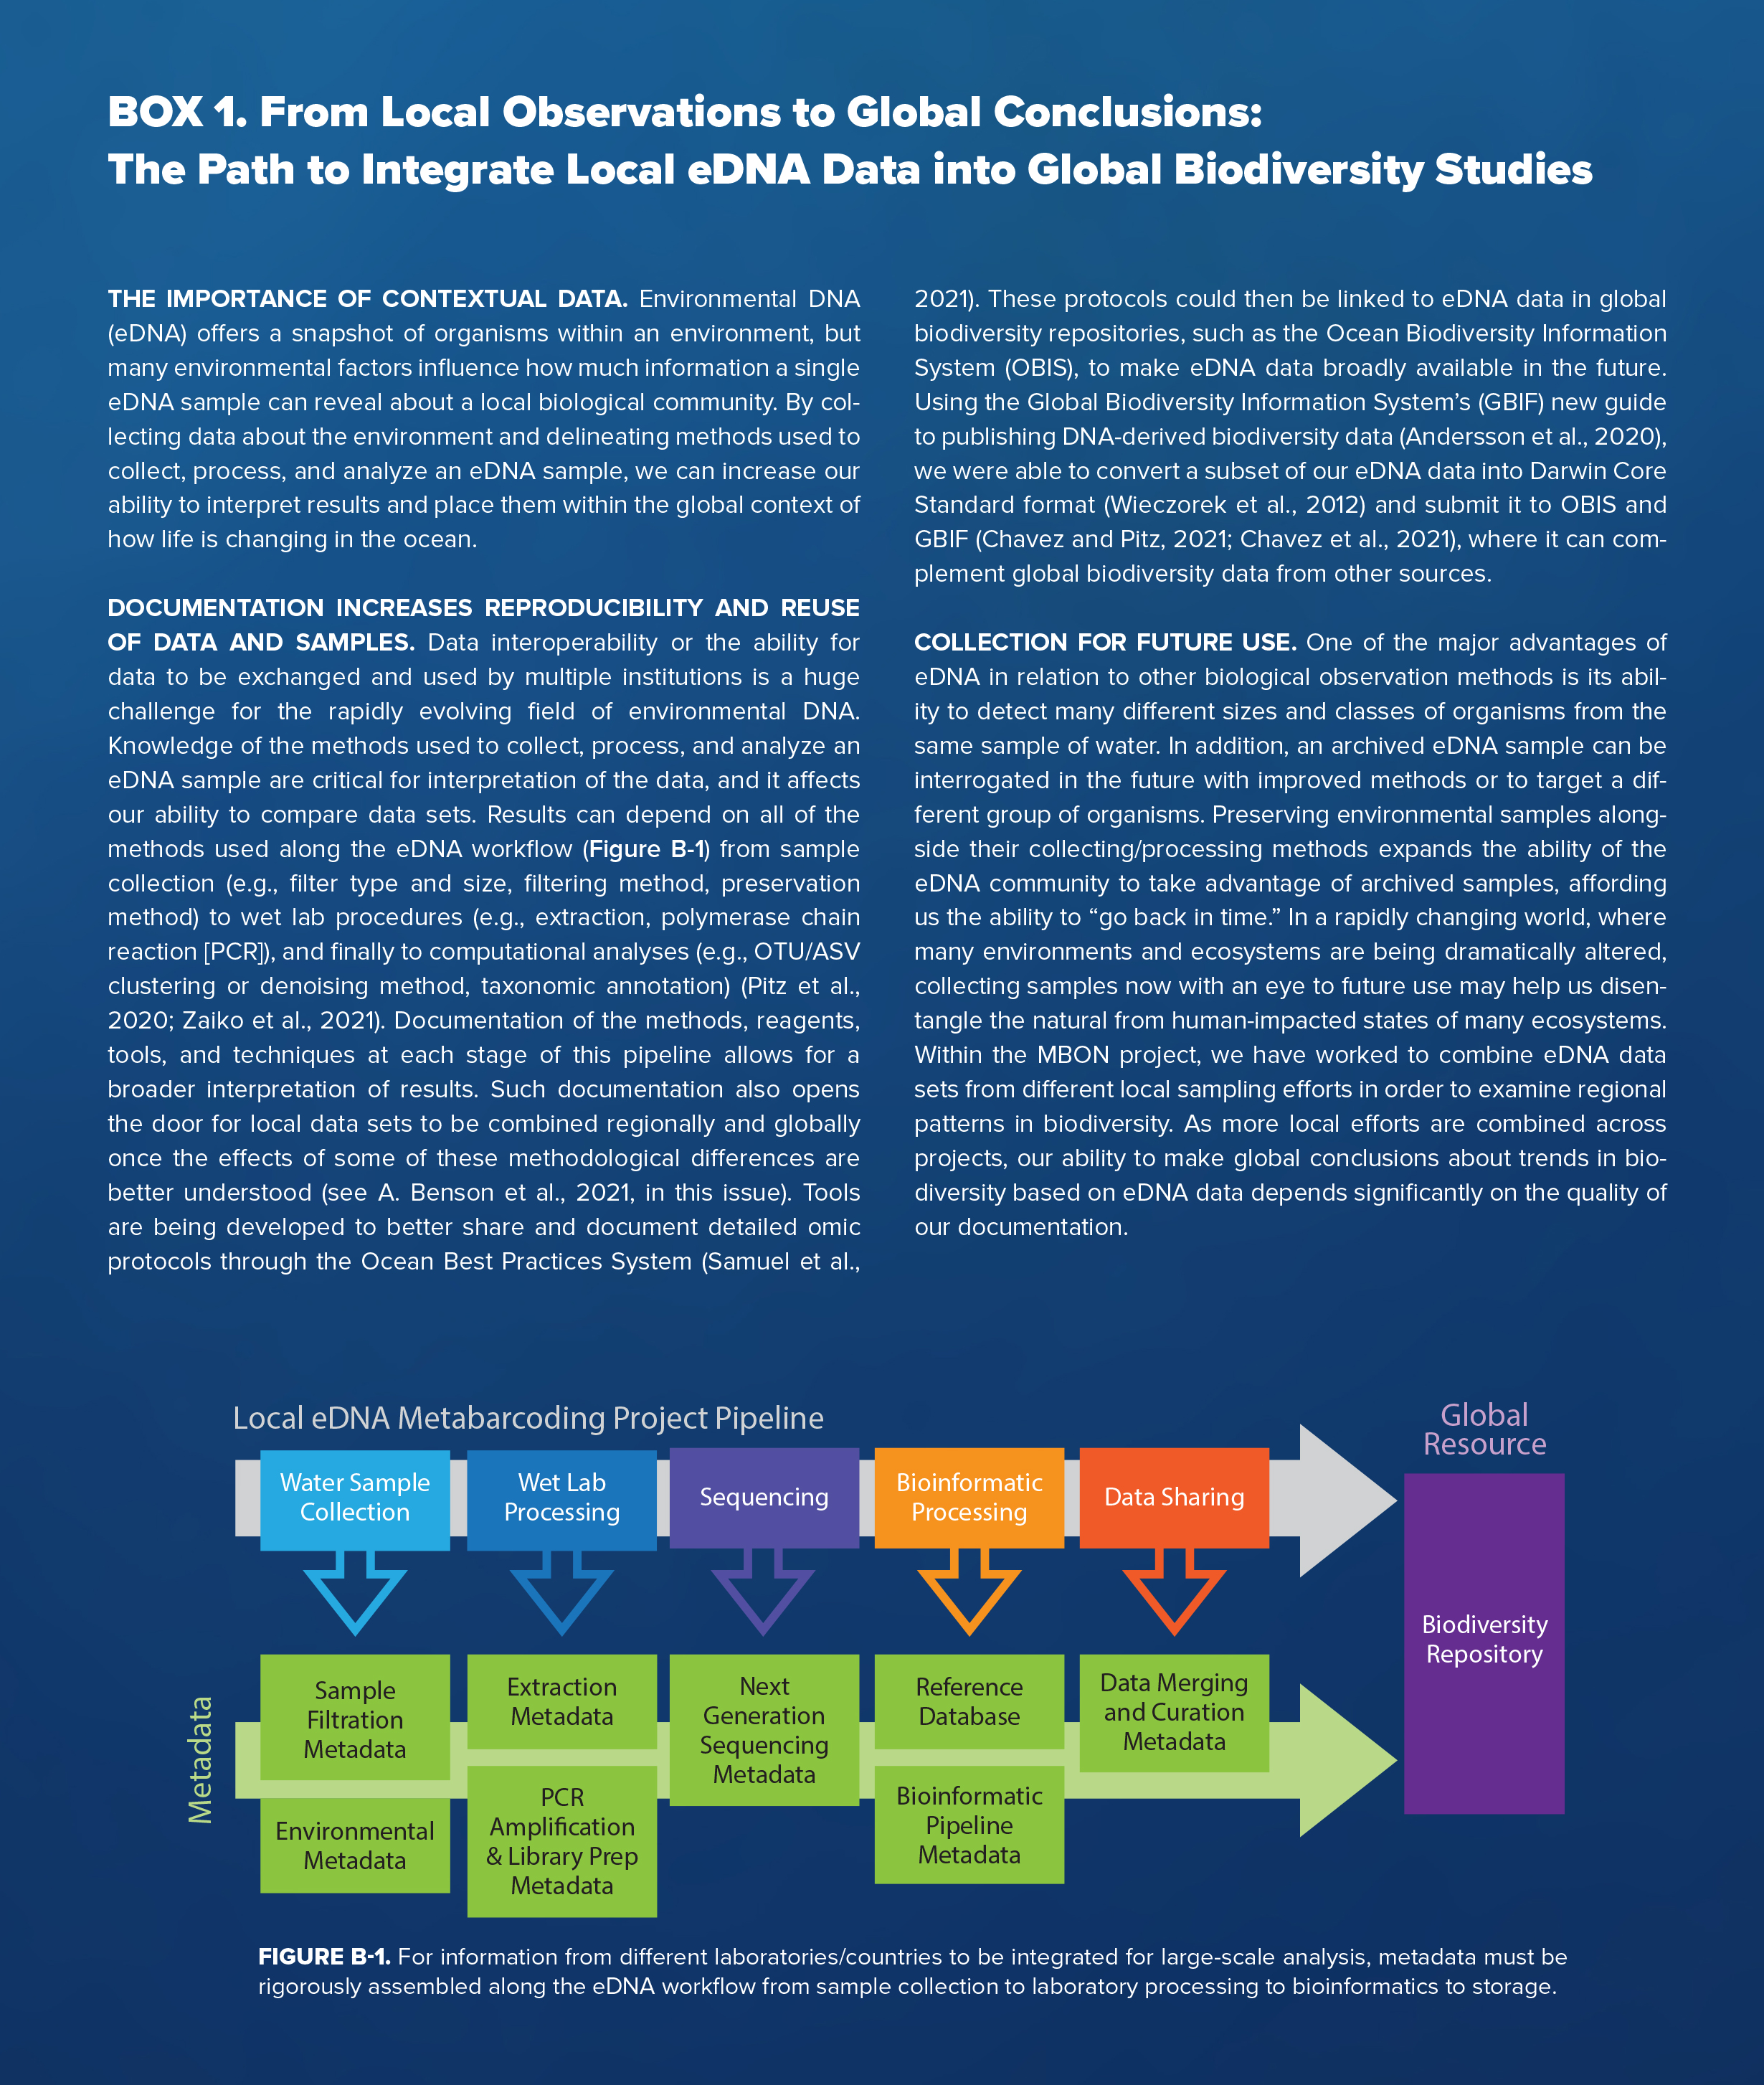
Environmental DNA is rapidly becoming an important tool that biologists and oceanographers use to survey marine biodiversity (Figure 3; Bohmann et al., 2014; Thomsen and Willerslev, 2015; Deiner et al., 2017). Figure 4 illustrates an “eDNA wheel” that describes the iterative process of an evolving portfolio of tools and techniques that is catalyzing innovation and driving the field forward. After sample acquisition, the material is processed in the laboratory before it is analyzed locally or sent to a sequencing facility. As noted above, sequencing returns a large data file that undergoes bioinformatic processing, ultimately generating information that is used in the types of assessments described below. It is critical to document metadata associated with each step along this workflow so that information from different programs can be compared, integrated, and synthesized in the context of environmental variables (Box 1).
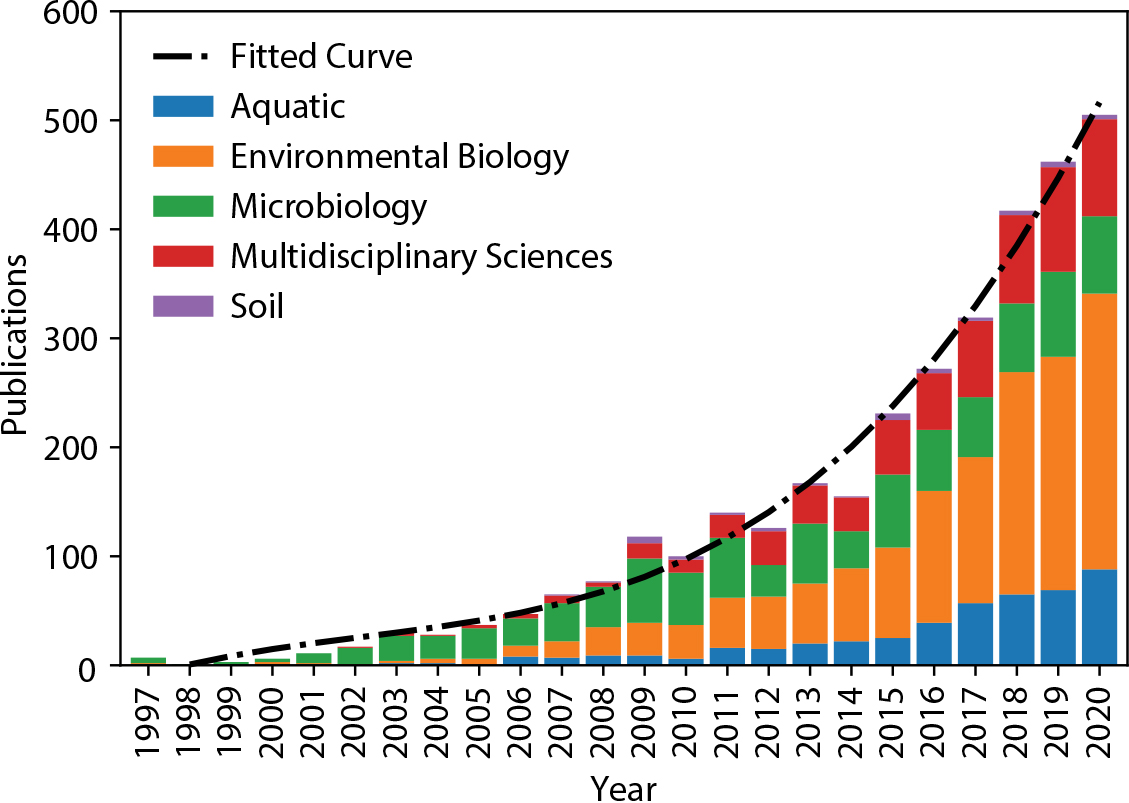
Figure 3. Publications from a search of the Web of Science within environmental domains papers using the words “environmental DNA” or “eDNA.” Publications have increased exponentially in recent years, demonstrating the growing popularity of this method for marine science and conservation. > High res figure
|
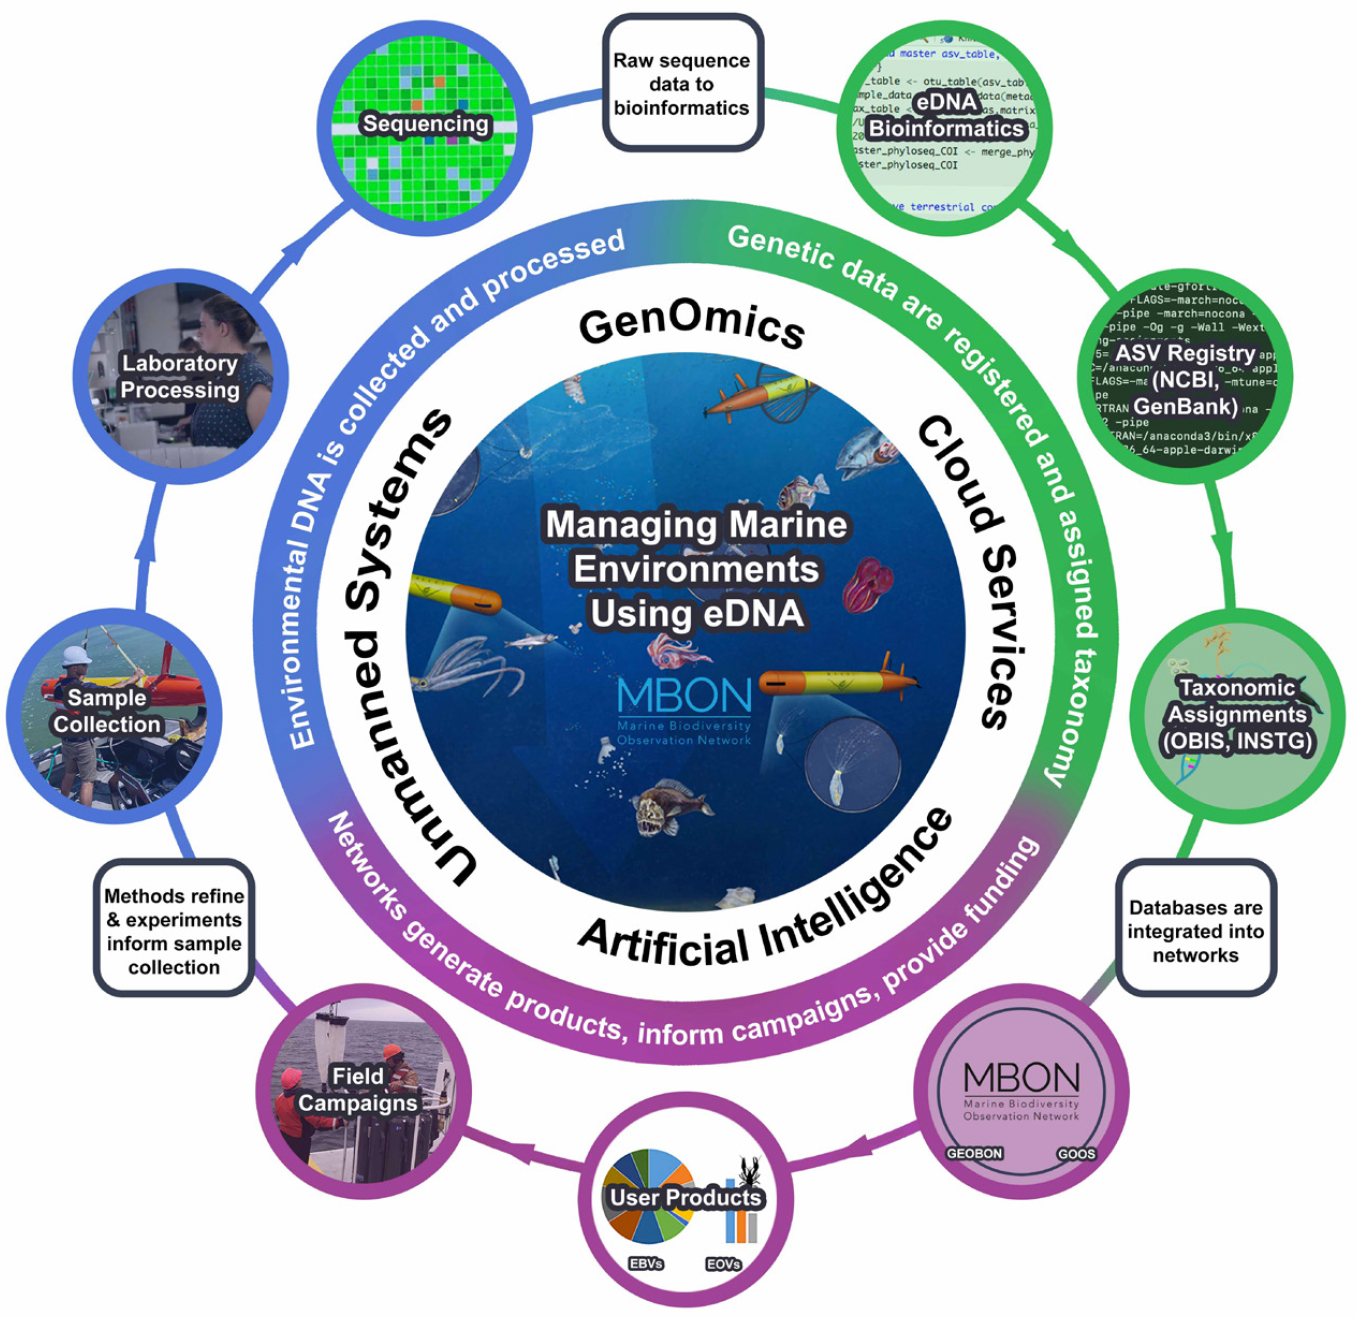
Figure 4. The cycle known as the “eDNA wheel” starts with the collection of new samples and moves to processing with evolving laboratory and bioinformatics methods, then feeding of databases that are analyzed to develop products to be used for scientific, management, and conservation purposes. The information gleaned aids in generating new and improved field sampling campaigns that in turn stimulate further innovations in techniques used in the laboratory, in the bioinformatics pipeline, and in data management and product generation systems. With each cycle, every aspect of the eDNA workflow becomes more efficient and standardized, providing a framework for global coordination and participation. > High res figure
|
While data repositories for the raw sequences, driven by the publication process, are available and used routinely (e.g., the International Nucleotide Sequence Database Collaboration; A. Benson et al., 2021, in this issue), repositories for ASVs and associated taxonomic assignments are presently in design and build stages. MBON programs currently have their own data handling systems and analyze the information generated for scientific as well as resource management purposes. The products derived serve to inform new observing campaigns, closing the wheel. Each step of this process evolves and improves over time, eventually leading to a global and operational eDNA monitoring system as a key cornerstone of a comprehensive ecosystem observation network. This effort will accelerate with the recent establishment of an Ocean Biomolecular Observation Network (OBON) in support of the United Nations Ocean Decade for Sustainable Development. In addition to improving eDNA collection, analysis, and information management methods, there is an urgent requirement to enhance the current reference libraries that are used to assign taxonomy to ASVs. The number of “dark taxa”—species whose sequences are not in reference libraries—is great; a large proportion of the ASVs detected in our samples could not be assigned a taxonomy below the level of kingdom or phylum with certainty.
|
The General Distribution of eDNA Concentration in the Marine Environment
The concentration of suspended DNA in the marine environment closely follows the concentration of small planktonic organisms in surface waters (Figures 5 and 6a). In the sunlit surface, where phytoplankton grow and reproduce, total suspended DNA is highest. The vertical profile of DNA concentration closely matches that of particulate nitrogen (as well as carbon and chlorophyll, not shown). At depth, particulate nitrogen (and DNA) is mostly found in sinking surface material and non-photosynthetic microbes (archaea and bacteria) (Arnosti et al., 2019). A similar pattern can be observed in surface waters that extend from the nearshore nutrient-rich California coastal upwelling environment to the less productive waters of the California Current and beyond (Figure 6a; see also Figure 1 for spatial patterns). The “non-living” suspended DNA is found in much lower concentrations, requiring targeted amplification for detection. In some cases, the higher taxa eukaryotic component of eDNA was found to be less than 1% (Stat et al., 2017). In coastal surface waters, phytoplankton comprise the majority of eDNA, and that from vertebrates is often <0.01% of the total. While metabarcoding primers target specific taxonomic groups, they can also amplify off-target regions and species. Vertebrate primers are particularly susceptible to off-target microbial amplification that can overwhelm the signature of the targeted vertebrate groups. Removal of these microbial products before sequencing is required to enhance the quality of vertebrate assays (West et al., 2021).
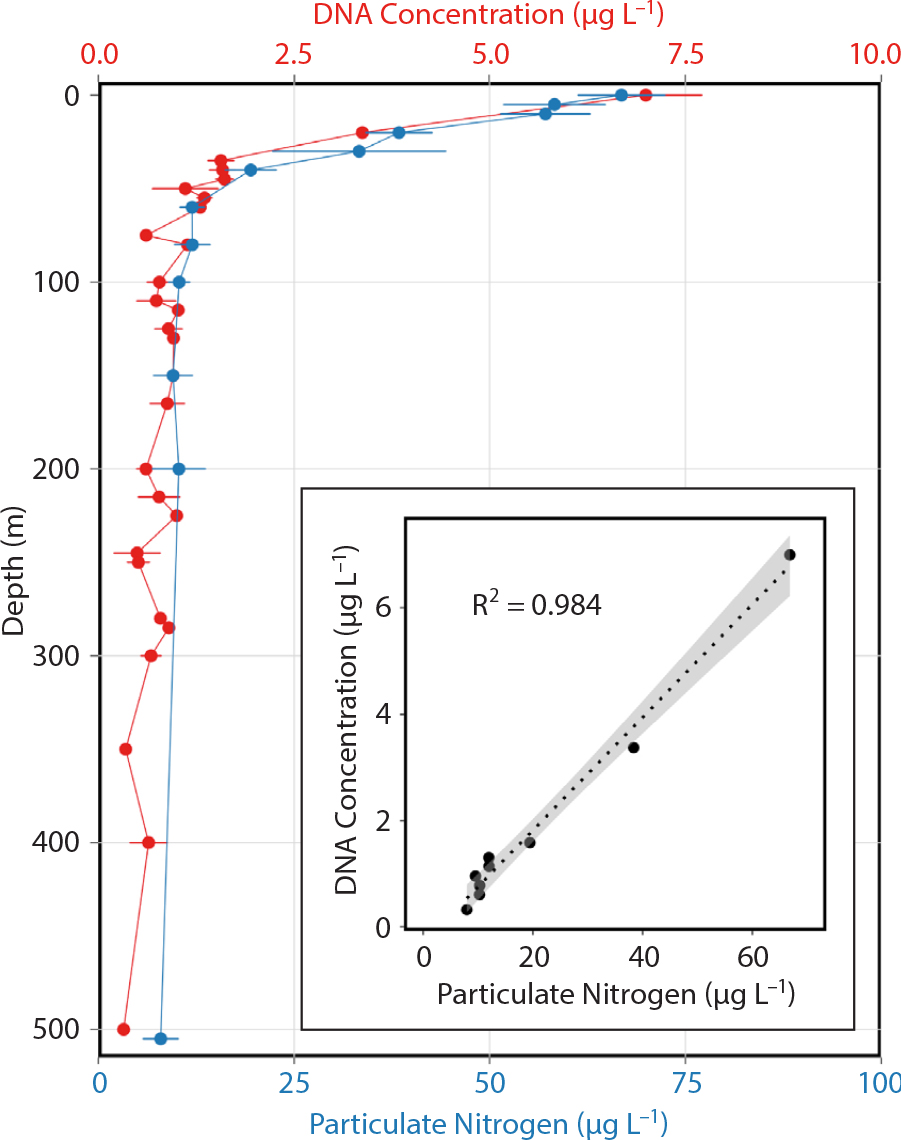
Figure 5. Vertical distribution of suspended DNA and particulate nitrogen concentrations from samples collected in the Monterey Bay region. The profiles were created taking all of the available data for the region and are not from overlapping periods. The two profiles are very similar and highly correlated with each other. > High res figure
|
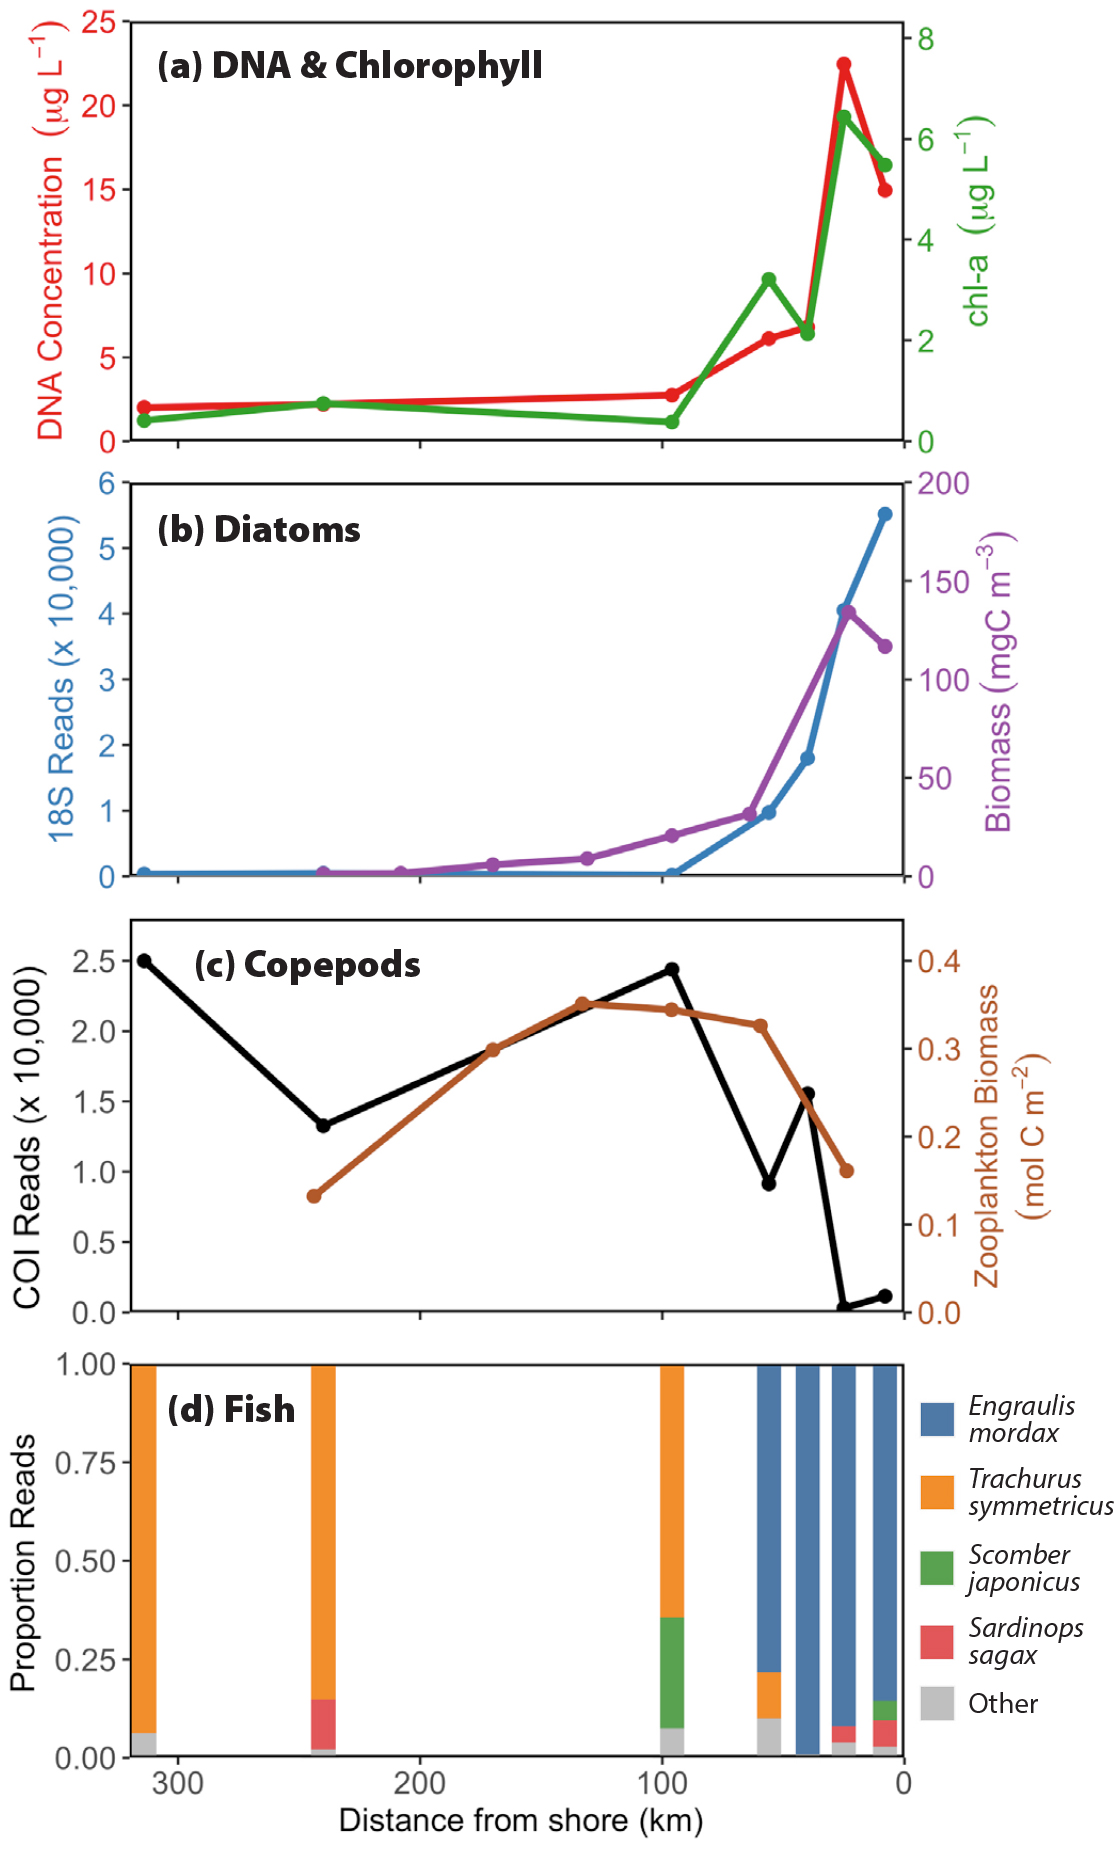
Figure 6. Environmental DNA distributions during the spring upwelling period sampled along California Cooperative Oceanic Fisheries Investigations (CalCOFI) Line 67 from Monterey Bay to 300 km offshore. Panel (a) shows the relationship between extracted DNA concentration and chlorophyll. Panel (b) shows the relationship between phytoplankton biomass estimated from microscopic counts and eDNA reads for diatoms; both follow an expected pattern similar to chlorophyll, given that diatoms are the primary bloom formers under upwelling conditions (Chavez et al., 2017). Panel (c) shows the distribution in the number of copepod reads, low nearshore, and higher offshore. This pattern is characteristic for the Central California region (Messié and Chavez, 2017). The average distribution of zooplankton as sampled by the CalCOFI program using net tows is also included. Panel (d) charts the transition from a nearshore (<100 km) anchovy (Engraulis mordax) dominated region to an offshore one dominated by the oceanic jack mackerel (Trachurus symmetricus), all from near-surface samples. > High res figure
|
The Use of eDNA in Studies of Spatial Distribution
The information used in this paper comes mostly from sample collections made in US National Marine Sanctuaries (NMSs). The bulk of the data is from samples collected in the Monterey Bay NMS, although samples from the Florida Keys, Channel Island, and Flower Garden Banks NMSs were also included (Figure 1) and used in this comparative analysis. The large and complex data sets generated by eDNA metabarcoding techniques can be reduced by using principal component analysis (PCA). PCA condenses the variability of a data set into fewer dimensions that can then be examined through new, uncorrelated variables, or principal components (PCs), simplifying interpretation with minimal information loss. Because DNA sequence data are considered inherently compositional, “robust” variants of PCA have been developed that account for compositionality and sparsity (i.e., the high number of non-detections or “0”s in the data set). Here, we use the Robust Aitchison PCA (RPCA) method developed within the Qiime2 computational ecosystem called DEICODE, which uses Aitchison distance, a compositional distance metric, as well as a form of matrix completion that accounts for high levels of sparsity (Martino et al., 2019). PCA results can be visualized by plotting samples by their PC scores and interpreting clustering patterns using sample metadata. The underlying influence of different taxa on a sample’s PC score can also be examined through “loading scores,” which is the weight of each ASV towards calculating the overall PC score. In this manner, we are able to examine how samples across a data set are similar or dissimilar across a few dimensions, and we can pick out the taxa most responsible for this variability.
When samples are compared across different environments from four different NMSs, samples from cooler and more productive coastal upwelling regions of the US West Coast cluster together (e.g., Channel Islands and Monterey Bay), as do samples from the warmer, more stratified regions of the Gulf of Mexico (e.g., Florida Keys and Flower Garden Banks; Figure 7a,c COI and 18S data sets, respectively). Samples also clustered seasonally within these groups, with samples taken during summer or winter months segregating as highlighted in Figure 7b (COI) and 7d (18S). Across this large data set, patterns of diversity in the unique sequences (ASVs) that were assigned to the same species were also observed. For example, ASVs associated with the abundant haptophyte Emiliana huxleyi display differences in sequence diversity between the upwelling and tropical NMSs (Figure 7e). Large differences in overall community composition across samples from these different regions were also found: Figure 7f–h shows the relative proportions of Hexanauplii (mostly copepods, COI), diatoms (18S), and dinoflagellates (18S) from the upwelling and lower-latitude regions. The black proportion of Figure 7f–h represents the ASVs that have not been assigned to the targeted taxonomic level (genus or family) because there are no closely matching DNA sequences in current genetic repositories. This result highlights the need to improve current genetic libraries, because at times over 50% of the ASVs remained unassigned. Interestingly, a higher proportion of unassigned ASVs are observed in the warmer, lower-latitude regions. These high biodiversity, lower biomass regions appear less represented in genetic repositories. In cooler, lower diversity upwelling regions like those of the West Coast, higher biodiversity is not necessarily a favorable state for that ecosystem. For example, an increase in biodiversity in zooplankton (copepods) is often associated with decreased productivity during warm El Niño years as more nutritious cold-water species are replaced by numerous warm-water-adapted species (Peterson and Keister, 2003).
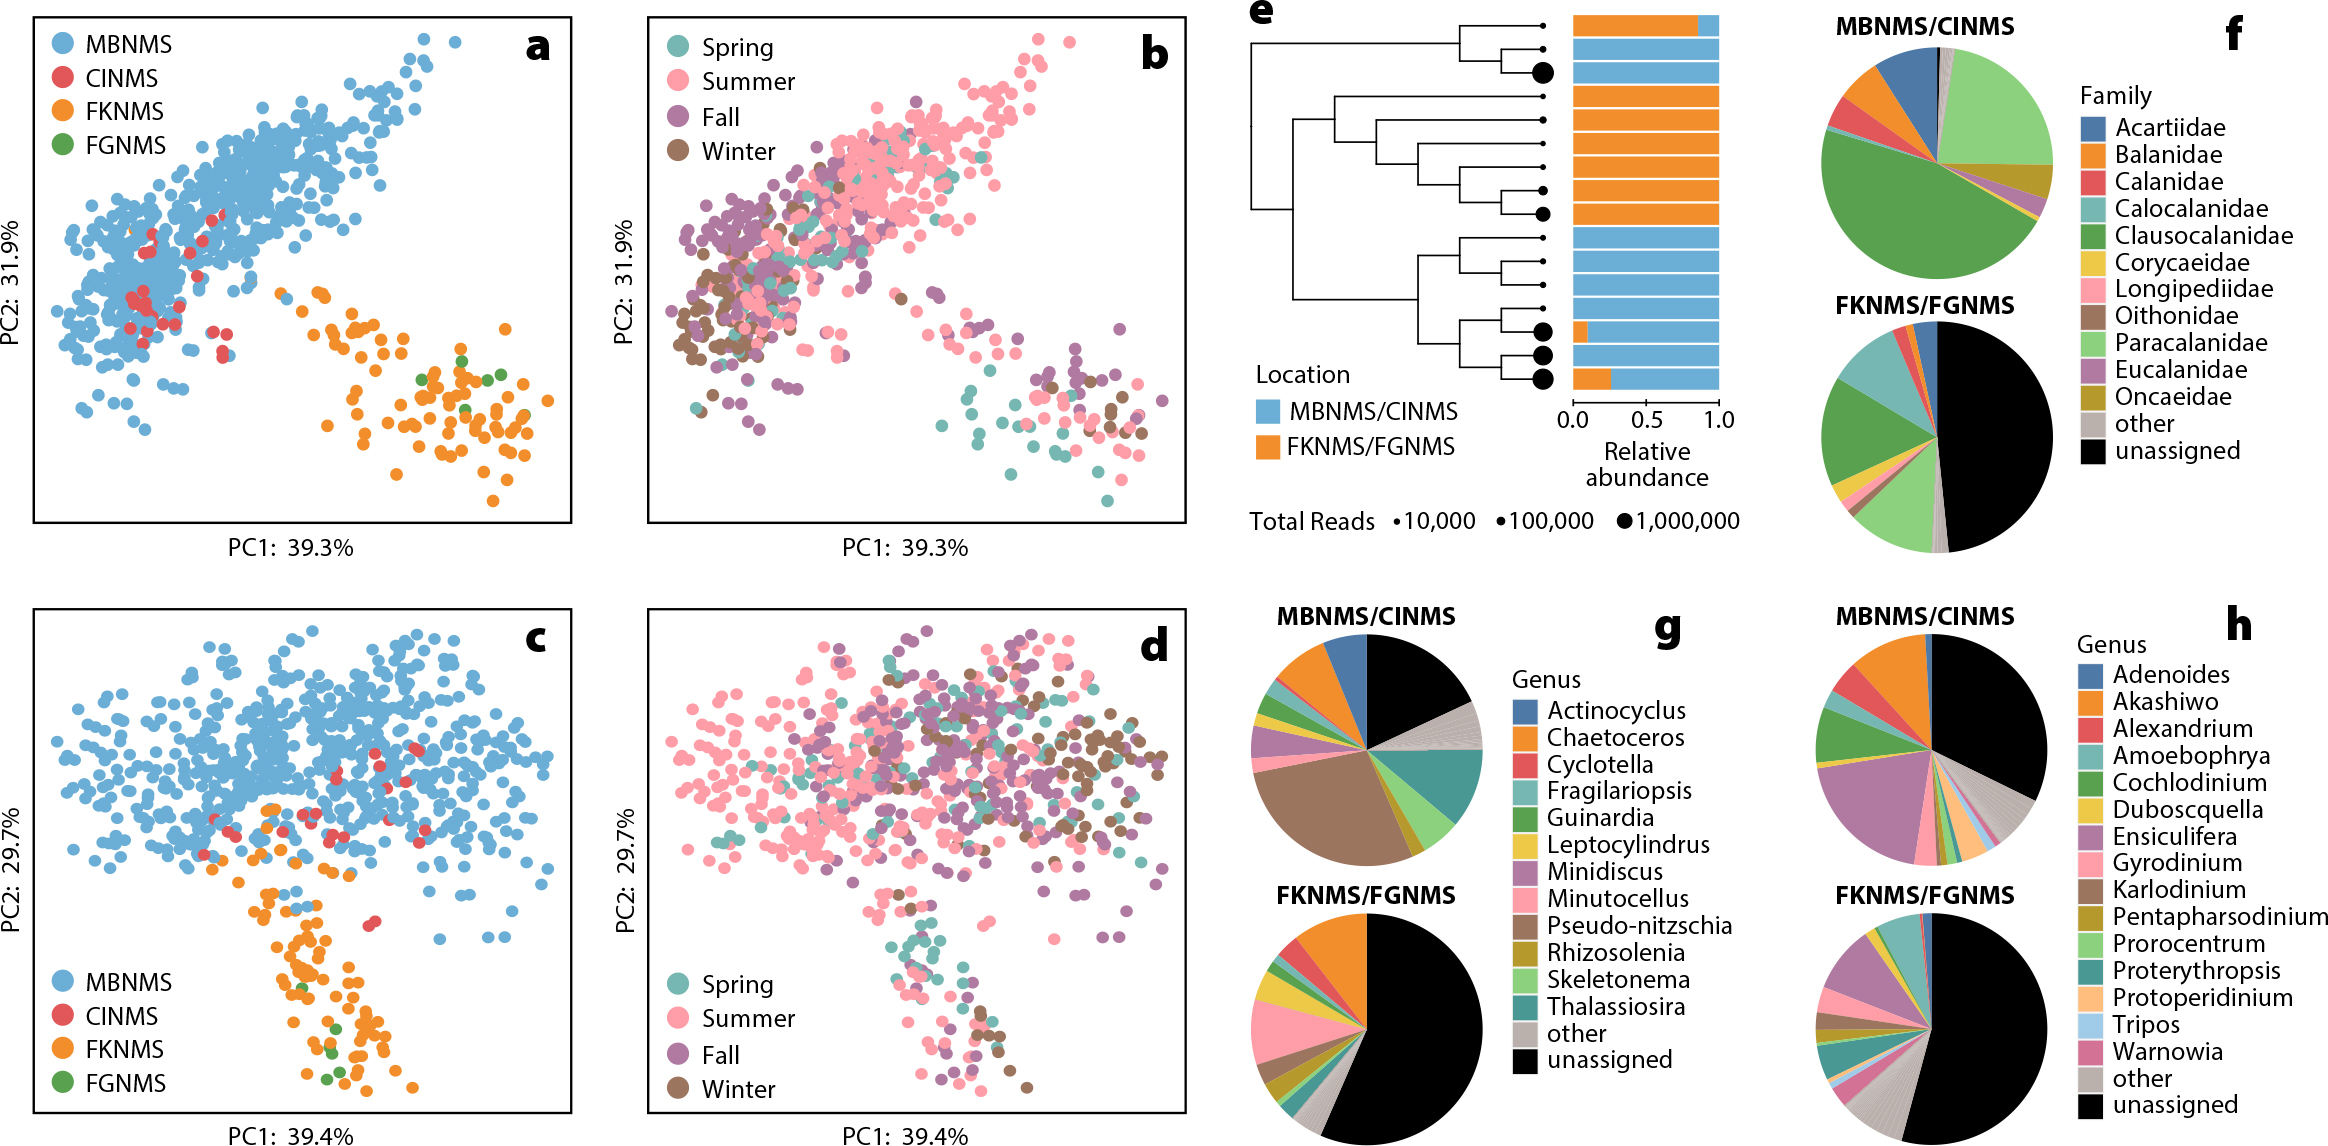
Figure 7. Comparison of samples collected within four US National Marine Sanctuaries; Monterey Bay (MBNMS), Florida Keys (FKNMS), Channel Islands (CINMS), and Flower Garden Banks (FGNMS). Robust Aitchison principal component analysis (RPCA) of surface samples (0–20 m) using mitochondrial cytochrome-c-oxidase subunit I (COI) (a and b) and 18S (c and d) data, showing location (a and c) and seasonality (b and d). (e) Phylogenetic tree and relative abundance information for COI Emiliania huxleyi amplicon sequence variants (ASVs) that were the 10 most abundant E. huxleyi ASVs for either MBNMS and CINMS (blue) or FKNMS and FGNMS (orange). (f) Pie charts showing the relative abundance of different Hexanauplia families detected via COI. (g) Pie charts showing the relative abundance of diatom genera detected via 18S. (h) Pie charts showing the relative abundance of dinoflagellate genera detected with 18S. Note the large number of ASVs not assigned to either genus or family. > High res figure
|
A similar RPCA analysis for vertebrates (12S) failed to pick up the same patterns as the other primers. This was likely the result of the fact that there are few overlapping vertebrate species/ASVs between the cool and warm NMSs (Figure 8). While RPCA has an increased ability to handle sparse data sets, it can still produce a misleading ordination when there is little to no compositional overlap between samples (Martino et al., 2019; Figure 8 and Table 1). Instead, to visualize community-level differences between seawater samples taken in the four test regions (Monterey Bay, Channel Islands, Florida Keys, and Flower Garden Banks), we performed non-metric multidimensional scaling (NMDS) using the R package vegan (Oksanen et al., 2019; Figure 8). NMDS is an iterative algorithm that attempts to accurately represent the dissimilarity between each pair of samples in n-dimensional space; samples in the resulting plot are more dissimilar if they are farther apart (Buttigieg and Ramette, 2015). Before running NMDS, samples were rarefied to 2,000 observations per sample. The dissimilarity between each pair of samples was then calculated using Bray-Curtis Dissimilarity (Bray and Curtis, 1957), a common choice in community ecology that takes into account both the presence and abundance of different species/ASVs in comparing samples. NMDS was able to represent the community composition of our water samples (Figure 8b). As with the RPCA results for the 18S and COI data sets, a visual assessment of the plot indicates that water samples can be separated into two groups, one for Monterey Bay and Channel Islands, and one for Florida Keys and Flower Garden Banks. This result suggests that water samples in the first group are compositionally more similar to each other than water samples in the second group.
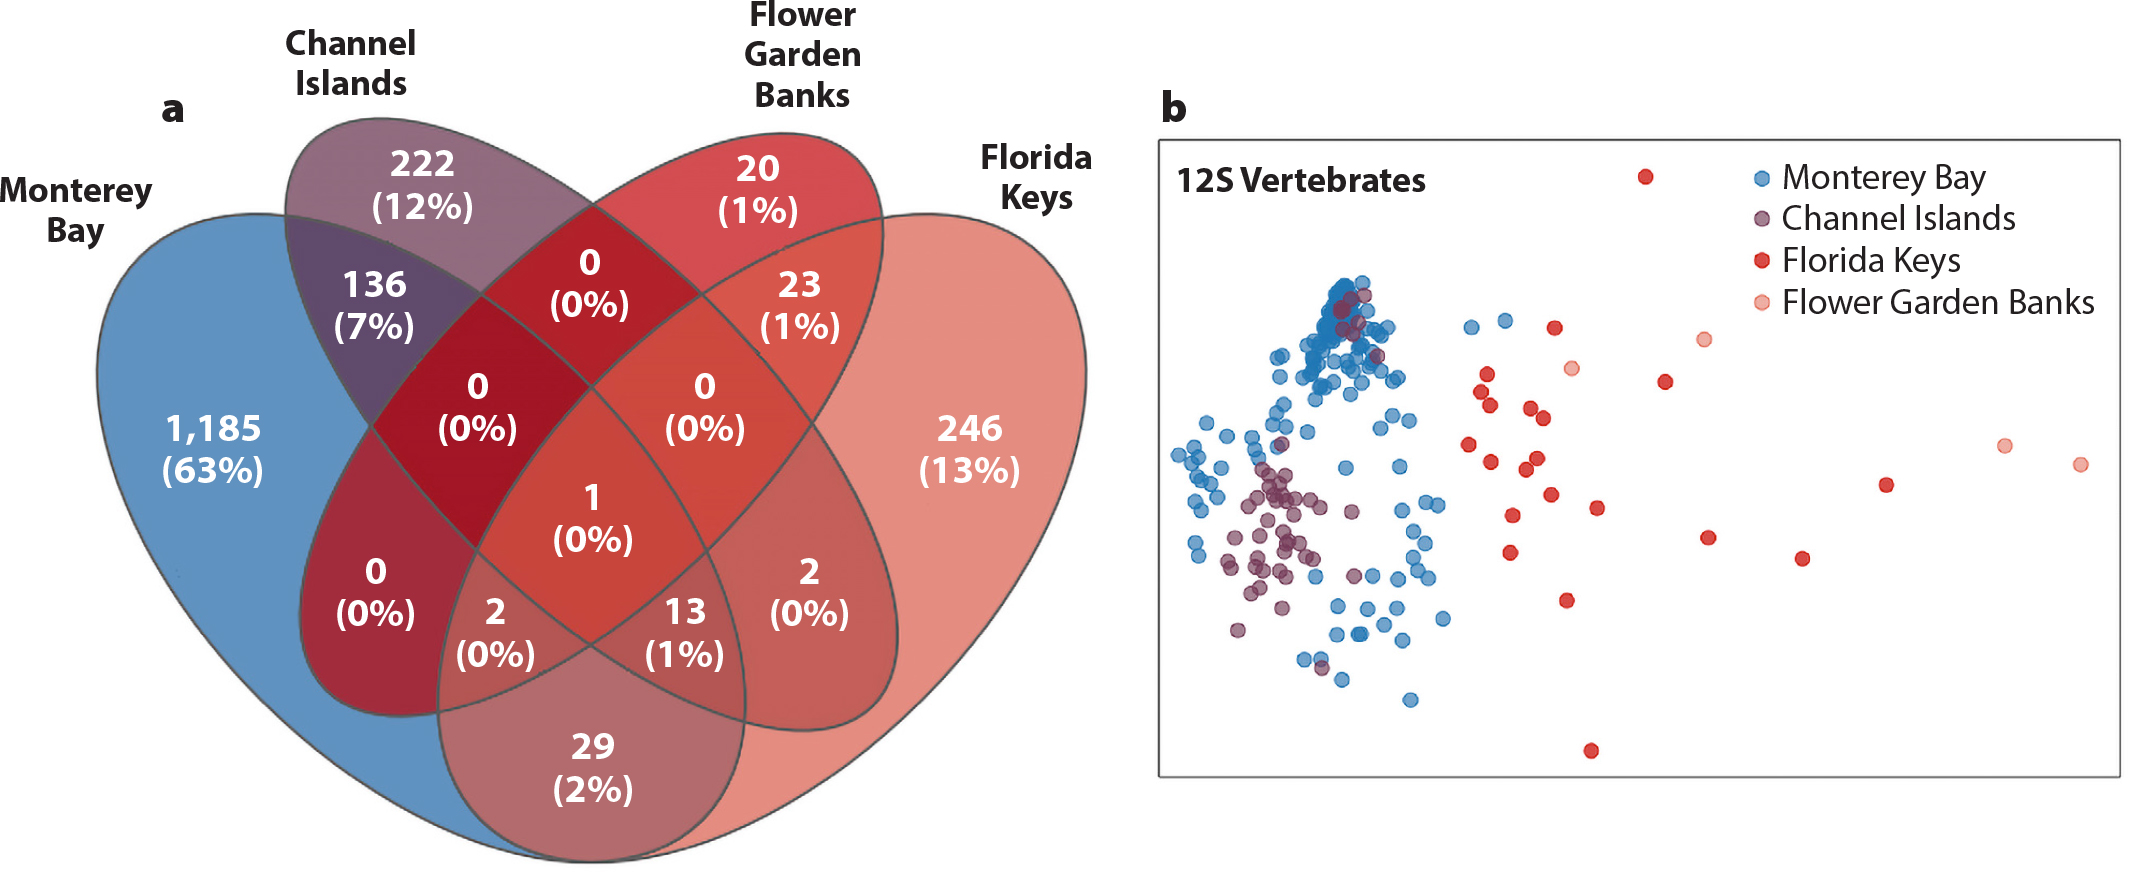
Figure 8. (a) A Venn diagram of the overlap in 12S vertebrate ASVs from all four NMS (Monterey Bay, Channel Islands, Florida Keys, and Flower Garden Banks). The percentage of overlapping ASVs in the Monterey Bay and Channel Islands samples (8%) and in the Florida Keys and Flower Garden Banks samples (26%) is greater than the percentage of overlapping ASVs in any of the other pairwise combinations of regions (0%–3%). (b) The outcome of a non-metric multidimensional scaling (NMDS) analysis of the same data set (stress = 0.16). The plot indicates that water samples cluster into two groups, one for Monterey Bay and Channel Islands, and one for Florida Keys and Flower Garden Banks. > High res figure
|
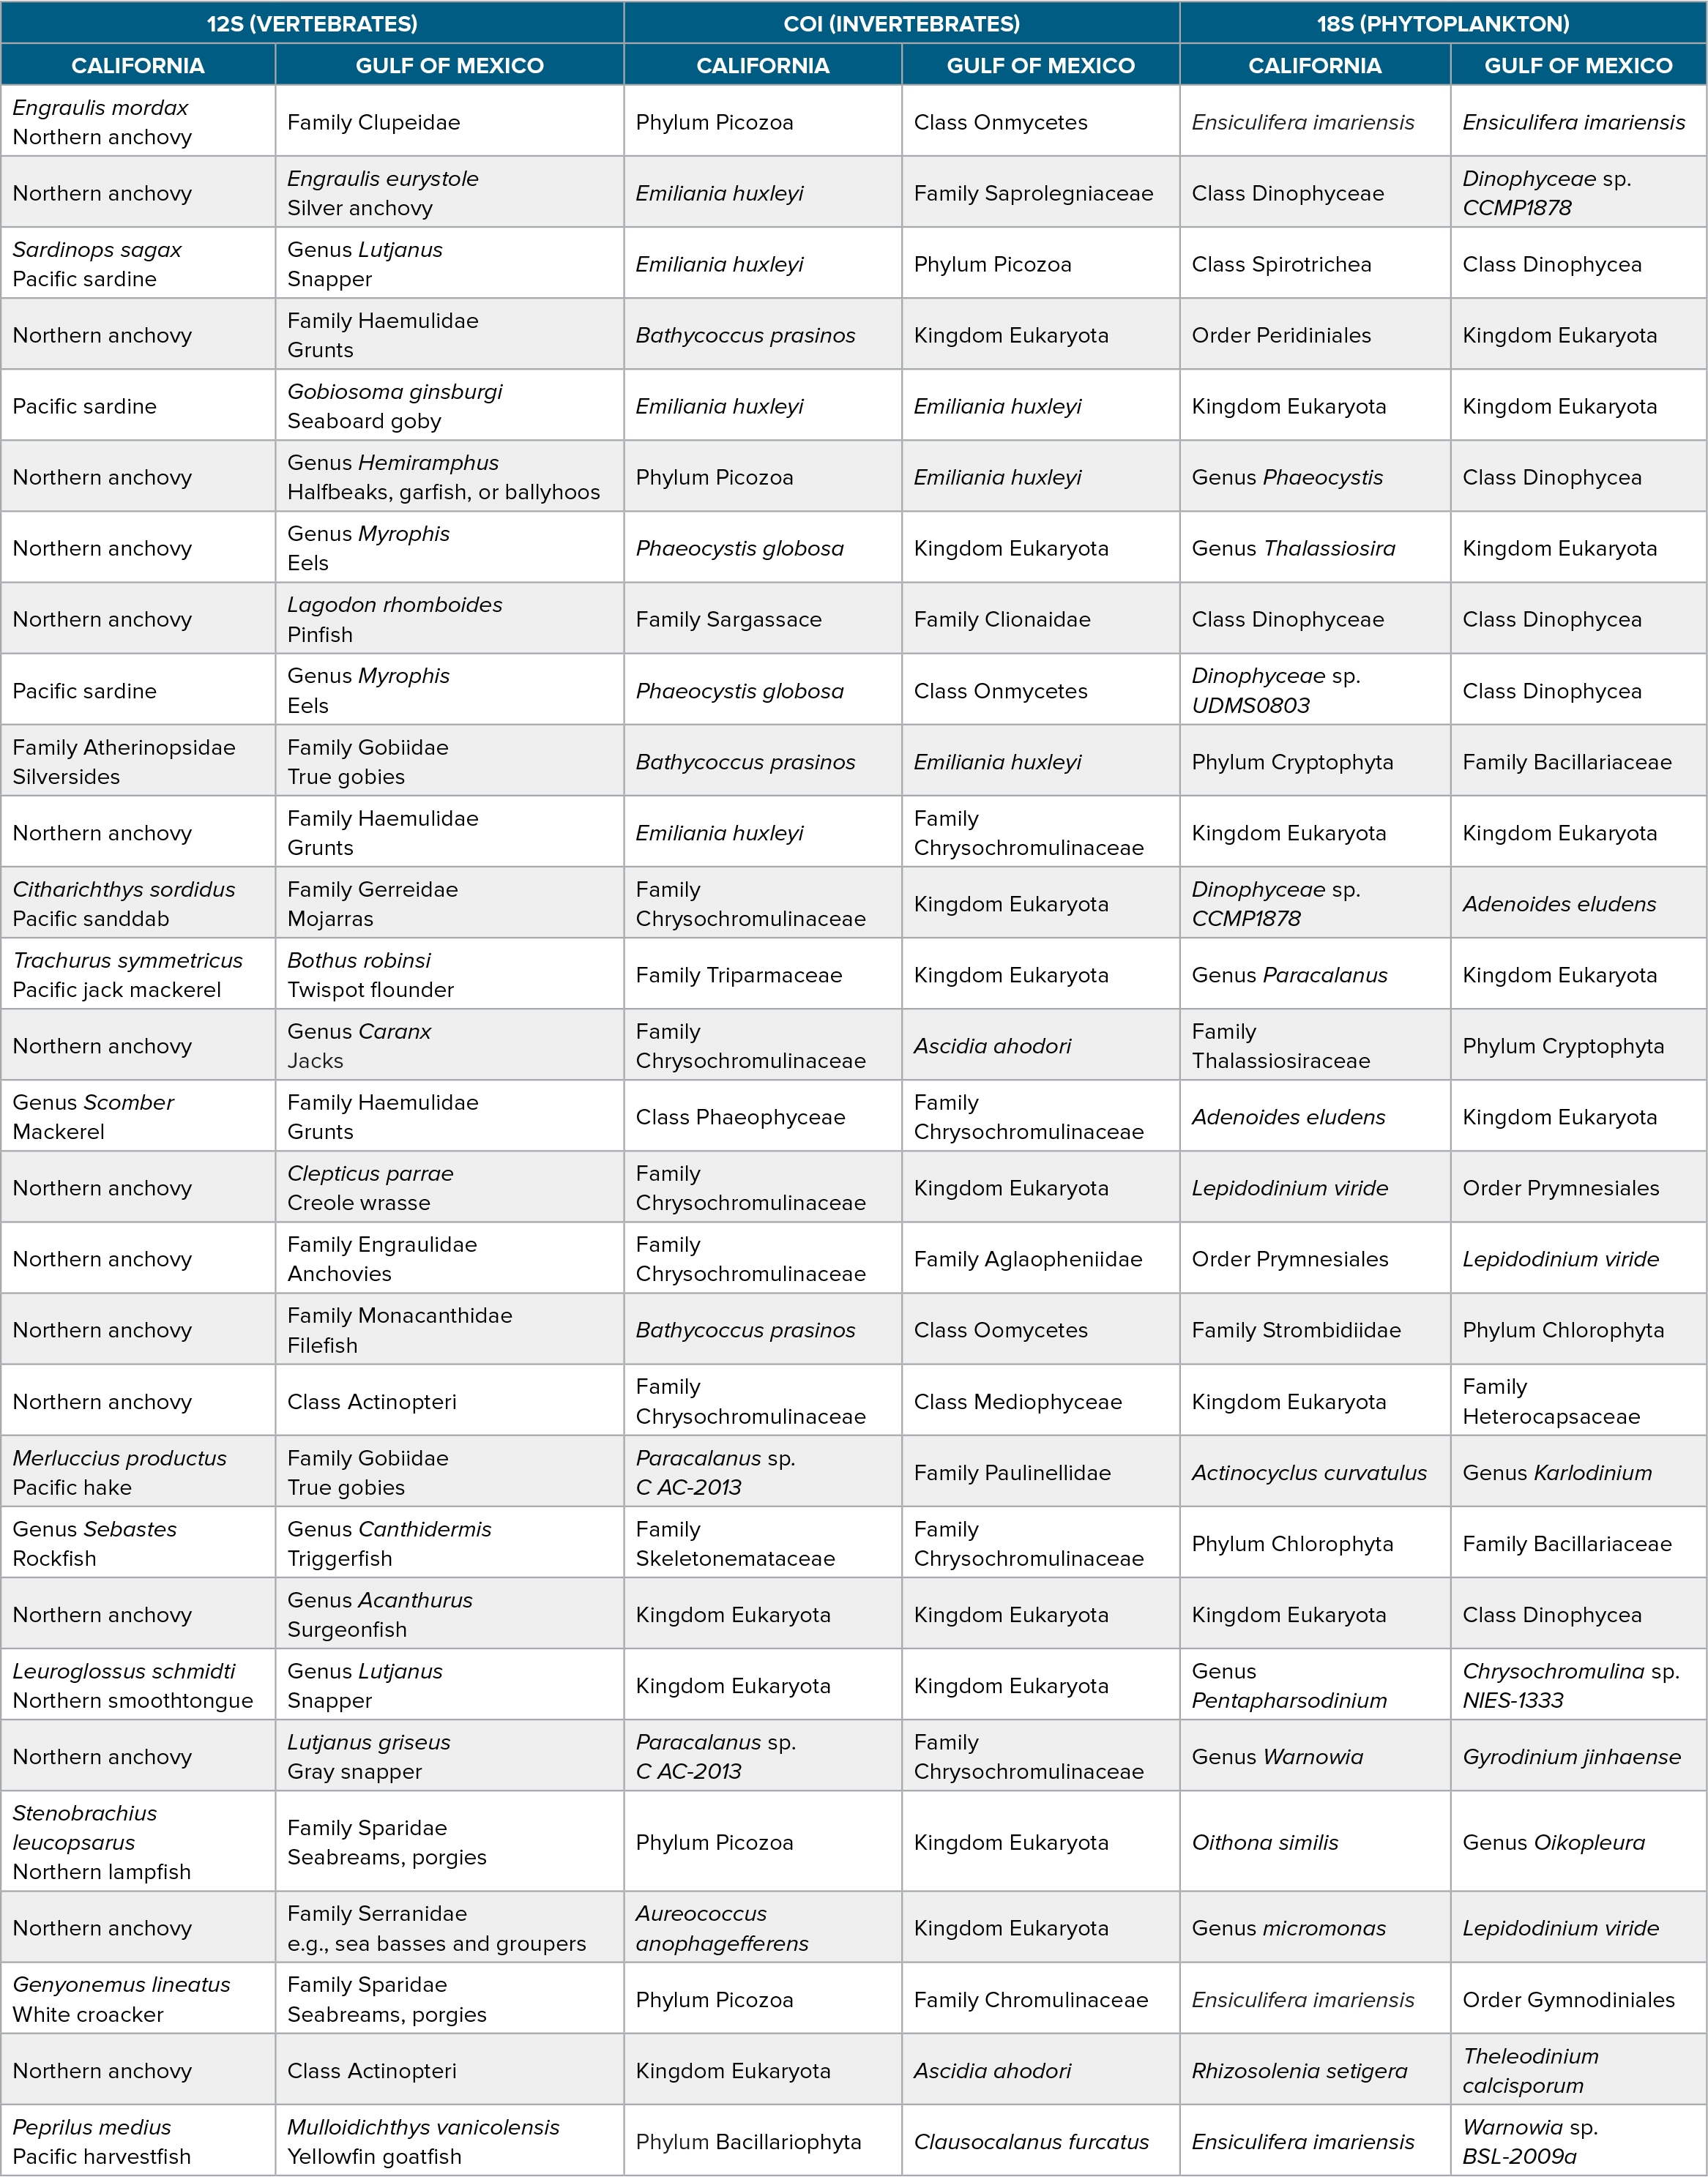
Table 1. The closest taxonomic assignment for the most common amplicon sequence variants (ASVs; determined by percent of occurrence) found in the California and Gulf of Mexico National Marine Sanctuaries for the three primers used in this study. Common names were added to the vertebrate (12S) results. > High res table
|
Finer-scale spatial variations are evident from onshore-offshore transects in the Monterey Bay NMS (Figure 6). This region is characterized by wind-driven coastal upwelling that occurs within the first 25–30 km from the coast and brings deeper, nutrient-rich water to the well-lit surface, where it stimulates phytoplankton photosynthesis and growth. Chlorophyll, a signature of phytoplankton concentration and suspended DNA, is higher nearshore and decreases going offshore as nutrients are consumed (Figure 6a). The dominant phytoplankton in upwelling regions such as Monterey Bay are diatoms (Margalef, 1978; Chavez et al., 2017). Not surprisingly, diatom distribution (as measured by both microscopic counts and by eDNA metabarcoding) shows a pattern very similar to chlorophyll concentration (Figure 6b). The observed pattern for phytoplankton grazers like copepods and euphausiids from net tows taken by the California Cooperative Oceanic Fisheries Investigations (CalCOFI) program shows a broad maximum at the outer edge of the upwelling zone (Messié and Chavez, 2017); this pattern is also captured with eDNA metabarcoding (Figure 6c). The relative distribution of fish species from eDNA along this same transect also follow expected patterns, with the northern anchovy dominating in the nearshore upwelling region and the more oceanic jack mackerel dominating in the offshore regions (Figure 6d).
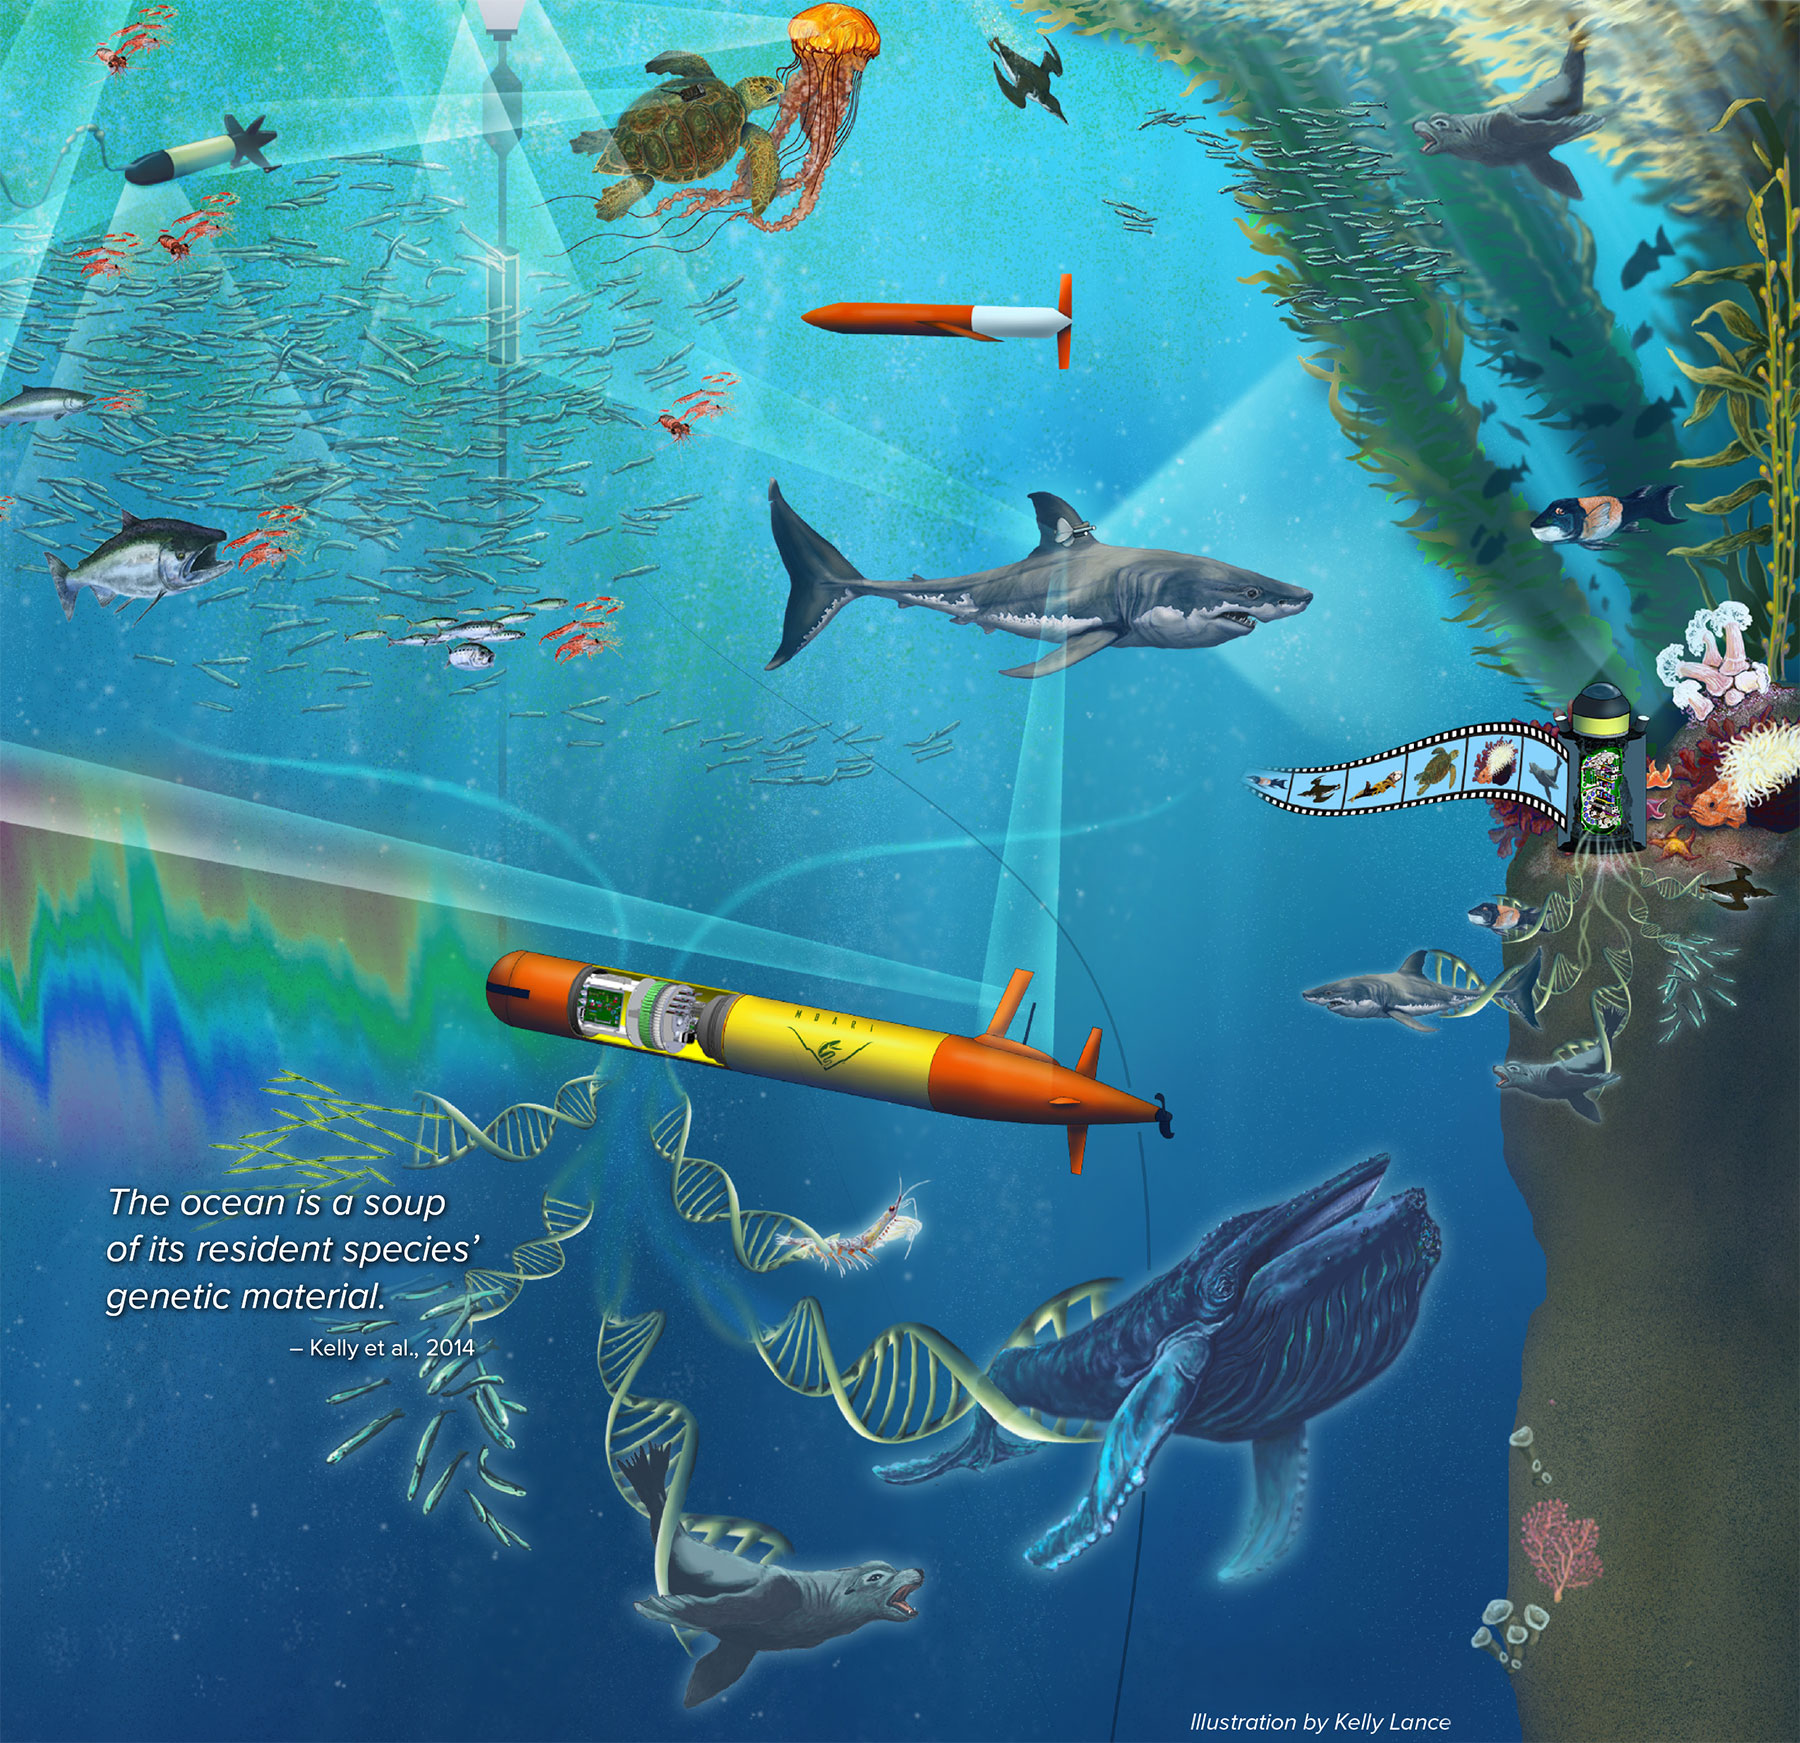
The Influence of Depth on Community Structure
The Monterey Bay and California Current regions have a rich history of eDNA studies, beginning with the seminal paper by Kelly et al. (2014) that describes analysis of bay waters from the Monterey Bay Aquarium open ocean tank containing vertebrate species from the region. Subsequently, there have been studies of kelp bed vertebrate communities in central (Port et al., 2016) and southern (Lamy et al., 2021) California. Several eDNA efforts regarding fisheries surveys are ongoing, including the central California Rockfish Recruitment and Ecosystem Assessment Surveys (Closek et al., 2019). More recently, Djurhuus et al. (2020) analyzed seasonal data from MBARI’s C1 time-series station to identify relations across broad taxonomic groups in waters at the at the mouth of the Monterey Bay submarine canyon.
In this section, we explore changes in communities and individual groups or species with depth as gleaned from eDNA analysis of samples collected in the Monterey Bay NMS. Within both 18S and COI data sets, Shannon diversity and ASV richness are lowest at the surface, with these samples dominated by a smaller number of ASVs (Figure 9). Waters below the euphotic zone (50 m in Monterey Bay) show higher and similar diversity down to 700 m. Samples taken below the euphotic zone were also compositionally more similar to each other than to surface samples. This is likely the result of environmental conditions being relatively uniform below the thermocline; the drivers of the general composition of deep communities are expected to be similar globally (i.e., adaptations to temperature, pressure, food availability). For example, a comparison of COI data from Hawai‘i and Monterey Bay (not shown) indicates that the deep communities from these distant sites are more similar to each other than they are to their respective surface communities. The vertical patterns for 12S, however, are different, with a more uniform distribution of Shannon diversity with depth and less discrimination between depths by community composition. This eDNA homogenization with depth could be driven by: (1) fish and mammals, which are known to vertically migrate over relatively large distances, (2) fish and mammal fecal material, which is heavier and will sink faster with less degradation than the sinking material of smaller phytoplankton and zooplankton, or (3) vertebrate communities, which are less diverse so differences in depth are less detectable by these methods.
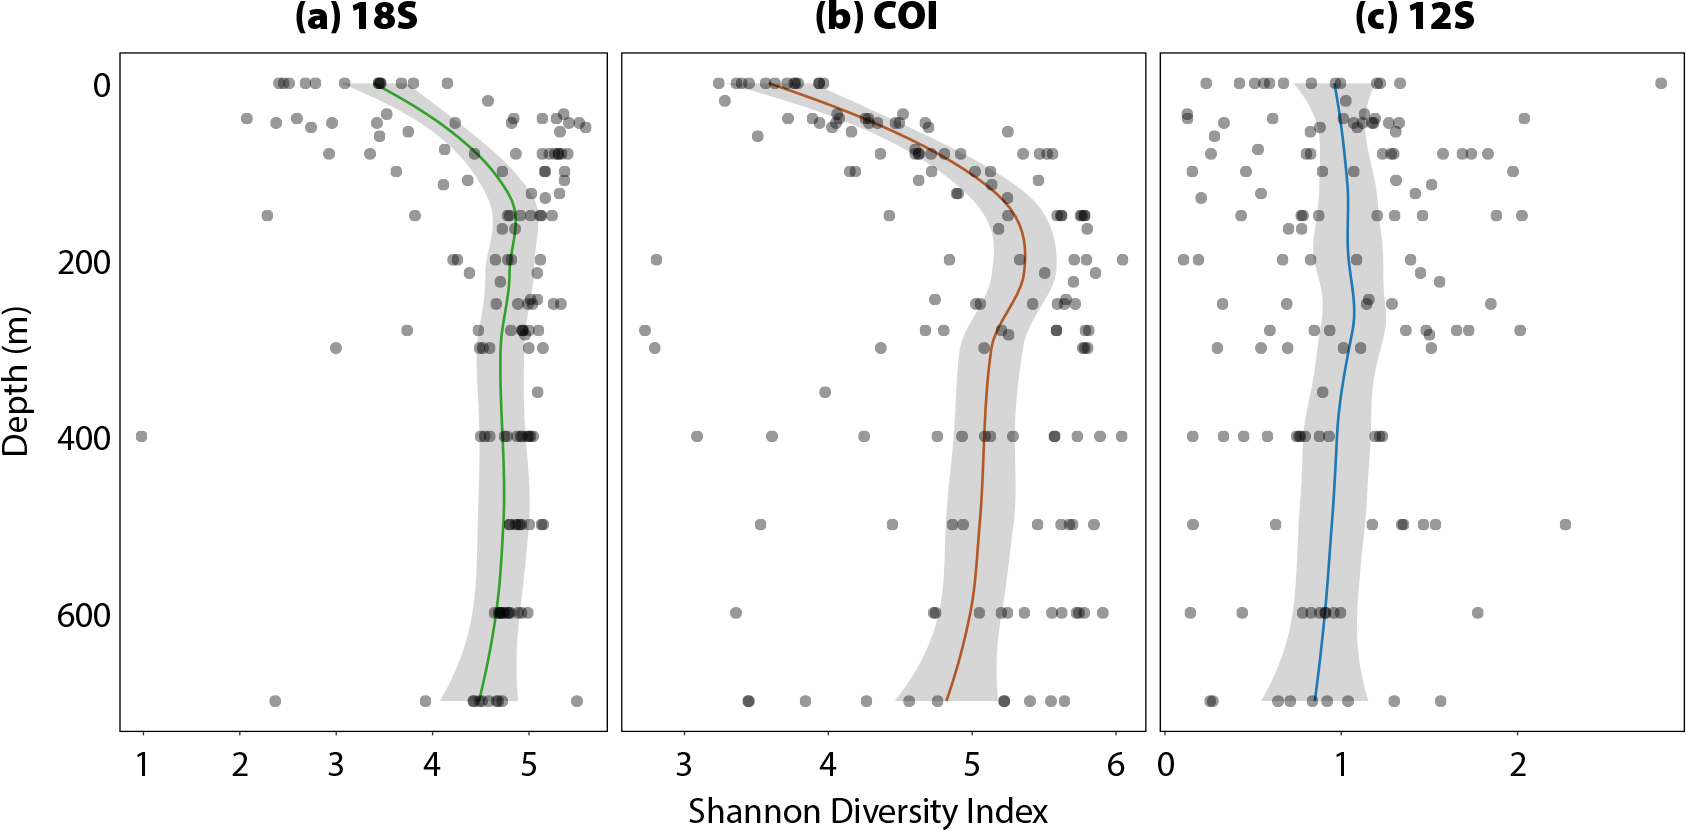
Figure 9. Changes in biodiversity with depth for the three primers used in this paper. Shannon diversity values are plotted for each sample at each depth. A line was fit to the data using the loess method for local regression with the standard error represented by the shaded regions. Within the 18S (a) and COI (b) data sets, lower diversity at the surface is observed, reaching a maximum value around 150 m and remaining similar through the rest of the water column. Within the 12S (c) data set, α-diversity remains similar from surface to depth. Shannon diversity values were calculated from data rarefied to a depth of 2,000 observations per sample. The patterns with or without rarefaction are similar. > High res figure
|
The vertical distribution of key taxa as assessed from eDNA shows patterns that are expected from what is known about their ecology and distribution in Monterey Bay (Figure 10). Diatoms are mostly photosynthetic organisms that dominate surface populations in upwelling regions; their vertical eDNA-read profiles show a surface maximum and a decreasing trend with depth closely matching the mean profile of dissolved oxygen for the region (Figure 10a). The significant number of reads at depth confirms that these organisms are important contributors to the vertical flux of material to the deep sea. The Hexanauplii (mostly copepods), known to graze on phytoplankton (Suzuki et al., 1999), show a similar surface enhancement but with a maximum just below that of diatoms (Figure 10b). This pattern has been observed using other techniques and explained as a strategy to feed where sinking material from the euphotic zone is highest while at the same time remaining in a low-light predation environment (Jackson and Checkley, 2011). The same pattern of surface enhancement observed for diatoms is also seen for the northern anchovy (Engraulis mordax; Figure 10c), a well-known surface dweller that grazes on diatoms and zooplankton (Ryther, 1969; Espinoza and Bertrand, 2008). We have found anchovy eDNA to be prevalent throughout the water column and measured it to depths of 3,000 m. This indicates an unappreciated role of this species in providing nutrition to midwater and benthic communities as well as export of carbon to the deep sea. Two well-known deeper dwelling organisms, Pacific hake and a species of myctophid, show clear eDNA maxima at depth (Figure 10d,e). The vertical distribution of eDNA from these two organisms can be influenced by their extensive diel vertical migrations. The vertical distribution of a common Monterey Bay jellyfish (Aegina sp.) as measured over several decades by video from a remotely operated vehicle (ROV) has also been compared with the number of eDNA reads (Figure 11). The data are highly correlated, with the less dense (a few profiles) eDNA measurements being noisier.
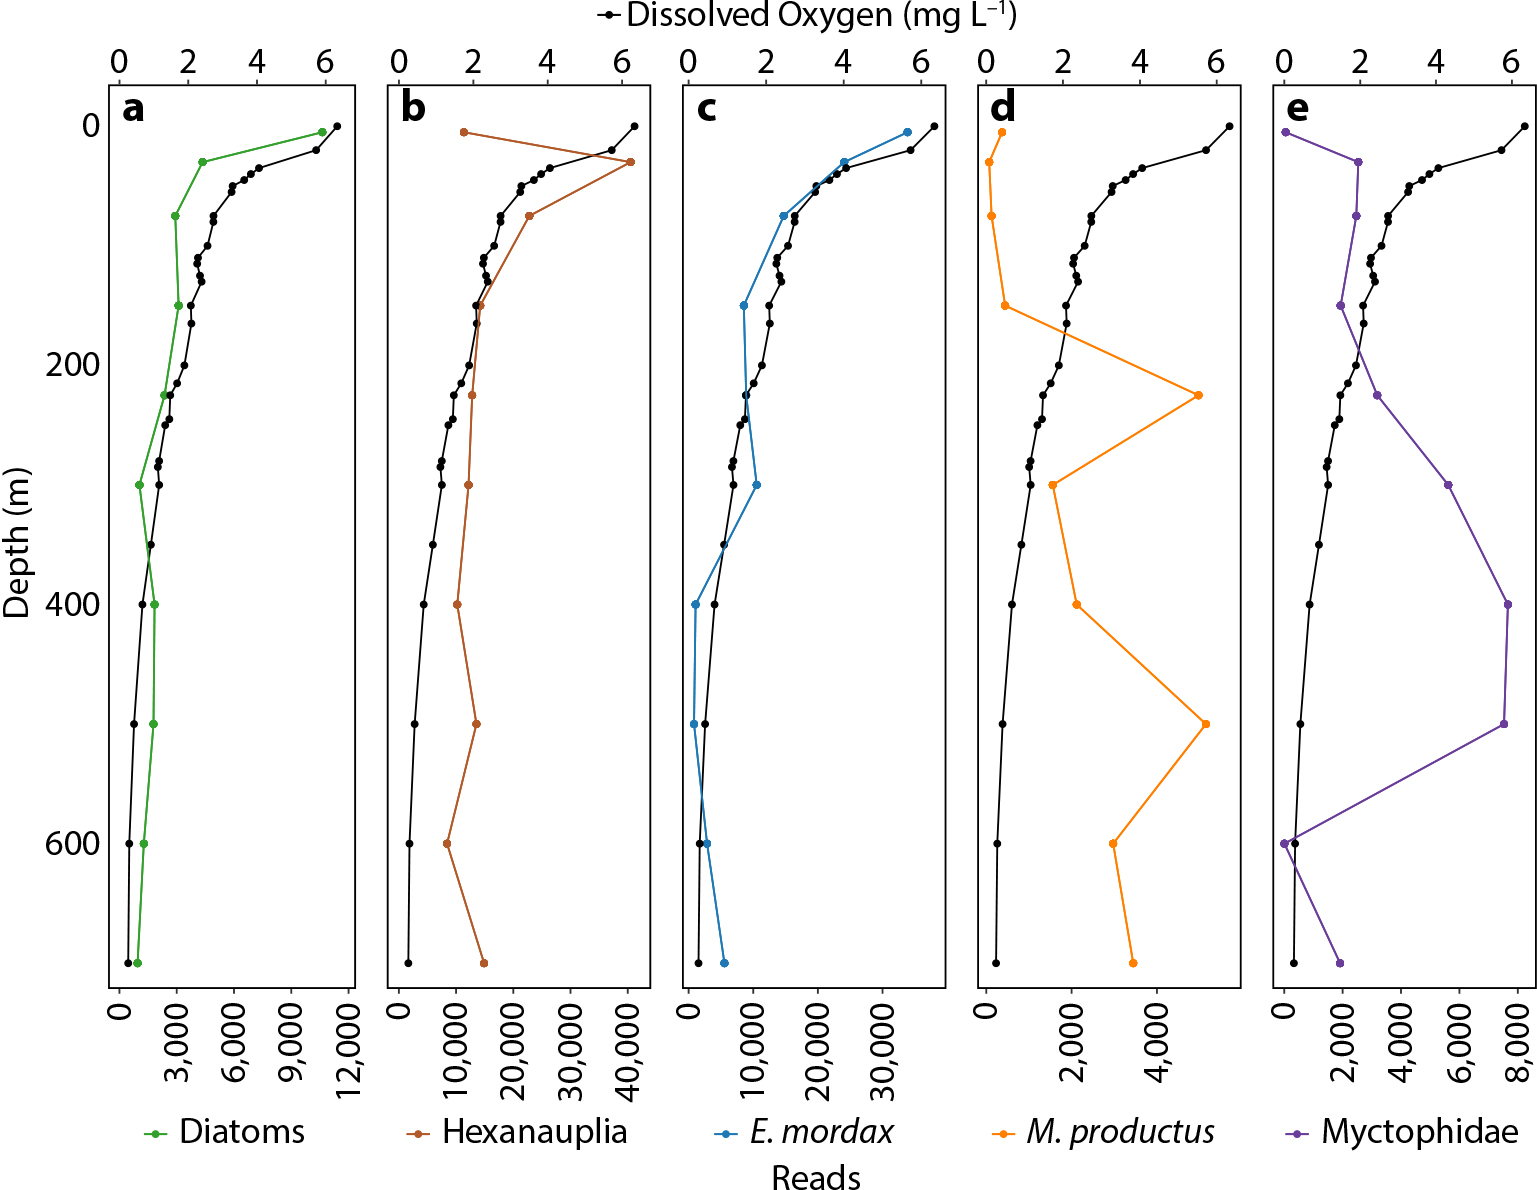
Figure 10. Vertical profiles of eDNA reads for diatoms (a); Hexanauplia (b; includes copepods); northern anchovy (c); Pacific hake (d); and myctophid species (e) compared to dissolved oxygen from the surface to 700 m in Monterey Bay, California. > High res figure
|
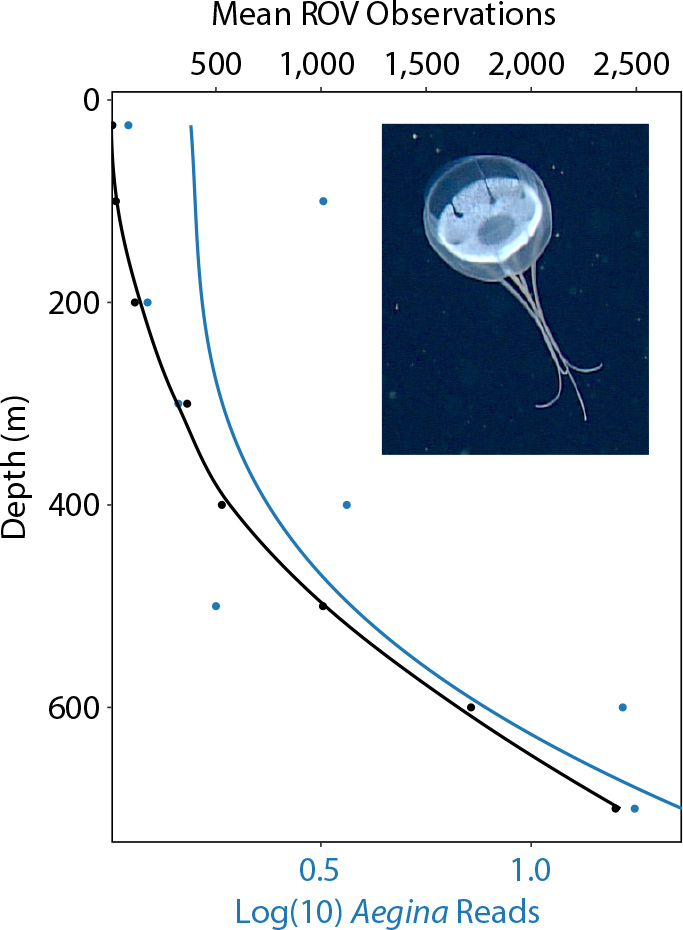
Figure 11. Mean vertical profile of Aegina sp. (jellyfish) over the past several decades in Monterey Bay as estimated from video collected during remotely operated vehicle (ROV) dives (in black) compared with a mean profile from a much smaller number of vertical profiles of eDNA reads (in blue). Lines were fitted to the data using the loess method for local regression for the ROV data and a polynomial regression for the eDNA reads. The fitted line for the eDNA reads have a larger standard error since these data have fewer observations. > High res figure
|
Utilizing eDNA to Detect Change Over Time
The MBON projects began collecting targeted eDNA samples in 2015. Samples collected and preserved for other purposes prior to that date allowed us to develop time series and evaluate changes going back further in time. This sample archeology was motivated by large changes in climate, reflected in sea surface temperature records and changes in the distributions of fish and marine mammals. We noted the appearance of large numbers of whales close to shore and near the MBARI laboratory facilities in 2014–2015, around the time the project started. This appearance was associated with a significant marine heatwave that affected the Northeast Pacific and Monterey Bay (Bond et al., 2015; Chavez et al., 2017). This large-scale marine heatwave was nicknamed “the blob” and was associated with an intense episode of a mode of climate variability known as the North Pacific Gyre Oscillation. A large El Niño immediately followed the blob in 2015/2016 (Chavez et al., 2017). These two climatic phenomena reduced primary productivity for the region overall, leading to a decrease in the size of the productive habitat to a very narrow region nearshore, a process referred to as habitat compression. These climatic disturbances and the associated compression led to a series of ecological consequences, including the entanglement of whales with nearshore crab pots (Santora et al., 2020). Surveys of the region found that the whales were being drawn nearshore by concentrated schools of anchovies. Extending the analysis of eDNA to samples collected before the start of the project, and comparing them with whale watching records and sea surface temperature data, showed a strong association between anchovies, a favored prey for whales, whale sightings, and warmer waters (Figure 12a). Further, we found a strong correlation between northern anchovy eDNA and Monterey Bay anchovy landings (Figure 12b). The record indicates an ecosystem shift from sardine and other bony fish (not shown) to anchovies. The shift is particularly interesting because previous reports showed that anchovies dominated during cooler periods (Chavez et al., 2003). Clearly, eDNA can provide important information about time-varying changes in life in the sea and will be an additional tool for understanding how marine biota respond to global environmental change. Analysis of eDNA from sediment cores has also been used to reconstruct time-varying changes in fish communities over centuries (Kuwae et al., 2020).
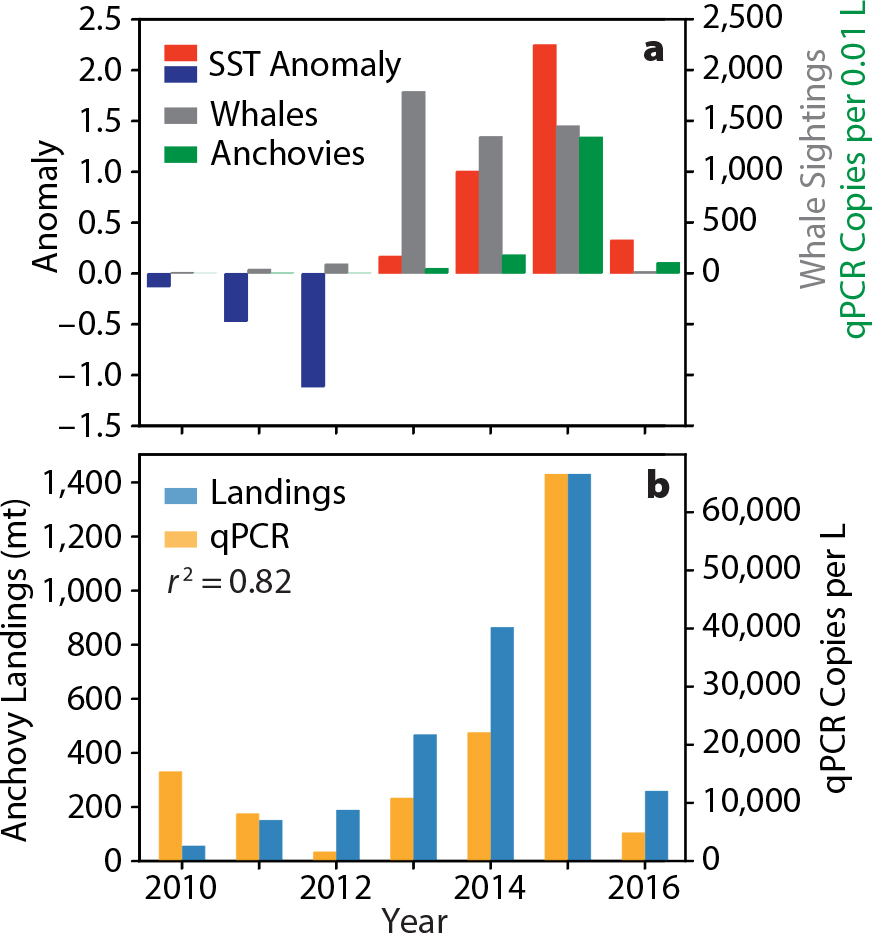
Figure 12. (a) 2010–2016 time series for fall season (August–November) sea surface temperature (SST) anomalies (blue bars, negative; red bars positive; left axis), sum of whale counts by whale-watching vessels (gray bars, right axis), and mean anchovy qPCR copies per 0.01 L (red bars, right axis) at MBARI’s C1 station located at the mouth of the Monterey Bay submarine canyon (Chavez et al., 2017). (b) The plot shows the high correlation between mean annual anchovy landings for Monterey Bay in metric tons (left axis) and mean annual (from monthly samples) anchovy qPCR copies per L (right axis) from the C1 station. > High res figure
|
Another application of eDNA metabarcoding is tracking temporal changes in abundance of harmful algal bloom species. Using data from 18S metabarcoding, we were able to reconstruct a time series of different Pseudo-nitzschia species in Monterey Bay at station C1 from 2008 through 2020 (Figure 13). Certain Pseudo-nitzschia species produce domoic acid, a potent neurotoxin that can cause illness and even death to wildlife (e.g., seabirds, marine mammals) and humans (who consume shellfish that have accumulated the toxin). The time-series data show seasonal and interannual variations in the timing and composition of the blooms. Pseudo-nitzschia australis is the most toxic of the organisms identified by metabarcoding, known to have caused serious toxic episodes in Monterey Bay during 1991, 1998, and 2015 (Buck et al., 1992; Scholin et al., 2000; Ryan et al., 2017). The 2015 episode is clearly resolved in the metabarcoding data (Figure 13). Of the two other Pseudo-nitzschia resolved to the species level, heimii is not considered toxic and fraudulenta is considered a low toxin producer (Bowers et al., 2018). The 2015 event was associated with a marine heatwave and was particularly toxic, purported to result from unusual nitrate-to-silicate ratios (Ryan et al., 2017). Metabarcoding or other molecular techniques offer a distinct advantage over traditional light microscopy in that visually differentiating species of Pseudo-nitzschia is problematic and in some cases impossible without the use of electron microscopy. The variability in species and toxicity shows the difficulties in predicting toxic Pseudo-nitzschia outbreaks year over year.
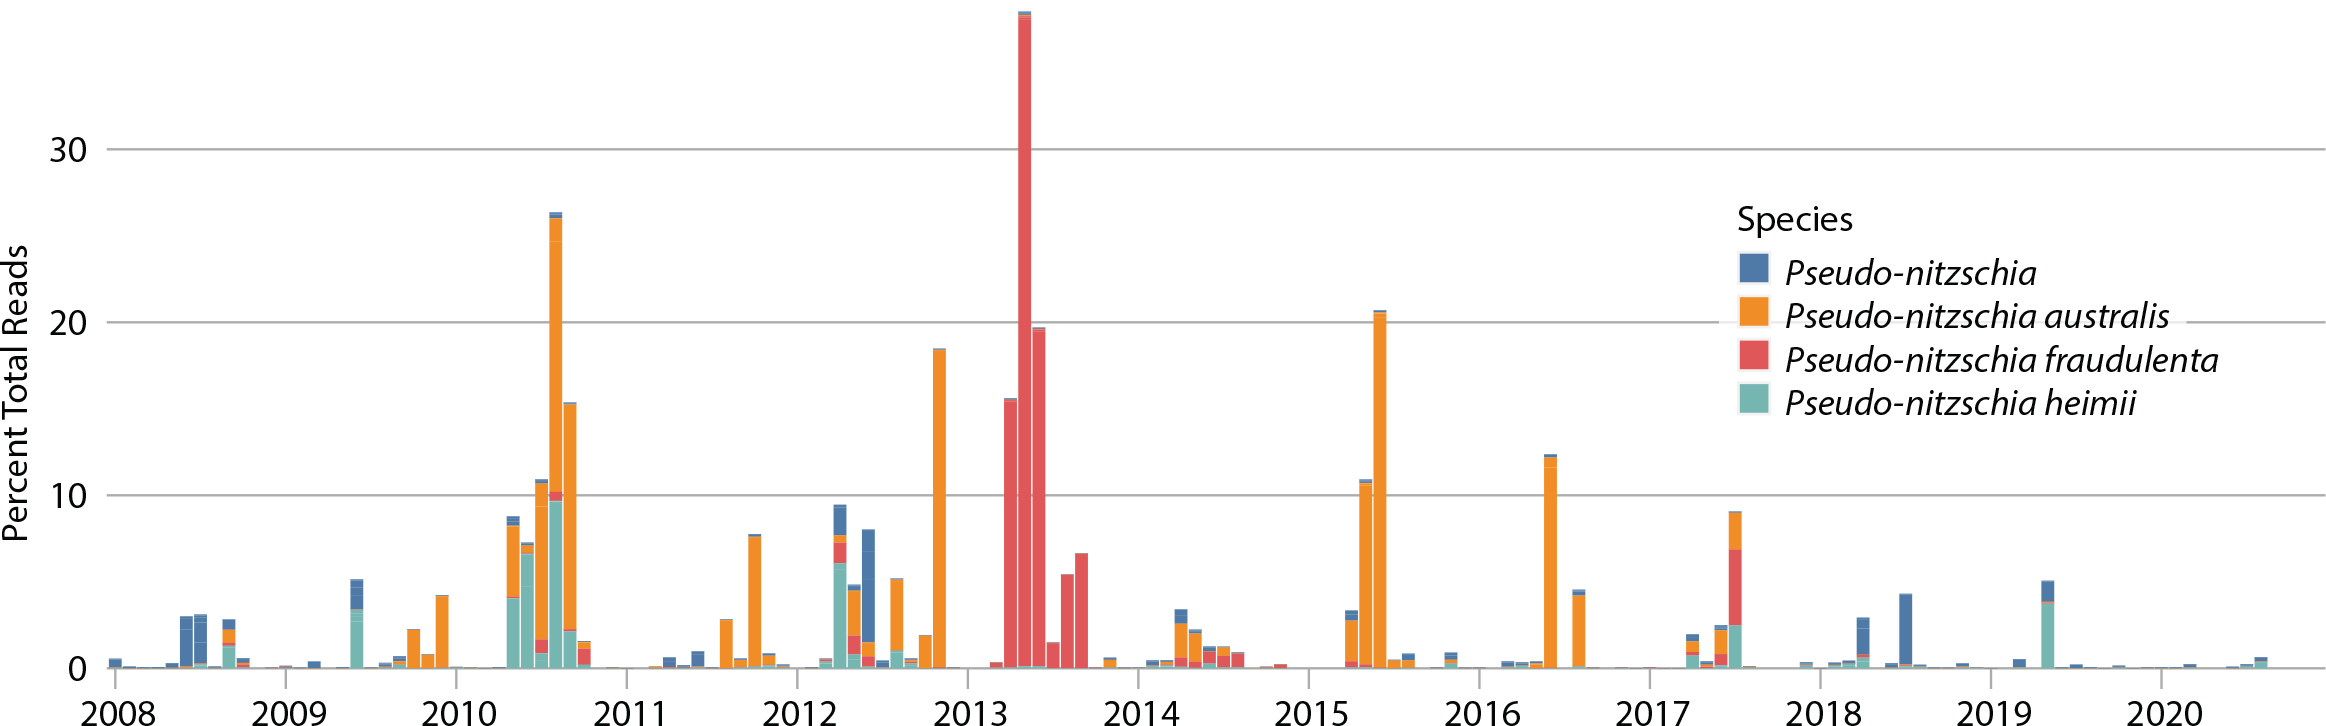
Figure 13. Time series of Pseudo-nitzschia sp. relative abundance estimated using 18S eDNA metabarcoding for monthly samples obtained from the C1 station in Monterey Bay for the period 2008–2018. Samples were collected approximately monthly using glass fiber filters. The plot shows the percent of total 18S sequencing reads for each sample, annotated to an ASV within the genus Pseudo-nitzschia averaged across individual samples monthly. The pattern for absolute Pseudo-nitzschia sequencing reads is very similar. > High res figure
|
The Utility of eDNA for Societal Applications and the Future
We have introduced and reviewed the use of environmental DNA as a tool to supplement observations of life in the sea. The results from our work in and around National Marine Sanctuaries show that eDNA analysis revealed patterns similar to those seen from traditional methods (e.g., nets, microscopy, landings) and provided additional rich detail regarding ecological processes. For example, comparisons of eDNA samples across sanctuaries (from California to Florida/Gulf of Mexico) show how environmental factors (upwelling, stratification) influence community structure across ocean basins (Figure 6). Our results provide insights into the ways that eDNA can provide information on how marine communities are structured by broad geographic conditions, depth, and seasons, and how they respond to variations in climate (Figures 6–12). The advantage of eDNA is the relative ease of sample collection even though challenges still remain in processing large quantities of samples in a standardized and cost-effective manner, and in the management of resulting large and complex data sets.
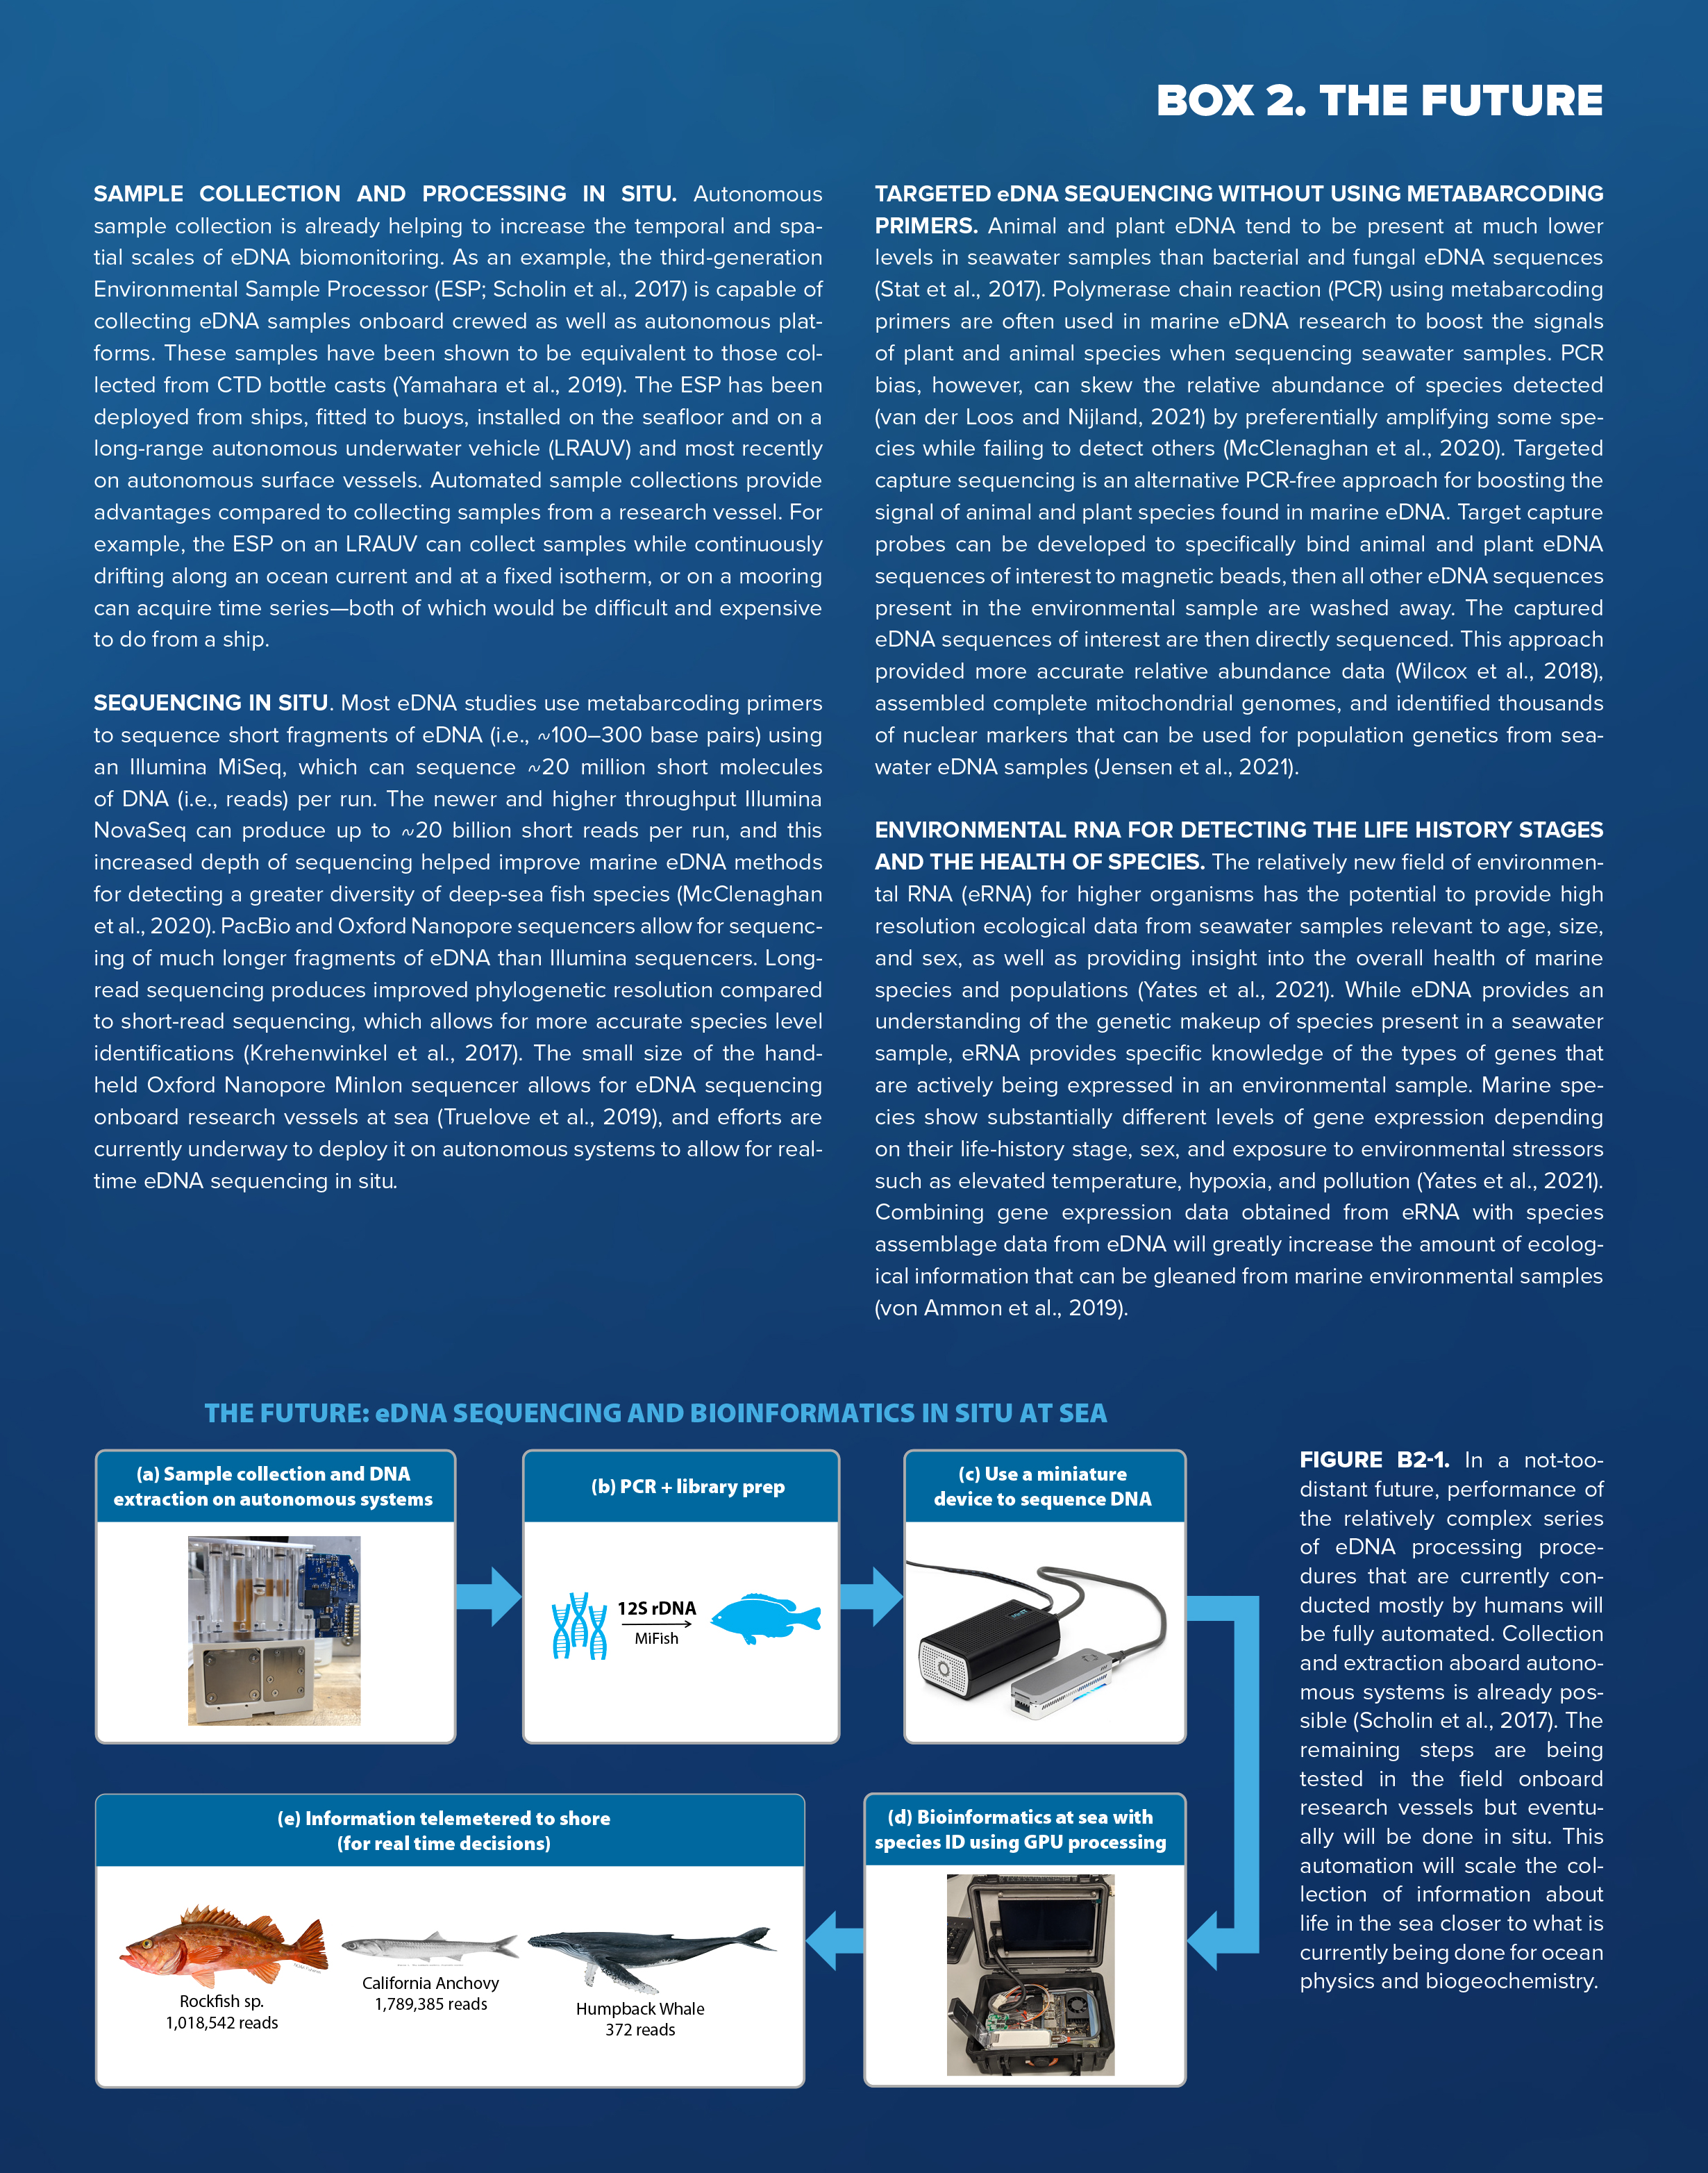
Over time, the pathway for eDNA to become a routine tool for scientific, management, and conservation purposes is becoming clearer. The work of MBON and OBON is addressing the challenges required to scale biological observations spatially and temporally (see Box 2). While some aspects of eDNA data interpretation are still a matter of research, using eDNA to simply describe what species are present is relatively robust and useful for management purposes. There are still many unknowns surrounding how the genetic molecules we detect as eDNA are generated, transported, and degraded in the ocean. Furthermore, we currently treat eDNA information as qualitatively compositional, yet there are indications that (including the data shown in this paper) quantitative information can be gleaned (Yates et al., 2021), and this trend is likely to continue. Most traditional biological assessment techniques require expensive ships and utilize analytical methods that are time-consuming, including requiring visual species identifications by a dwindling community of experts. This significantly limits sampling frequency and coverage. eDNA samples, which can be taken in a more high-throughput manner from water samples, offer an incredible opportunity to increase sampling coverage and frequency through automatization (Box 2). Furthermore, unlike some traditional sample types, archival eDNA samples can be used in the future for interrogation regarding different taxonomic communities (Box 1). Evolution of the eDNA wheel (Figure 4) continues to advance rapidly, driven by technology developments (Box 2). Several areas that we see being particularly relevant in this regard include: (1) autonomous sample collection, (2) autonomous sample processing and sequencing in situ, (3) direct sequencing of eDNA without a need for using metabarcoding methodologies, and (4) detection and characterization of environmental RNA of higher organisms to estimate age, health status, or responses to environmental stressors.
|
The transition from a technique that is currently used mostly by the research community to one that is used routinely in operational observing systems will necessarily be iterative. This will have to include streamlining collection and analysis of samples and reducing costs, as well as building tools to manage the complex documentation of methods, processing pipelines, data generated, and information products for management. An early example of eDNA management application will be the inclusion of eDNA records into National Marine Sanctuary Condition Reports, with information coming directly from repositories like the Ocean Biodiversity Information System (OBIS; see Box 1).
Within the MBON project, similar methods were employed for all samples collected, which allows for direct comparisons over space and time. Harnessing the full potential of different data sets collected across institutions and various regions will be a difficult but necessary task to advance toward the goal of a truly global eDNA biodiversity observing system. Together with the collection of associated environmental information and methodological metadata, once again via accepted standards, we will realize the potential to detect changes in life in the sea across environments, biomes, and over large expanses of time. This will undoubtedly play a key role in understanding the extent and trajectory of change, driven by growing worldwide changes in climate and other anthropogenic stressors (e.g., overfishing, warming, ocean acidification, pollution; Figure 14).
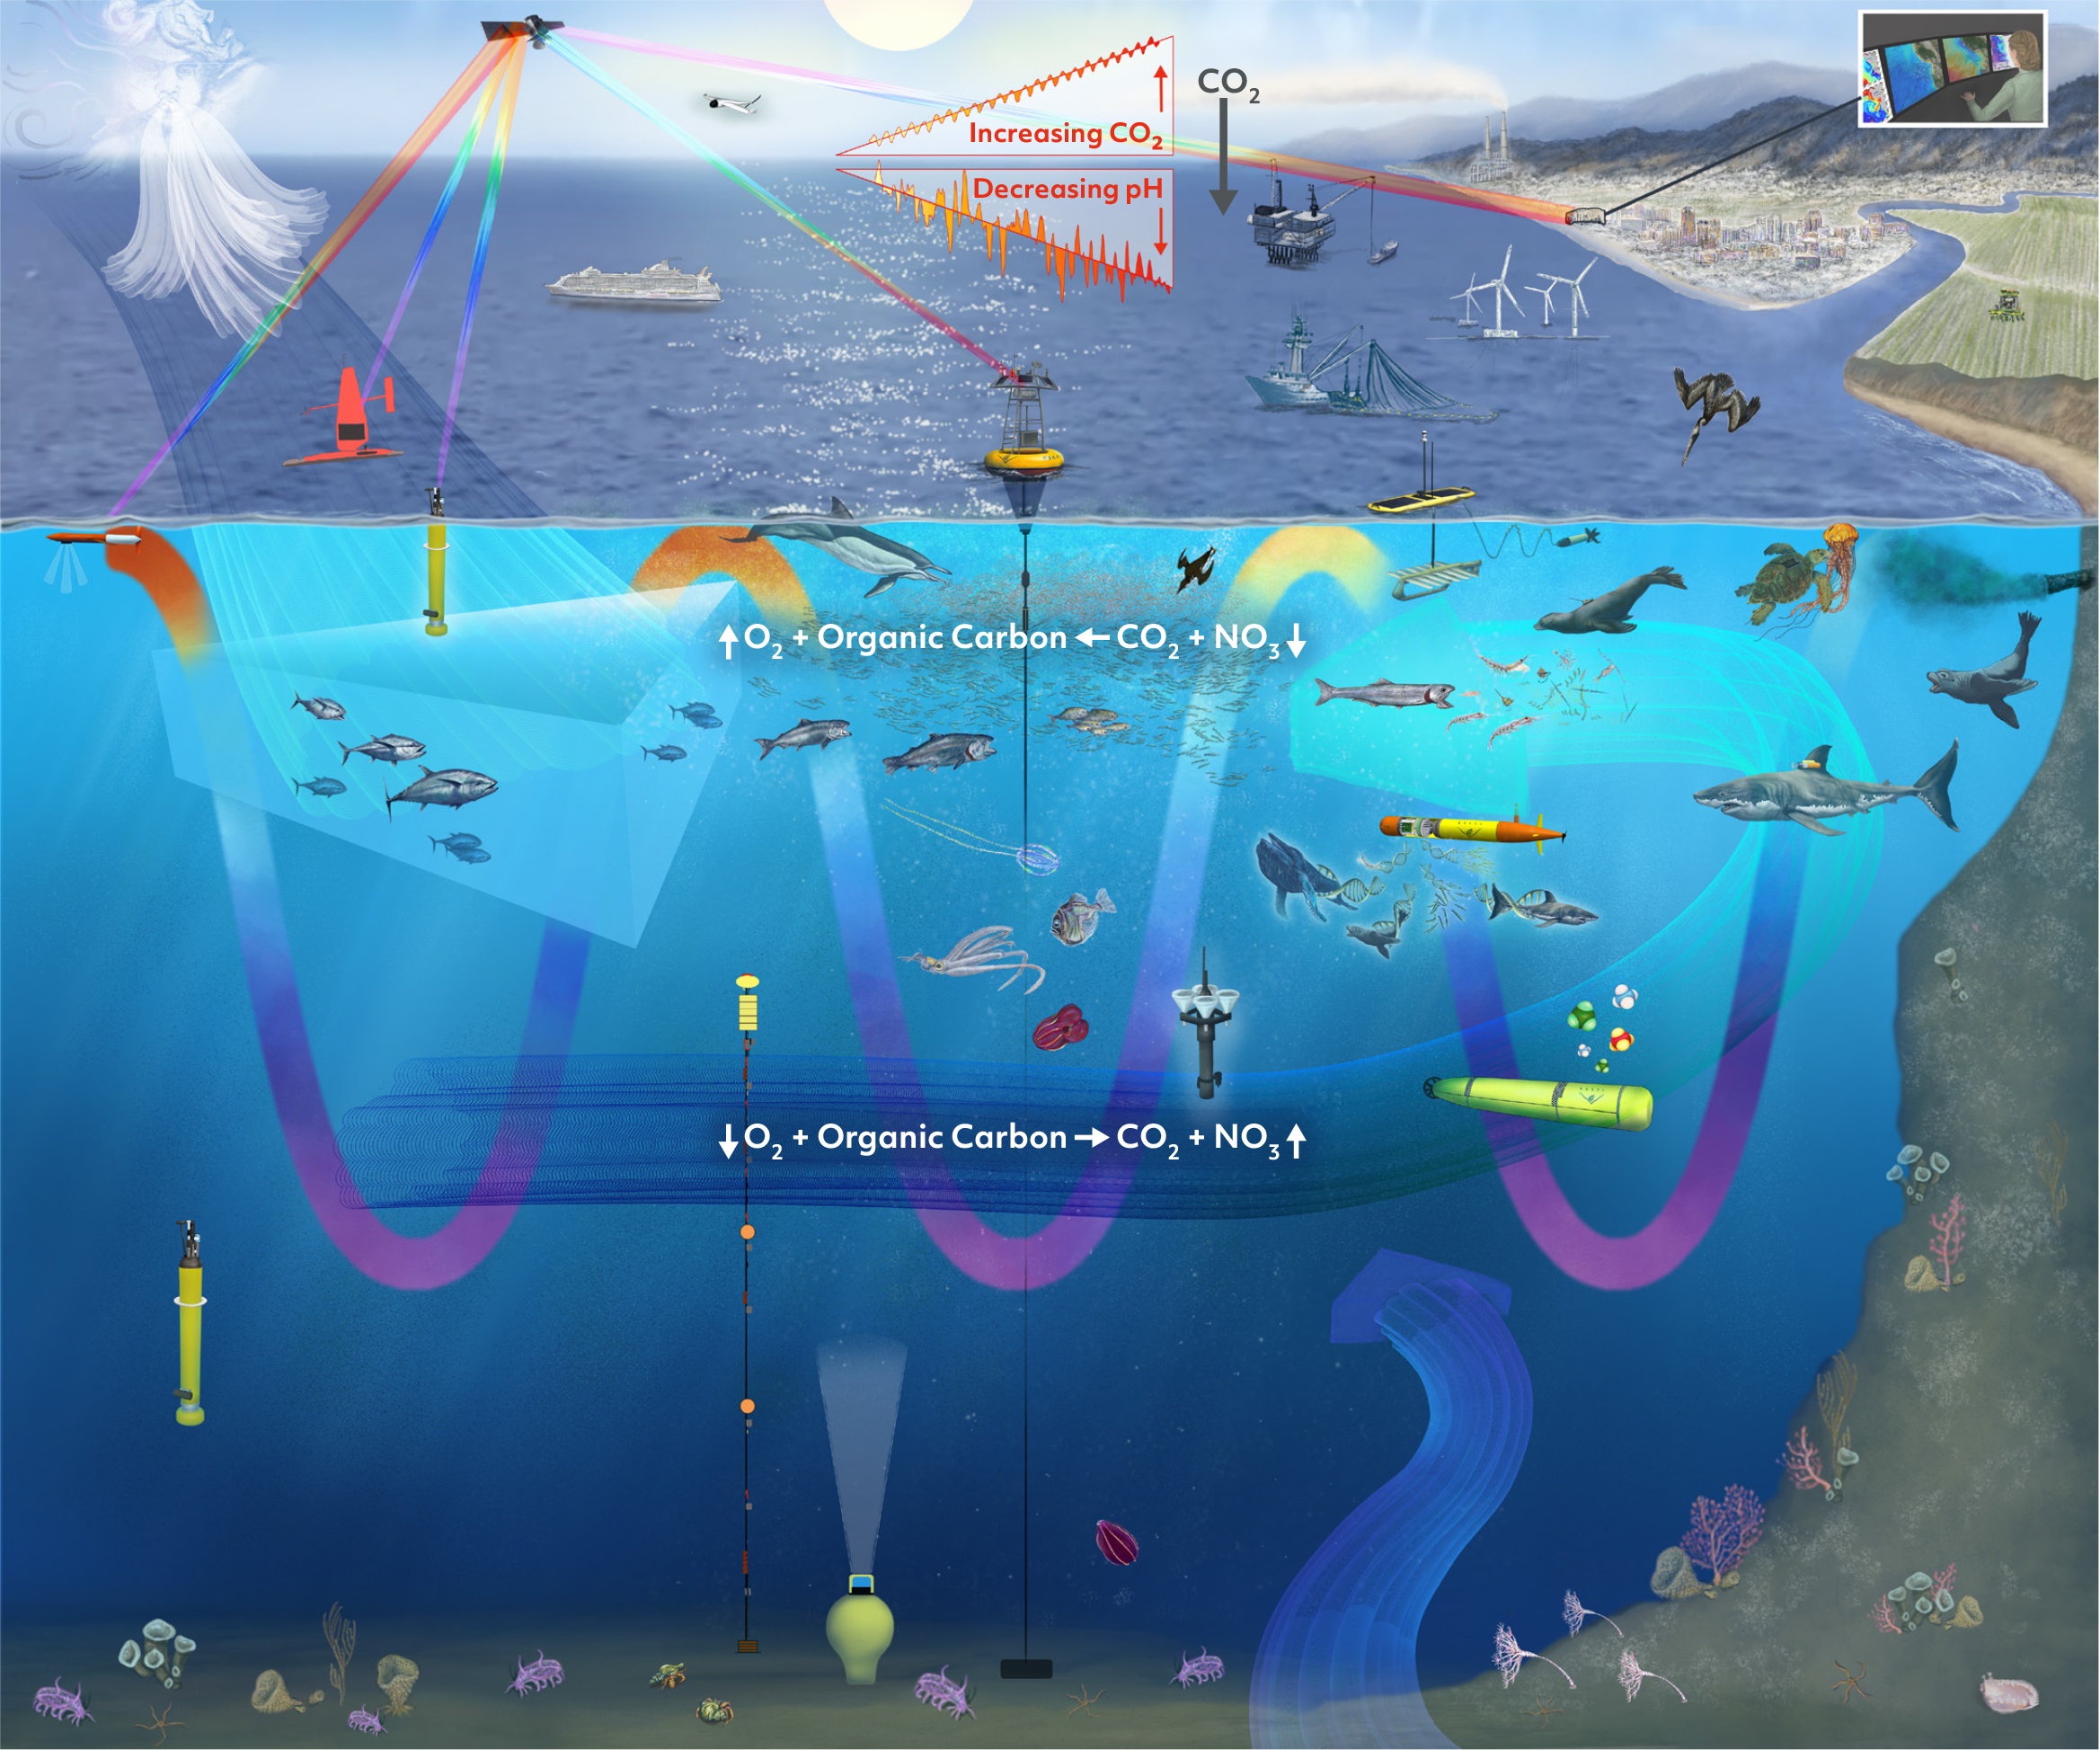
Figure 14. Environmental DNA is rapidly becoming an important tool for observing life in the sea within an ever-changing world. Local changes are frequently driven by large-scale global environmental variability and change. Understanding the extent and direction of changes in sea life will provide decision-makers with the information required to preserve a healthy ocean. Image conceived by Francisco Chavez and illustrated by Kelly Lance © MBARI. > High res figure
|
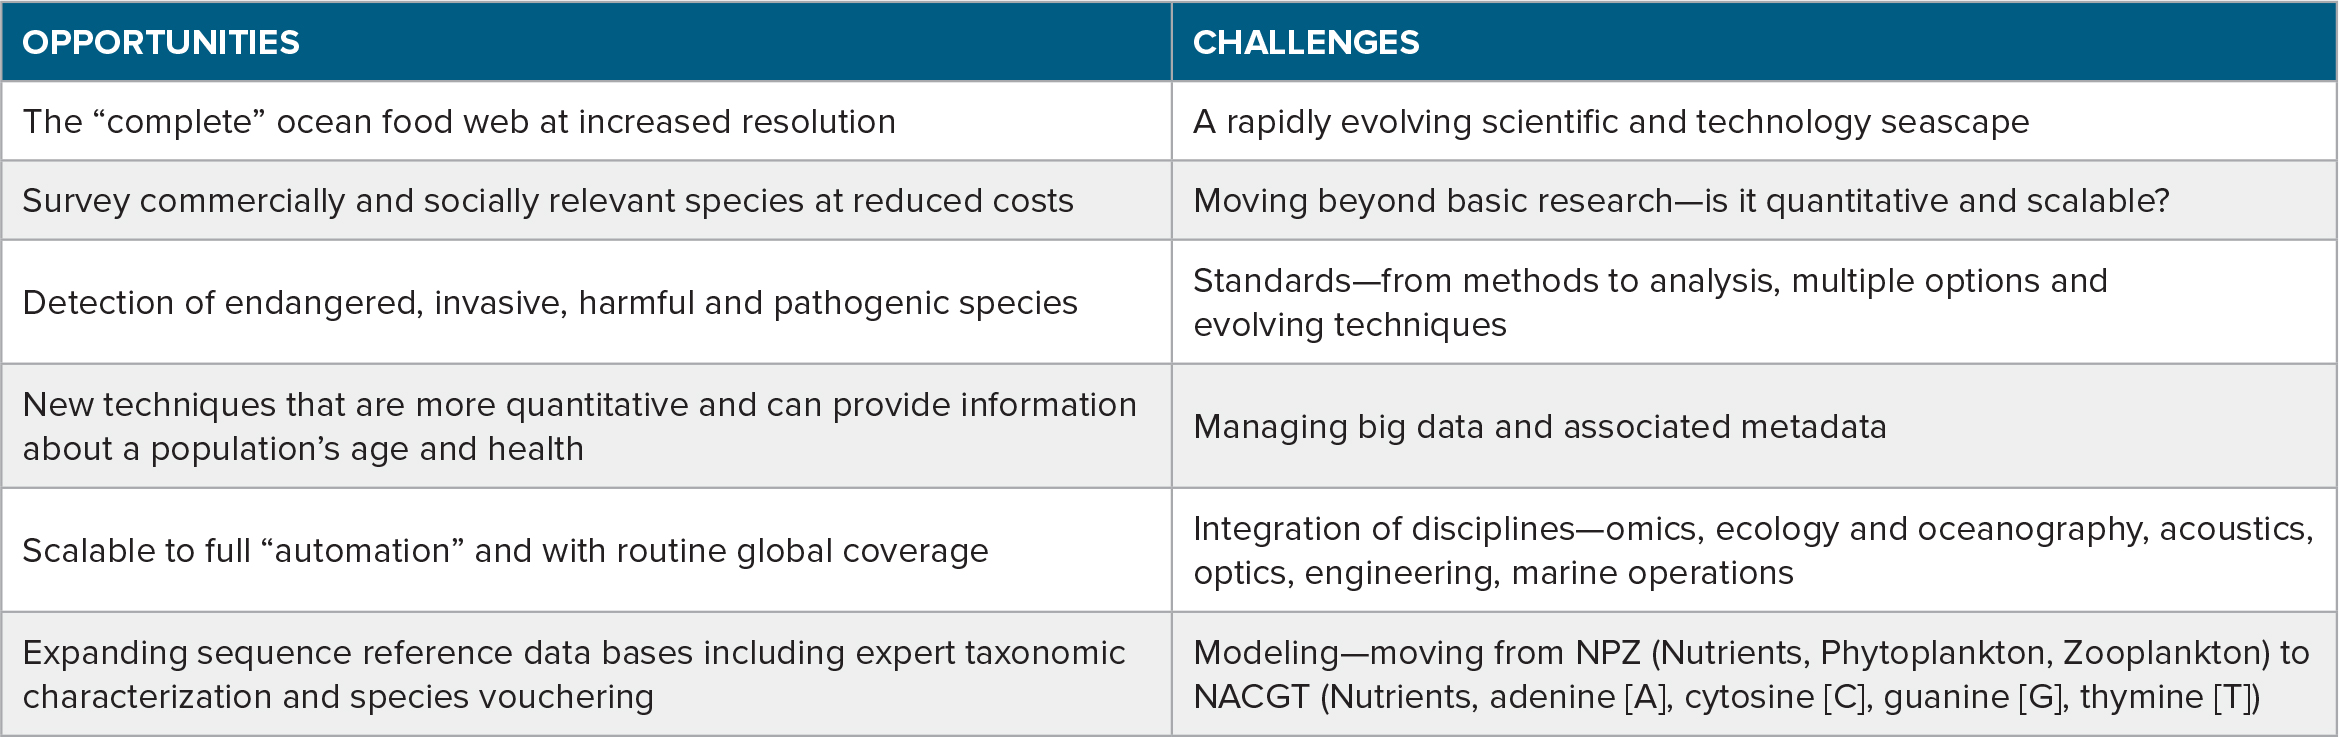
In summary, this is an exciting time for research involving marine environmental DNA and other biomolecular methods, a field that is at the forefront of scientific research, technology development, resource management, and conservation (Goodwin et al., 2017). As with any emerging field, there are many opportunities and challenges (Table 2). The opportunities include: (1) the potential to survey the full marine food web, from microbes to whales, from a single water sample; (2) surveying commercially important groups at reduced costs and increased resolution; (3) improved and early detection of endangered, invasive, harmful, and pathogenic species; (4) the development of new techniques that may be more quantitative and can provide information regarding age and health of populations; (5) the potential to scale observations globally by automating sample collection, laboratory processing, sequencing, bioinformatics, and telemetry; and (6) expanding sequence reference data bases, including expert taxonomic characterization and species vouchering. The challenges include: (1) a rapidly evolving field where methods and techniques are constantly changing and improving, complicating site to site and time series comparisons; (2) integrating eDNA into resource management practices; (3) agreeing on standards for regional, national, and international programs; (4) managing the data and associated metadata—the scale of this effort has not yet been fully appreciated and the community should look at other fields with more experience (i.e., remote sensing) for lessons learned; (5) development of a new generation of scientists trained to integrate genetic information with other biological sensing methods, ecology, and oceanography; and (6) incorporating genetic information into numerical (ecosystem) models. The coming decade that coincides with the United Nations Ocean Decade for Sustainable Development should see great advances on many of these fronts.
Table 2. Opportunities and challenges for marine environmental DNA research and applications. > High res table
|
Materials and Methods
eDNA samples in this analysis were drawn from seawater collected from shipboard CTD rosettes, from autonomous vehicles, and by scuba divers. These water samples were then filtered through a peristaltic pump system, vacuum pump system, or autonomously through an Environmental Sample Processor instrument (Scholin et al., 2017). Filters ranged from 0.2 μm PVDF membranes to glass fiber filters (GFF). DNA was extracted following the protocols found at https://doi.org/10.17504/protocols.io.n2udgew, then PCR amplified (18S: https://doi.org/10.17504/protocols.io.n2vdge6; COI: https://doi.org/10.17504/protocols.io.mwnc7de; 12S: https://doi.org/10.17504/protocols.io.bcppivmn), and sequenced. As eDNA methods are rapidly evolving, wet lab procedures used within this project have shifted as well, resulting in both advances as well as interoperability challenges. Sequencing results were processed bioinformatically through a custom shell script adapted from the banzai pipeline and run on a per-plate basis (O’Donnell et al., 2016, https://github.com/MBARI-BOG/BOG-Banzai-Dada2-Pipeline). Within the script, primer sequences are first removed from fastq files through the program Atropos (Didion et al., 2017). Fastq files are then fed into the Dada2 program (Camacho et al., 2009; Callahan et al., 2016). Dada2 models DNA sequencing error on a per-Illumina run basis, controlling for read quality and picking ASV sequences that represent biological variability rather than sequencing error (Callahan et al., 2016). Within Dada2, reads are trimmed to remove low-quality regions and filtered by quality score, sequencing errors are modeled and removed, and reads are then merged and chimeric sequences removed. Taxonomy is assigned to the resulting ASV sequences through blastn searches to NCBI GenBank’s non-redundant nucleotide database (nt) (D.A. Benson et al., 2013). Blast results are filtered using MEGAN6’s lowest common ancestor (LCA) algorithm (Huson et al., 2016). Only hits with ≥80% sequence identity and whose bitscores were within the top 2% of the highest bitscore value for each OTU are considered by MEGAN6. The MEGAN6 parameter LCA percent is set to 0.8, allowing for up to 20% of top hits to be off target and still have the majority taxonomy assigned. This parameter value was chosen to allow for minor numbers of incorrectly annotated GenBank entries—effectively allowing for ASVs that had many high-quality hits to a taxa to still be assigned to that taxa even if there was a high-bitscore hit to another GenBank sequence annotated to an unrelated taxa. Post-MEGAN6 filtering is performed to ensure only contigs with a hit of ≥97% sequence identity is annotated to the species level. Only contigs with a hit of ≥95% sequence identity is annotated to the genus level. Annotations are elevated to the next highest taxonomic level for contigs that fail these conditions.
Acknowledgments
This effort was funded by NASA awards NNX14AP62A, 80NSSCC20M001, and 80NSSC21M0032, NOAA award NA16NOS0120021, and by the David and Lucile Packard Foundation.