Introduction
Through regional and global ocean-atmosphere teleconnections, air-sea interactions affect ocean- and land-based weather systems and drive climate and ocean variations. Moored buoys and ships have been the backbone of the Global Ocean Observing System (GOOS) for air-sea interaction processes, providing a full suite of essential ocean and climate measurements required to quantify air-sea surface heat and momentum fluxes. A network of moored buoys placed at strategically important locations such as in the tropical oceans and near coasts has provided operational ocean and weather prediction centers with real-time data through the World Meteorological Organization’s Global Telecommunication System (GTS; McPhaden et al., 1998, 2009). These in situ platforms, however, are inadequate for observing extreme weather events because the moored network is too sparse, and the ship operations, while capable of adaptive sampling, try to avoid severe weather for safety reasons. Establishment of a truly global GOOS for measuring multiscale and multi-process air-sea interactions has yet to be accomplished and is the goal of collective efforts within the UN Decade of Ocean Sciences for Sustainable Development program (Cronin et al., 2019, 2023a). Adaptive sampling techniques are needed for observing extreme ocean and weather phenomena, including hurricanes and the marginal ice zone, that can fluctuate on very rapid timescales.
In high latitudes of the Northern Hemisphere, sea-ice coverage extends as low as 55°N in winter, but retreats rapidly between May and September as far north as 80°N. Figure 1a shows the large seasonal ice retreat-advance cycle over a large latitudinal band, where it is difficult to maintain moored buoy and shipboard measurements of air-sea surface fluxes due to the ice coverage in winter. However, global warming has caused the summer sea-ice edge to retreat further and further north in recent decades. The white line shows the 15% areal ice concentration that locates the ice edge in late summer (September) each year along 168°W. More and more vast ice-free areas open up each year for more vigorous air-sea interaction, calling for a viable ocean observing platform that can adapt to the rapidly changing sea ice conditions and provide more observations in these areas.
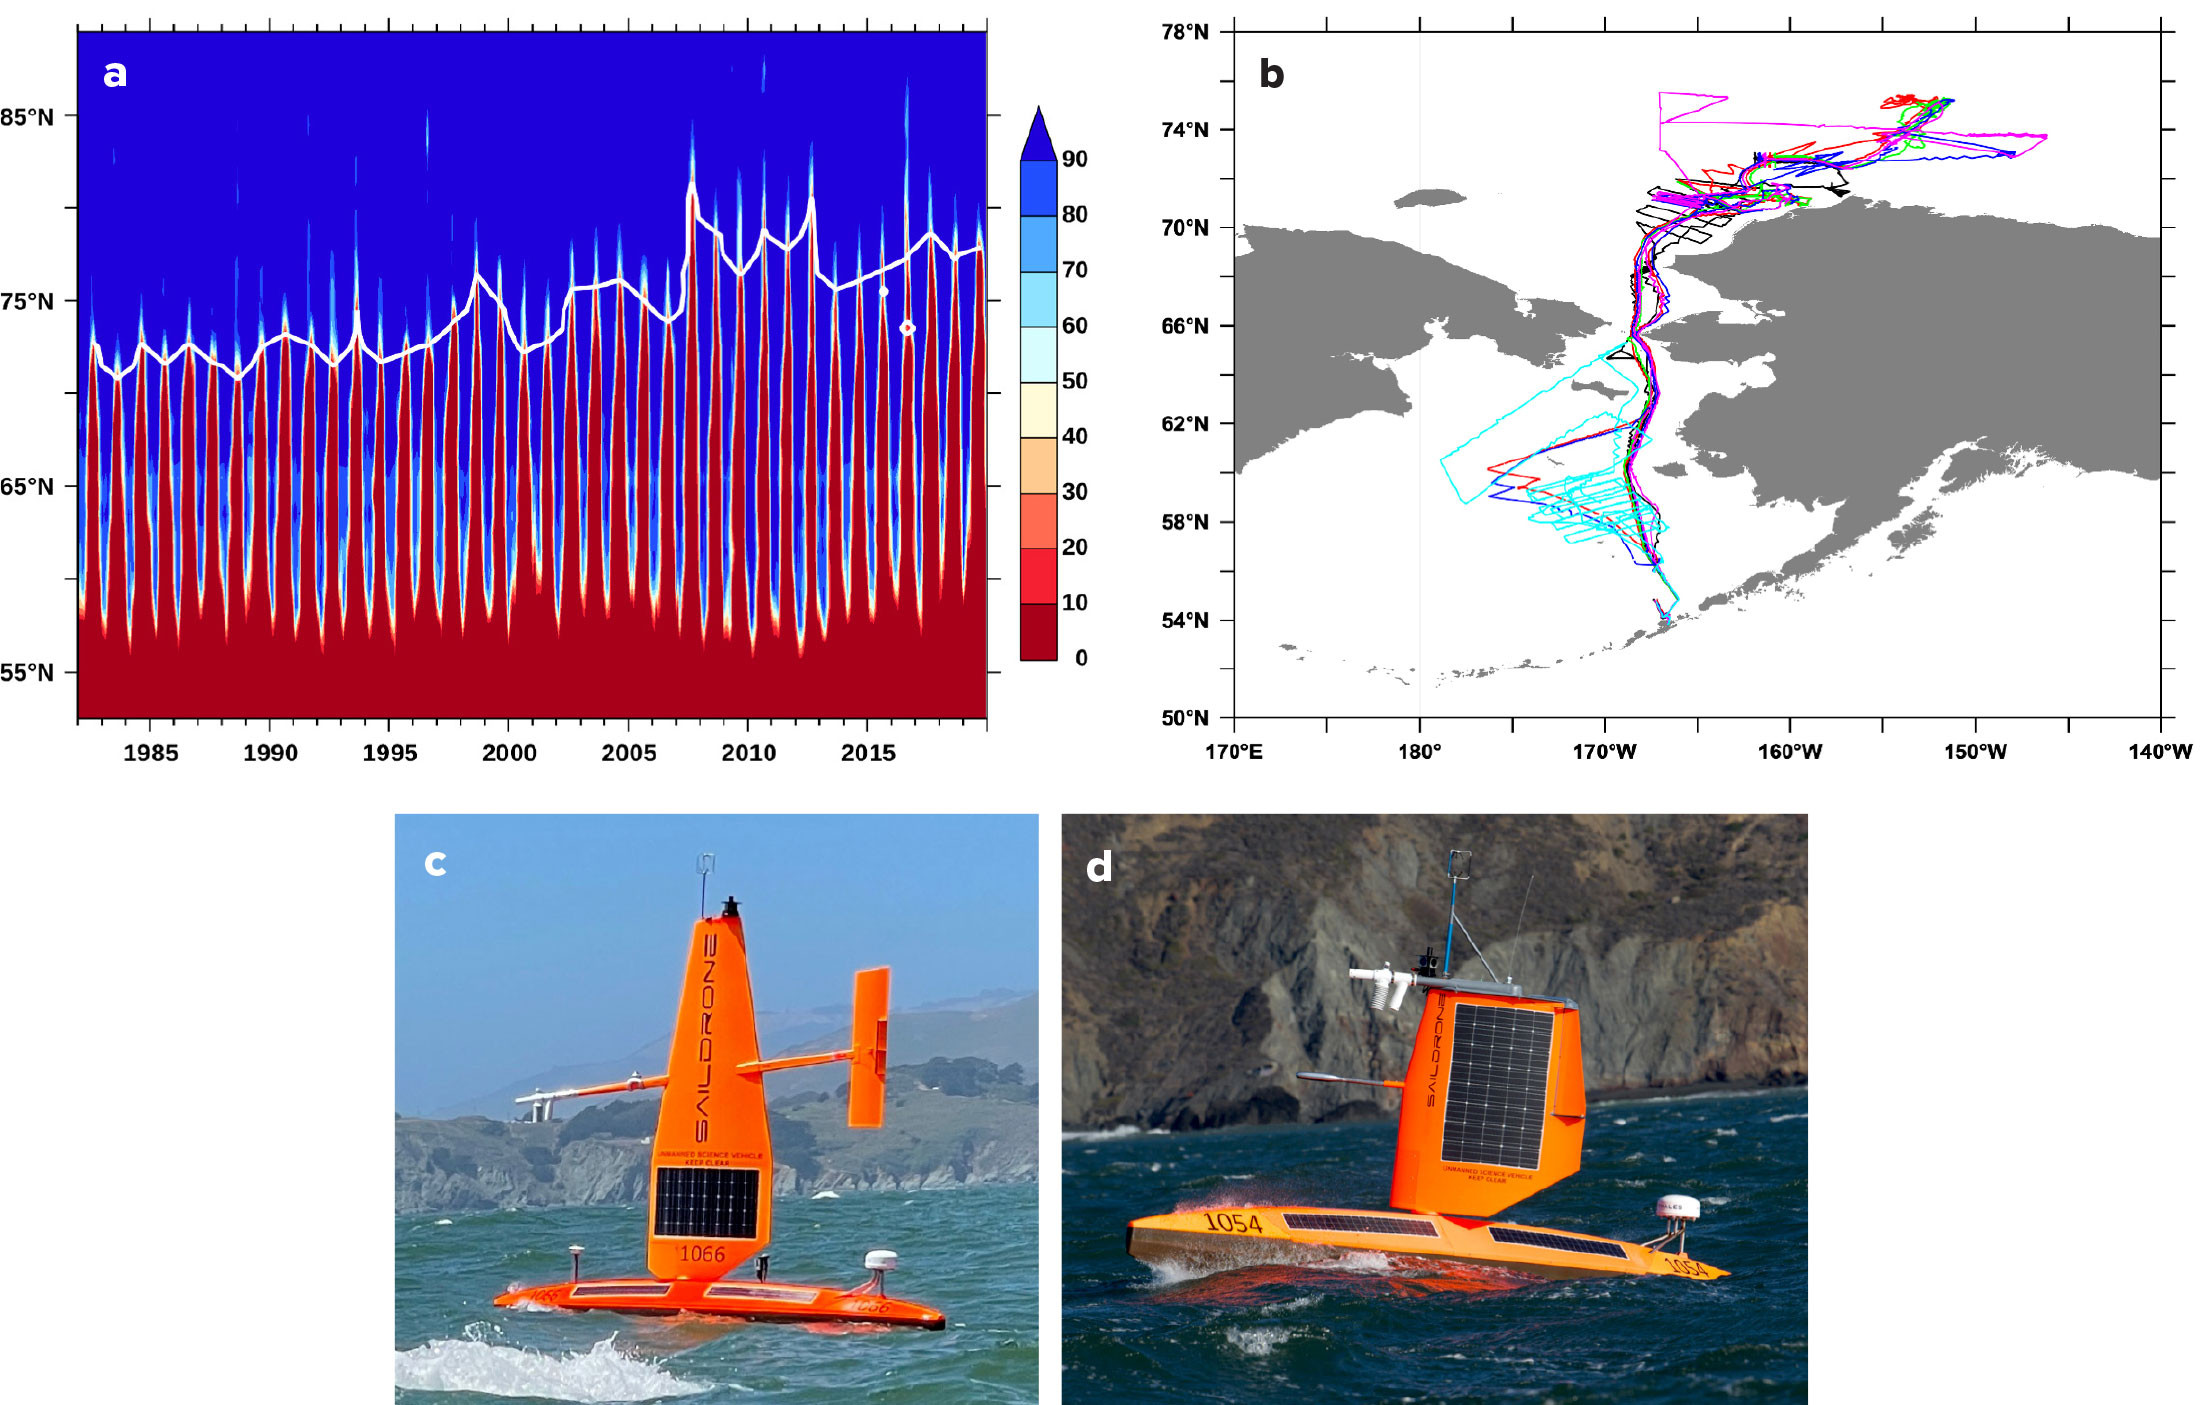
FIGURE 1. (a) NOAA Optimal Interpolation ice concentration (areal %) is charted here along 168°W, the meridional section through Bering Strait. (b) Five uncrewed surface vehicle (USV) saildrone tracks are shown for May–September 2019. (c) This type of saildrone is used for Pacific Arctic missions in summer. (d) A short-wing saildrone was developed for observing hurricanes. > High res figure
|
Similarly, traditional platforms cannot be actively navigated to acquire targeted observations inside hurricanes. Air-sea heat and momentum fluxes play important roles in the development and maintenance of tropical cyclones (Emanuel, 1986, 1995; J.A. Zhang et al., 2017). While hurricane track prediction has improved steadily over the past three decades, largely due to improvements in observations and modeling of the large-scale atmospheric steering flow, hurricane intensity forecasts have significantly lagged (Cangialosi et al., 2020) due to more limited observing and understanding of the multiscale, multi-process air-sea interactions and atmospheric dynamics inside hurricanes.
The NOAA Pacific Marine Environmental Laboratory (PMEL) has been the pioneer in developing mooring and shipboard measurement technologies and applying them to provide high-quality, sustained ocean observations within GOOS (McPhaden et al., 2023; Cronin et al., 2023b; Stabeno et al., 2023; Erickson et al., 2023; all in this special issue). This article summarizes PMEL’s efforts in developing and using the uncrewed surface vehicle (USV) saildrone (Figure 1c,d) to observe air-sea interaction processes in the Arctic marginal ice zones and in hurricanes.
Saildrones: Adaptable Air-sea Interaction Observing Platforms
Saildrones (Figure 1c,d) are zero-emission uncrewed vehicles that use renewable energy—wind for propulsion and solar energy for powering sensors, vehicle control, onboard real-time data processing, and transmission—to enable a long travel range and high endurance. The longest single mission extended to 12 months and 16,000 km at sea. Development of the saildrone into a scientific air-sea interaction observing platform started with the Cooperative Research and Development Agreement (CRADA) signed between PMEL and Saildrone Inc. in 2014 (Meinig et al., 2019), and then facilitated by the Innovative Technology for Arctic Exploration program (Cross et al., 2015; Tabisola et al., 2023, in this issue). In 2015 and 2016, collaborating with NOAA Fisheries, two saildrones equipped with purpose-built, research-quality echosounders and off-the-shelf surface meteorological and oceanographic sensors surveyed the Bering Sea to determine fish biomass and identify surface cooling and freshening due to sea-ice melt (Cokelet et al., 2015; Mordy et al., 2017; De Robertis et al., 2019). In 2016, NOAA Oceanic and Atmospheric Research’s Technology Development Program funded PMEL and Saildrone Inc. to increase the observing capabilities of saildrones by integrating research-quality, high-frequency, three-dimensional wind sensors, radiometers, and acoustic Doppler current profilers (ADCPs) into the USVs. Critically, motion corrections for wind and ADCP measurements were developed and implemented for real-time use onboard the USVs. The USVs observe essential variables for air-sea surface heat and momentum flux calculation: air temperature and relative humidity, wind, solar and longwave radiation, and sea surface temperature and salinity, as well as ocean currents and waves. With funding from the NOAA Global Ocean Monitoring and Observation program, PMEL led a pilot study to explore the use of saildrones in the Tropical Pacific Observing System (TPOS). This study demonstrated that saildrones are capable of obtaining high-quality air-sea interaction data to fill gaps in the current TPOS, including adaptive observations of high-frequency and small-scale frontal air-sea interactions (Zhang et al., 2019; Wills et al., 2021; Reeves Eyre et al., 2023).
Saildrone Observations in the Arctic Marginal Ice Zones
Five saildrones, equipped to measure air-sea fluxes of heat and momentum (Cronin et al., 2019), were deployed in May 2019 from Dutch Harbor, Alaska, and sailed north through the Bering Strait following the retreat of sea ice into the Chukchi and Beaufort Seas (Figures 1b and 2). This mission was designed to test the feasibility of using saildrones for observing the Arctic marginal ice zone (Figure 2c,d). A main objective was measuring gradients in surface fluxes and surface marine conditions up to the sea-ice edge while reporting these observations through the GTS in near-real time (Chiodi et al., 2021). To accomplish this, the vehicles sailed as far north as 75.5°N while collecting observations along routes spanning 56,000 km. The vehicles worked close to ice (e.g., ice was evident in downward-looking camera images such as Figure 2d) on 25 separate occasions that were bracketed by open water sailing. Though not specifically designed for ice zone navigation, all vehicles and sensors survived and were recovered at the end of the mission, although some damage was evident on one USV. The lessons learned and measurements collected are helping us to understand the sort of USV array needed to constrain estimates of air-sea fluxes over the seasonal ice zone. One conclusion is that improved remote ice zone navigation will likely be needed before USV sampling near sea ice becomes routine, but post-mission analysis highlighted paths for developing this capability using onboard detection of sea ice. The surface marine observations (e.g., sea surface temperature and salinity) and, especially, camera images already collected on standard saildrone USVs offer two potential sources of such onboard ice proximity information.
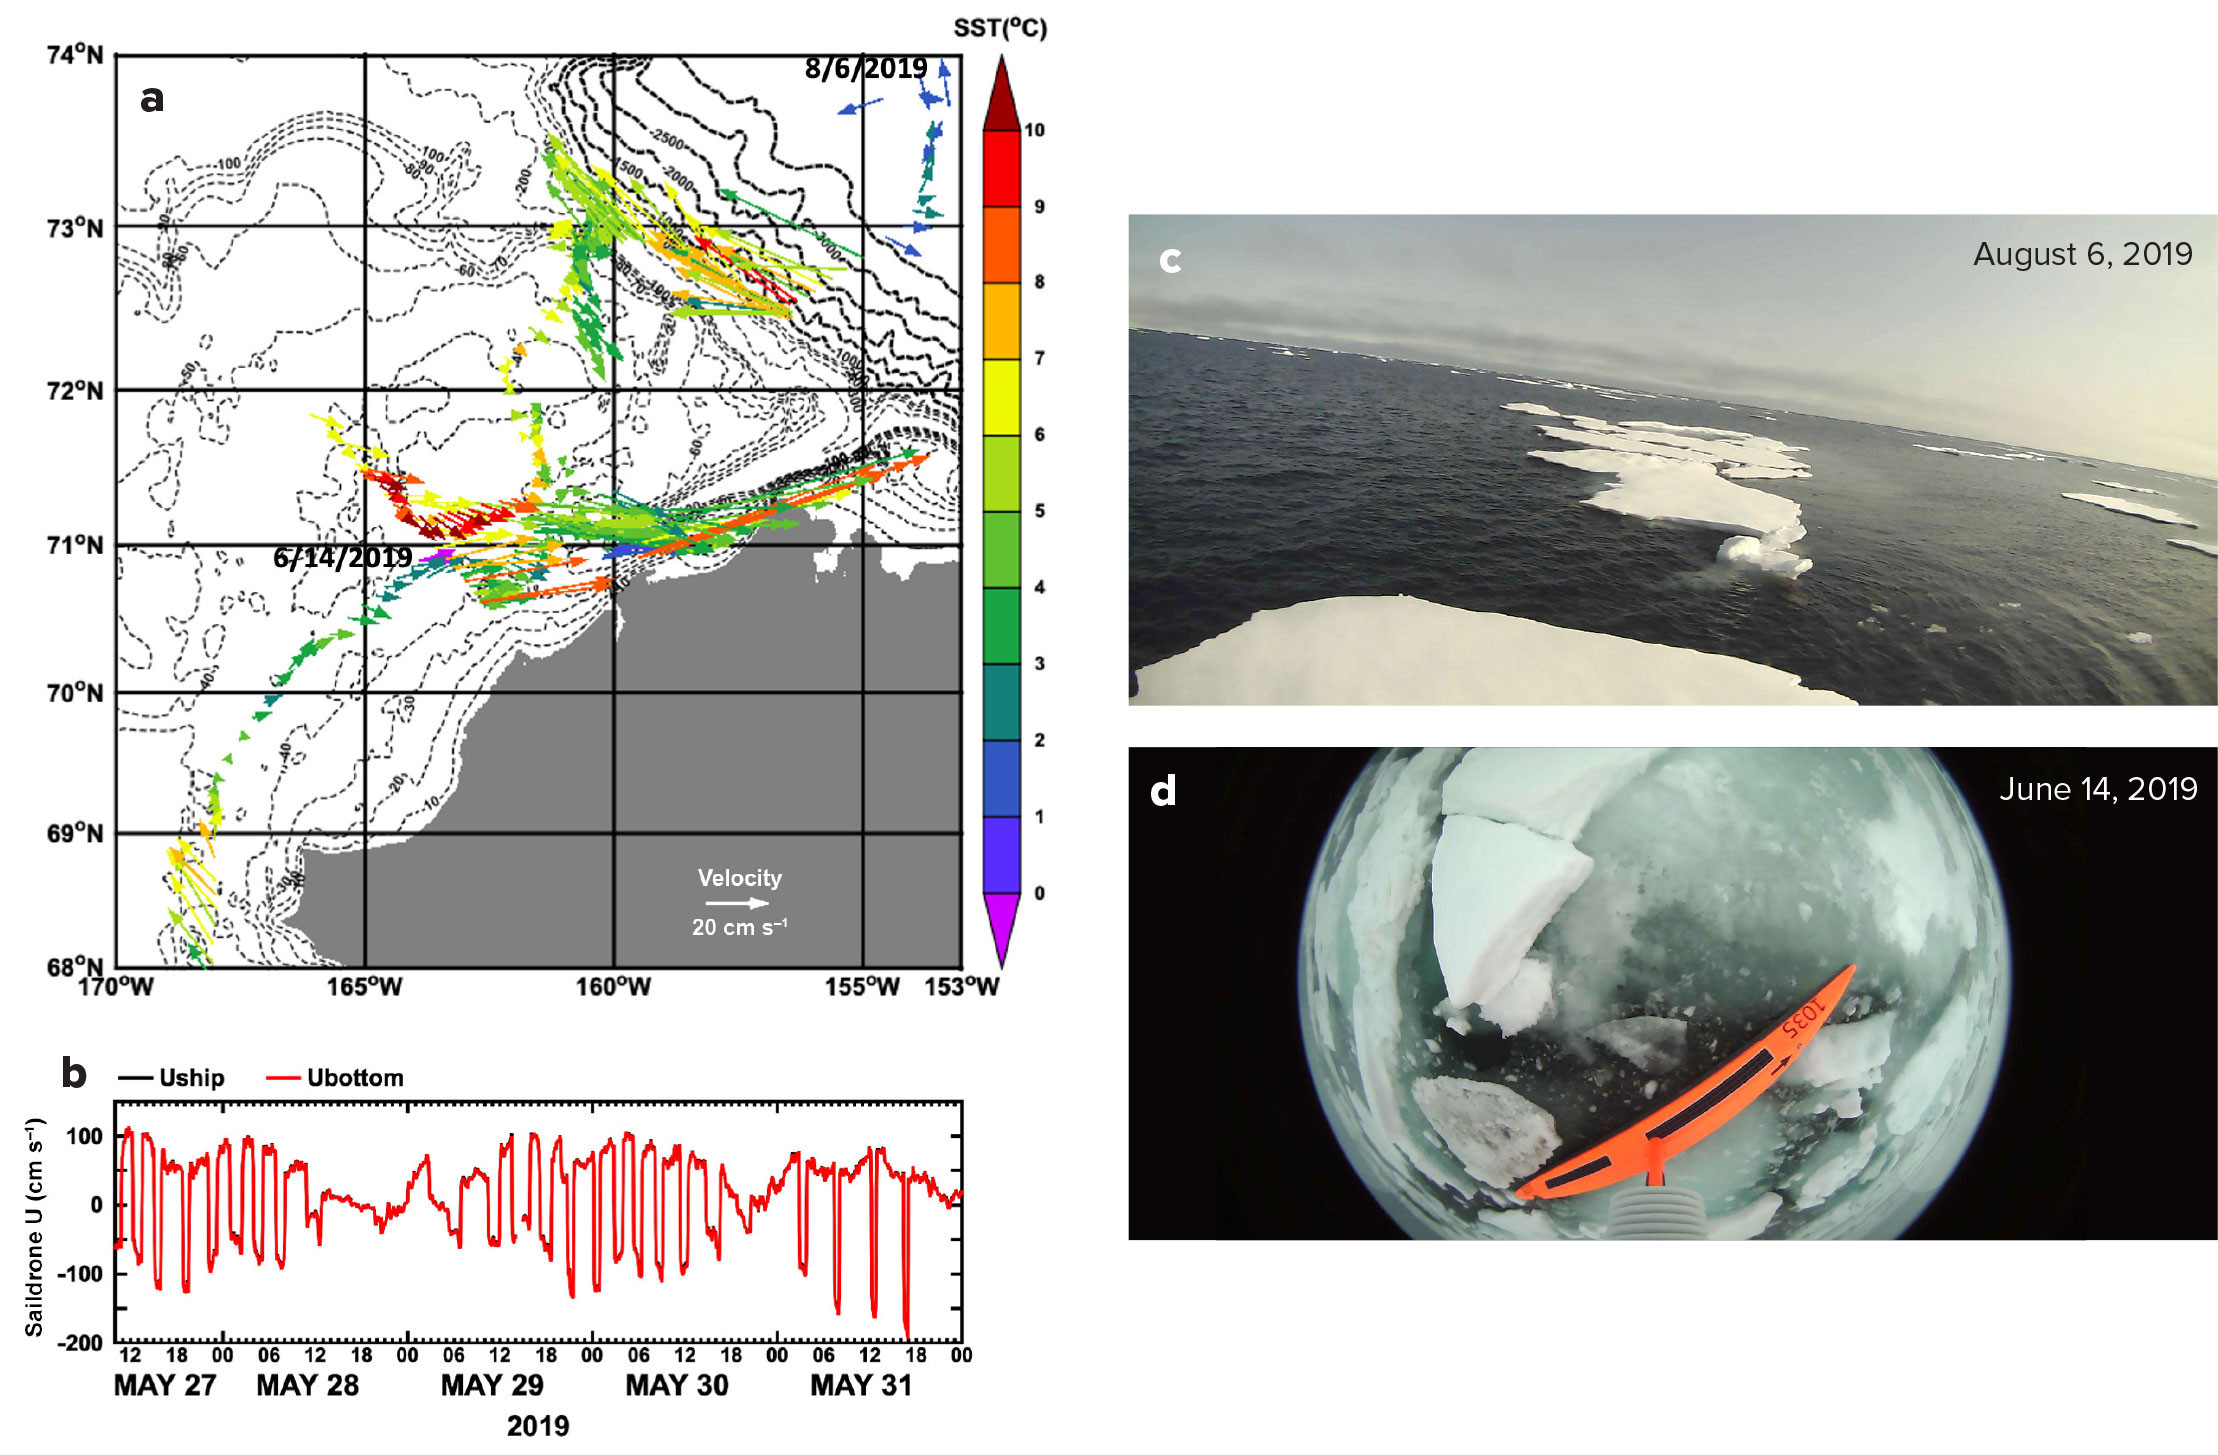
FIGURE 2. (a) Surface currents (cm s–1) are shown at 6 m depth measured by an acoustic Doppler current profiler (ADCP) along the track of Saildrone 1035 and colored by the sea surface temperature (SST) measured at 0.5 m. (b) Plot shows saildrone velocity (eastward component) determined by high-frequency measurements of GPS/IMU installed in the hull (black) and bottom tracking of the ADCP (red). (c) and (d) These photos were taken by one of the four cameras mounted on the USV during two days when it was in the marginal ice zone. > High res figure
|
Evaluation of numerical weather models using the surface marine variables collected on this mission demonstrated that, compared to dynamic variables such as surface pressure and wind, thermodynamic variables such as sea surface temperature (SST) and humidity were poorly represented, with the largest errors occurring when warm surface anomalies were observed but inadequately represented in the models’ initial conditions (C. Zhang et al., 2022). These low biases in model temperature tended to persist throughout the 10-day forecast period examined by C. Zhang et al. (2022). These results suggest that substantially increasing the amount of high-quality, in situ observations made available to forecast centers in near-real time, coupled with data assimilation methods that sufficiently constrain the initial surface model conditions based on the available observations, is one way of improving the forecast skill of surface marine thermodynamics across the Arctic Ocean.
In addition to measuring surface air-sea fluxes in the open ocean and marginal ice zones following the rapid seasonal retreat of sea-ice coverage in spring and summer, saildrones can also be deployed to map the pathways of warm Pacific water into the Chukchi and Beaufort Seas that affect Arctic Ocean stratification and the heat budget of the Arctic ocean-ice-atmosphere system. Figure 2a shows the 110 cm s–1 surface current of warm water flowing into Barrow Canyon, seemingly fed by warm offshore Alaska Coastal Water (Stabeno et al., 2018) and contributing to the warm Beaufort shelf currents observed at 72.5°N. SST below 0°C was observed on June 14, 2019, when the USV was inside a large patch of floating ice (Figure 2d) that had broken off from the ice edge and drifted to the USV location. The largest uncertainty in ADCP current measurements collected by any moving platform is from imperfect motion correction. The relatively flat shallow shelf in the Bering Sea between 58°N and 62°N (Figure 1b) offers the opportunity to validate the motion correction based on GPS/IMU measurements and ADCP bottom tracking (Figure 2b). With the Teledyne-specified accuracy of 0.5 cm s–1, the excellent agreement between the two methods (within 1 cm s–1) suggests that the accuracy of saildrone ocean current measurements is 1.1 cm s–1, according to the rule of error propagation.
USV Saildrones for Hurricane Observations
Powerful hurricanes often cause extensive damage and loss of life. To improve hurricane intensity forecasts that provide lead time for preparation and evacuation, more accurate representations of air-sea interaction processes and more realistic ocean-atmosphere initial conditions are needed in forecast models. Both require extensive observations, especially near the air-sea interface in the eyewalls of hurricanes, to further advance our knowledge and understanding of the processes that affect hurricane intensification, including air-sea energy and momentum fluxes and their interactions with the upper ocean. Past saildrone missions in high wind and wave conditions of the Southern Ocean and North Atlantic storm track have repeatedly resulted in the top portion of the vehicle’s wing being broken off. To improve operability in severe weather and sea states, the standard saildrone wing (5 m tall) has been shortened to 3 m (Figure 1c vs. d) for enhanced stability to prevent capsizing in large breaking waves. The sensor mounting, housing, and durability have also been improved to repel sea spray and water.
To test the new short-wing extreme weather saildrone before using it for hurricane observations, the North Pacific Winter Storm saildrone mission was launched in December 2020 to: (1) validate extreme weather USV data against NOAA’s National Data Buoy Center (NDBC) buoy 46005, (2) practice coordinated observations with an underwater glider for co-located measurements, and (3) test the short-wing USV under tropical storm and hurricane-force wind and wave conditions. The saildrone (Figures 1d and 3) departed San Francisco Bay on November 8, 2020, sailed around NDBC buoy 46005 within 2–10 km, and followed the National Science Foundation’s Ocean Observatory Initiative Coastal Endurance underwater glider (ce383) before it was retrieved at Gray’s Harbor, Washington, on March 26, 2021. Intercomparison between saildrone and moored buoy data showed agreement well within the measurement error of moored buoys for key variables of air-sea interaction (Figure 3b–h) as quantified by their correlation, mean difference, and root-mean-square deviation. These results are consistent with the comparison between the standard TPOS saildrone and moored buoys in the tropical Pacific (D. Zhang et al., 2019).
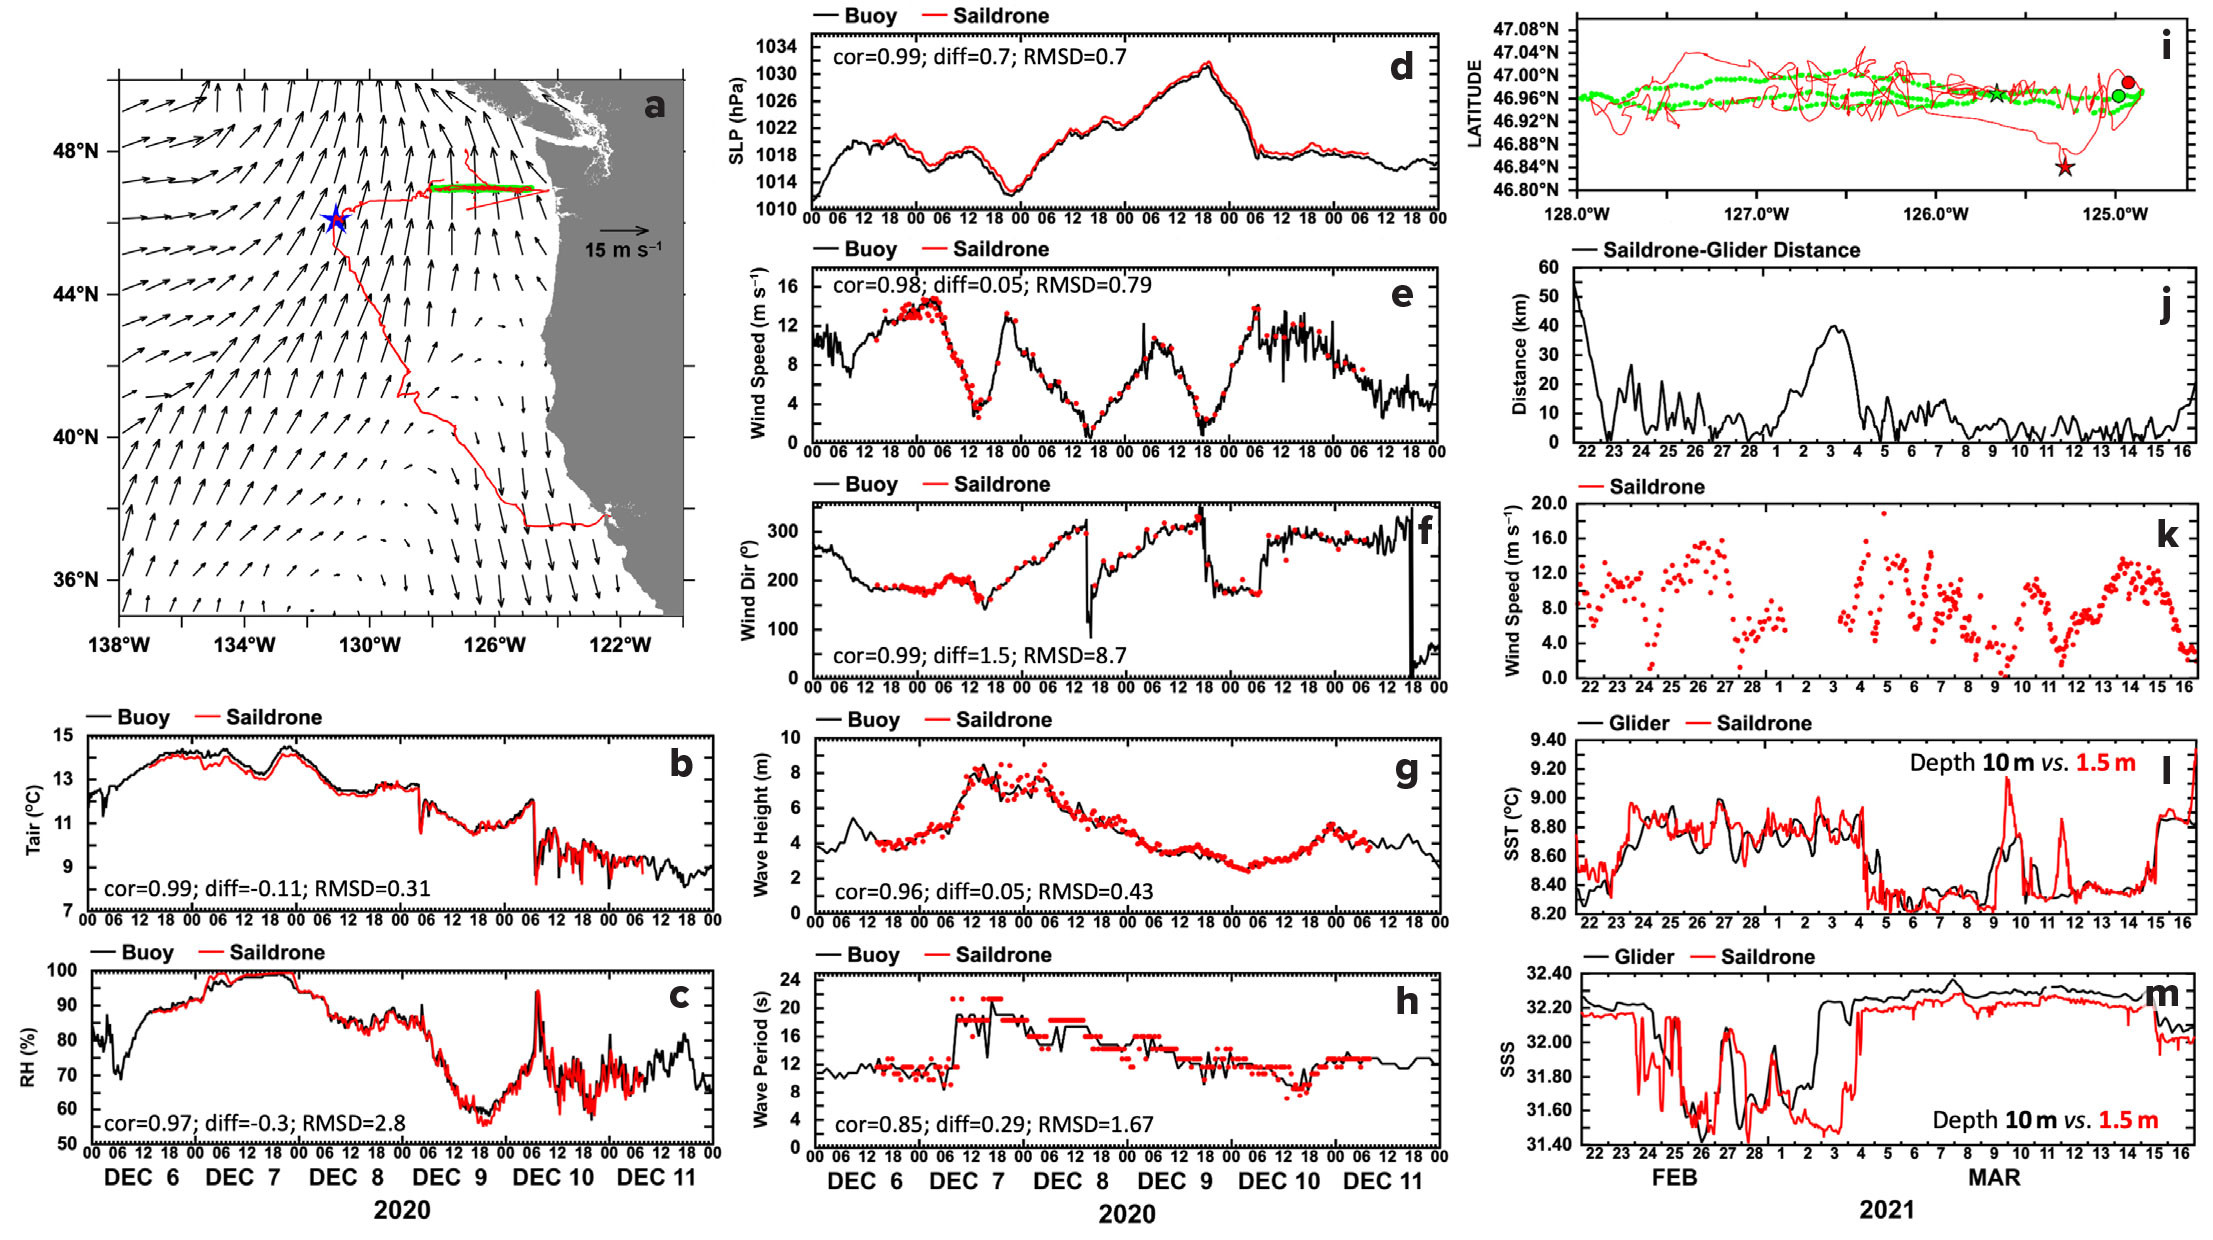
FIGURE 3. (a) During the North Pacific Winter Storm mission, the saildrone’s track (red), the NOAA National Data Buoy Center (NDBC) buoy location (blue star; https://www.ndbc.noaa.gov/station_realtime.php?station=46005), and the underwater glider track (green; https://gliders.ioos.us/erddap/tabledap/ce_383-20210120T2028.subset) are shown overlaid on Advanced Scatterometer (ASCAT) satellite winds for December 7, 2020. (b–h) Intercomparisons of buoy and USV observations of air temperature, relative humidity, sea level pressure, wind speed and direction, significant wave height, and dominant wave period when the two platforms were within 10 km of one another. Solar power in North Pacific winter was limited, so wind sensor sampling was reduced to preserve battery power. (i) Tracks of the saildrone (red) follow those of the underwater glider (green). Circles and stars indicate their locations on March 1 and 3, 2021. (j) Plot shows distances between USV and glider. (k) Wind speed is plotted as measured by the USV. (l) and (m) Sea surface temperature (SST) and sea surface salinity (SSS), respectively, were measured by the USV at 1.5 m depth and by the glider at 10 m depth. > High res figure
|
Short-wing saildrone speeds during the North Pacific Storm mission averaged 0.8 m s–1, two to three times the mean glider speed. However, the glider only reported its location upon surfacing, every four to six hours. To follow the glider, three USV sailing patterns were tested (Figure 3i), including a straight line to the next projected surfacing location and zigzag or figure-8 patterns around the projected glider track on the way to the next surfacing. During February 23 to March 15, the saildrone was within 10 km and 5 km of the glider 70% and 35% of the time, respectively (Figure 3j). The data gap between March 1 and March 4 in Figure 3k was due to missing saildrone wind measurements, which affected the control of vehicle. The experiments showed that the figure-8 pattern did not perform as well as the straight line or zigzag sailing patterns, which it was concluded should be used in hurricane observation missions when coordinating with gliders. The co-located USV and underwater glider measurements show close agreement between SST at 1.5 m and 10 m depths (except during two days when diurnal warming was strong due to weak winds) but a consistent difference in salinity (Figure 3l,m), suggesting the existence of a salt-stratified barrier layer below the mixed layer. In the tropics, a fresh ocean surface and barrier layer can help maintain warm SST, which supports hurricane intensification. Coordinated USV and glider observations will be essential for observing hurricanes (Miles et al., 2021).
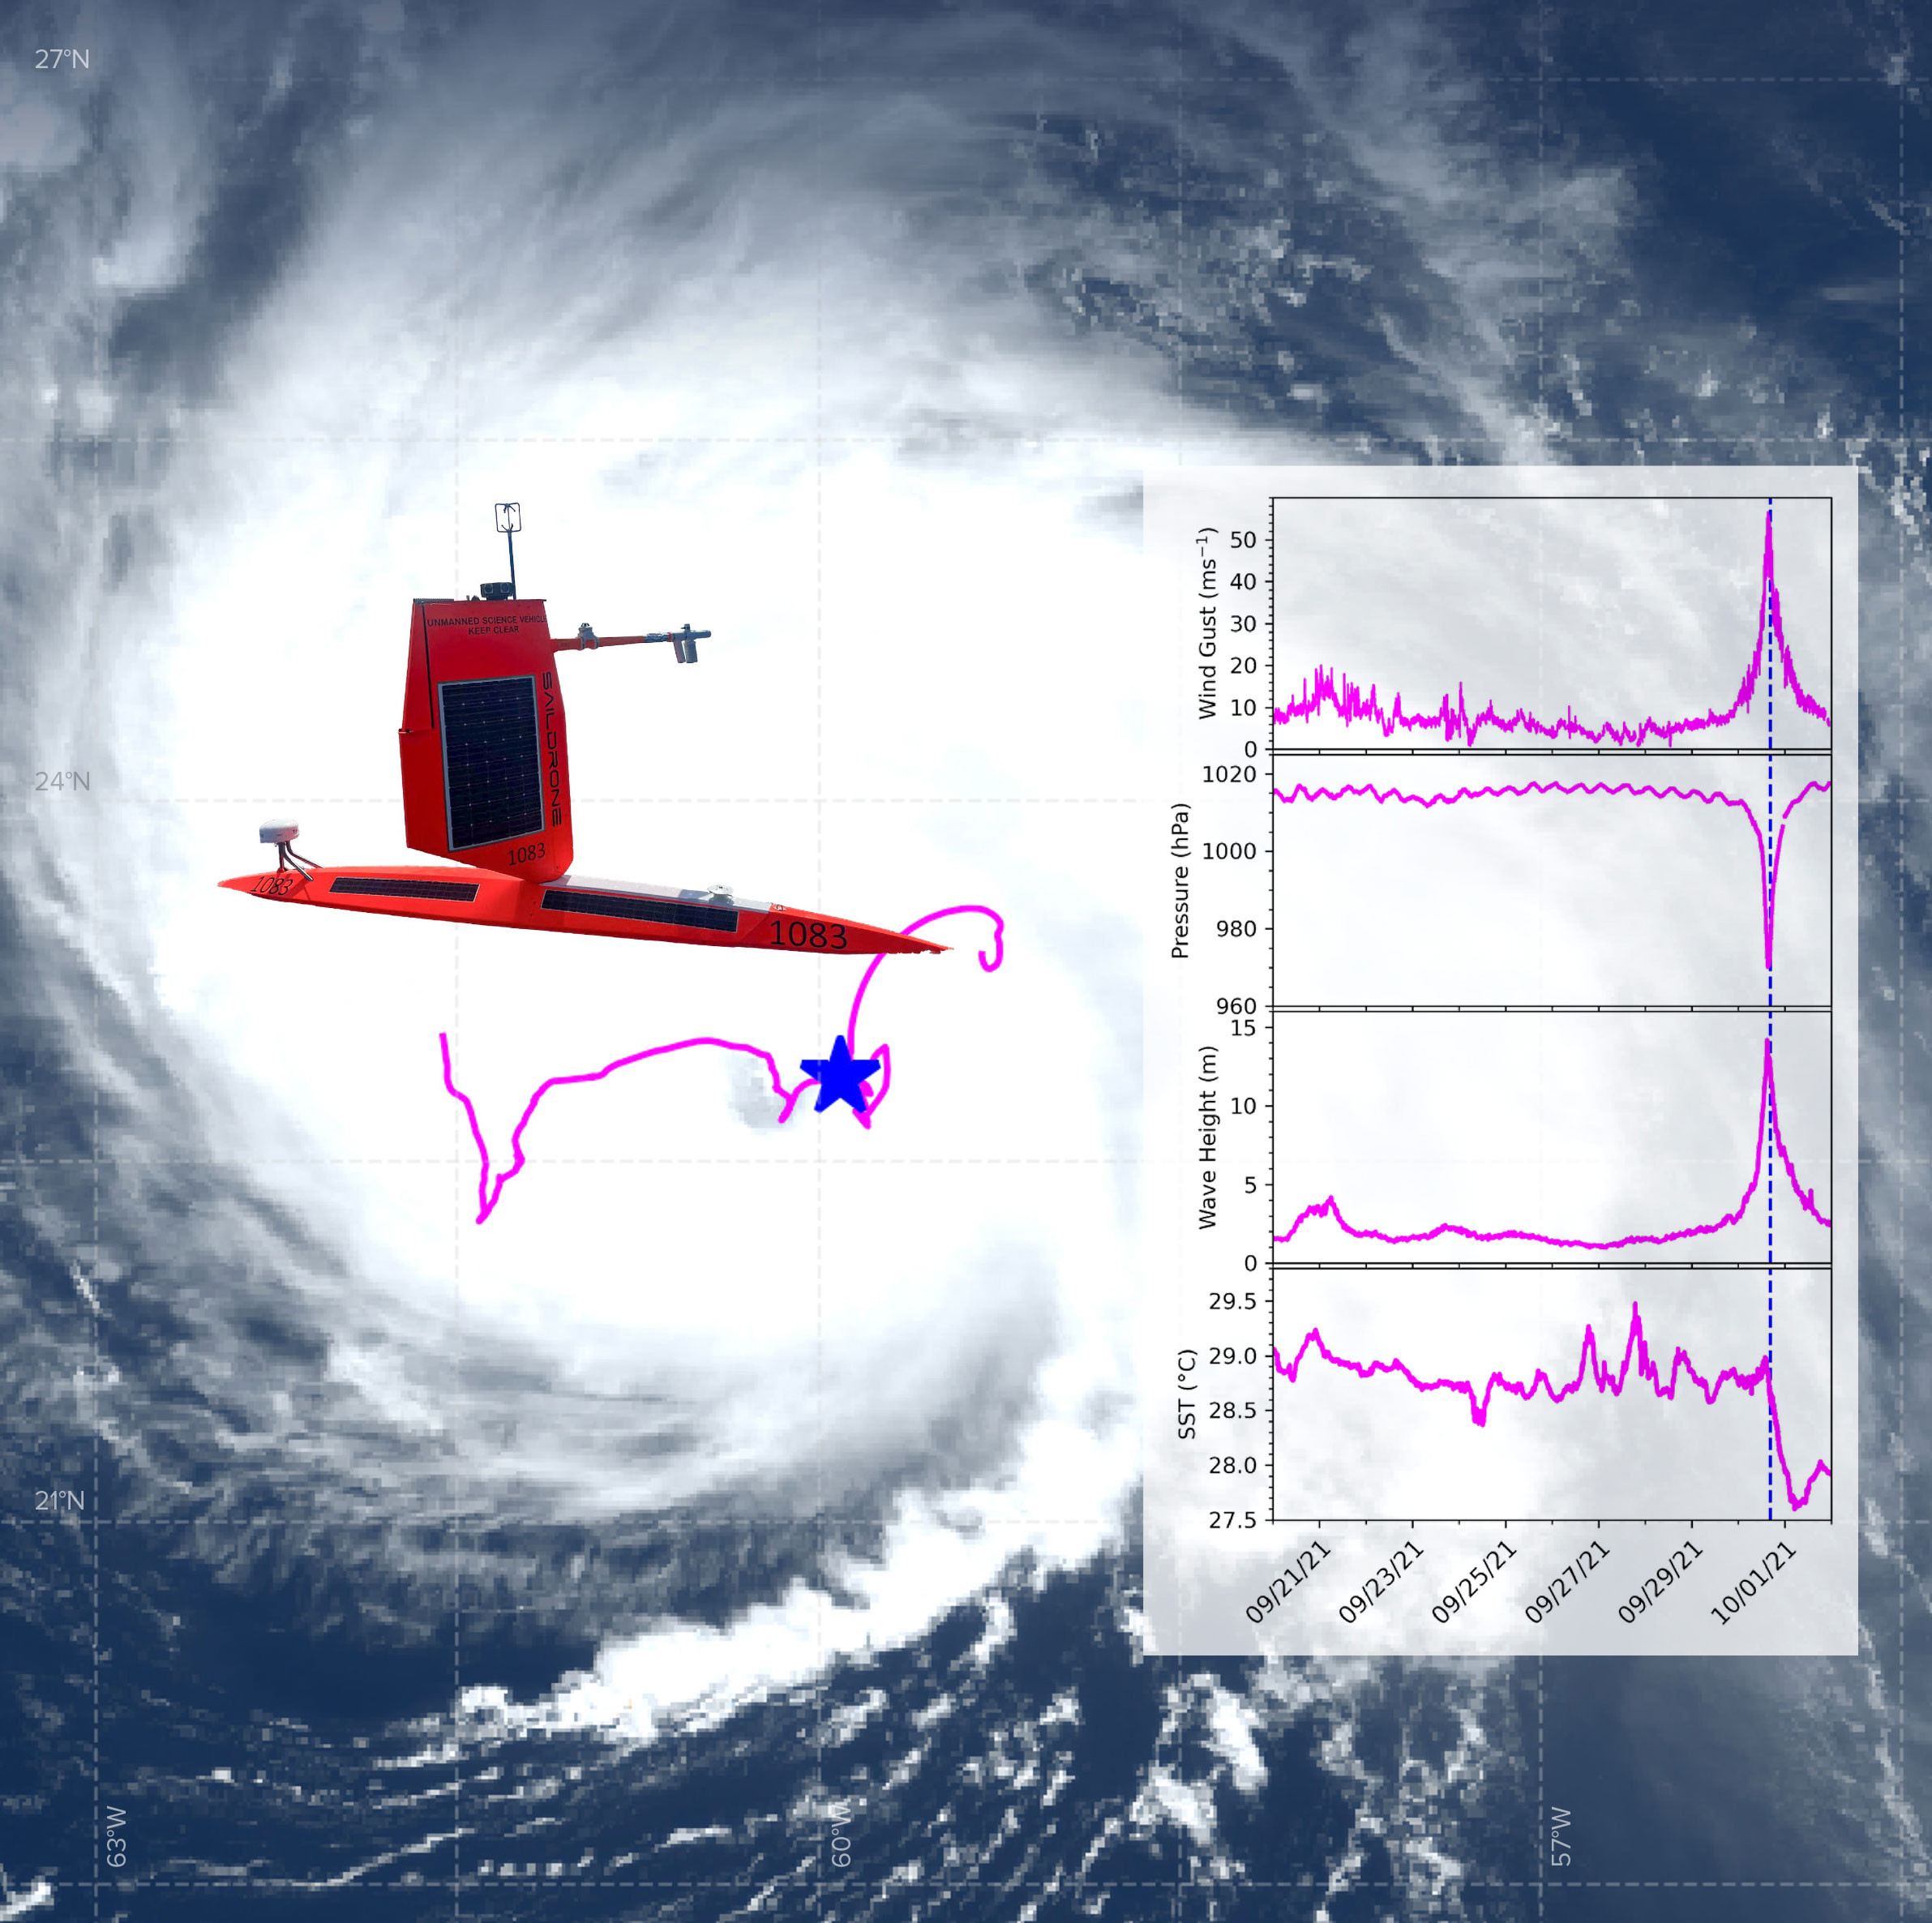
The short-wing saildrone performed well during the test mission, surviving multiple winter storms with winds exceeding tropical storm force (>17 m s–1) and significant wave heights greater than 9 m. However, there was a rudder malfunction in late December that had to be fixed in February with a retrieval of the USV and redeployment at Gray’s Harbor, Washington. The lessons learned and experience gained during the North Pacific Storm Mission played key roles in the success of saildrone observations during the 2021 and 2022 Atlantic hurricane seasons. Five remotely piloted saildrones successfully intercepted five tropical storms as well as category 4 Hurricane Sam (Foltz et al., 2022) in 2021, which had a measured maximum sustained wind of 41 m s–1, gusts of 57 m s–1, and significant wave height of 14 m. Three saildrones were coordinated with underwater gliders and dropsondes deployed by hurricane reconnaissance flights. Figure 4 illustrates how four saildrones were mobilized in 10 days to intercept and measure different stages of Hurricane Fiona in 2022. With only three days of lead time, Saildrone SD1083 was prepared to sail into Fiona when it was a tropical storm, on September 15, 2022; SD1031 was positioned to intercept Fiona one hour after it intensified to a hurricane south of Puerto Rico; SD1040 turned southward away from the underwater glider it was following and measured tropical storm-force winds north of Puerto Rico where Hurricane Fiona made landfall; the direction of SD1078 was adjusted so that it followed the predicted track for Fiona (Figure 4a) and finally reached a position near the eyewall of the hurricane when it was at category 4 strength (Figure 4b).
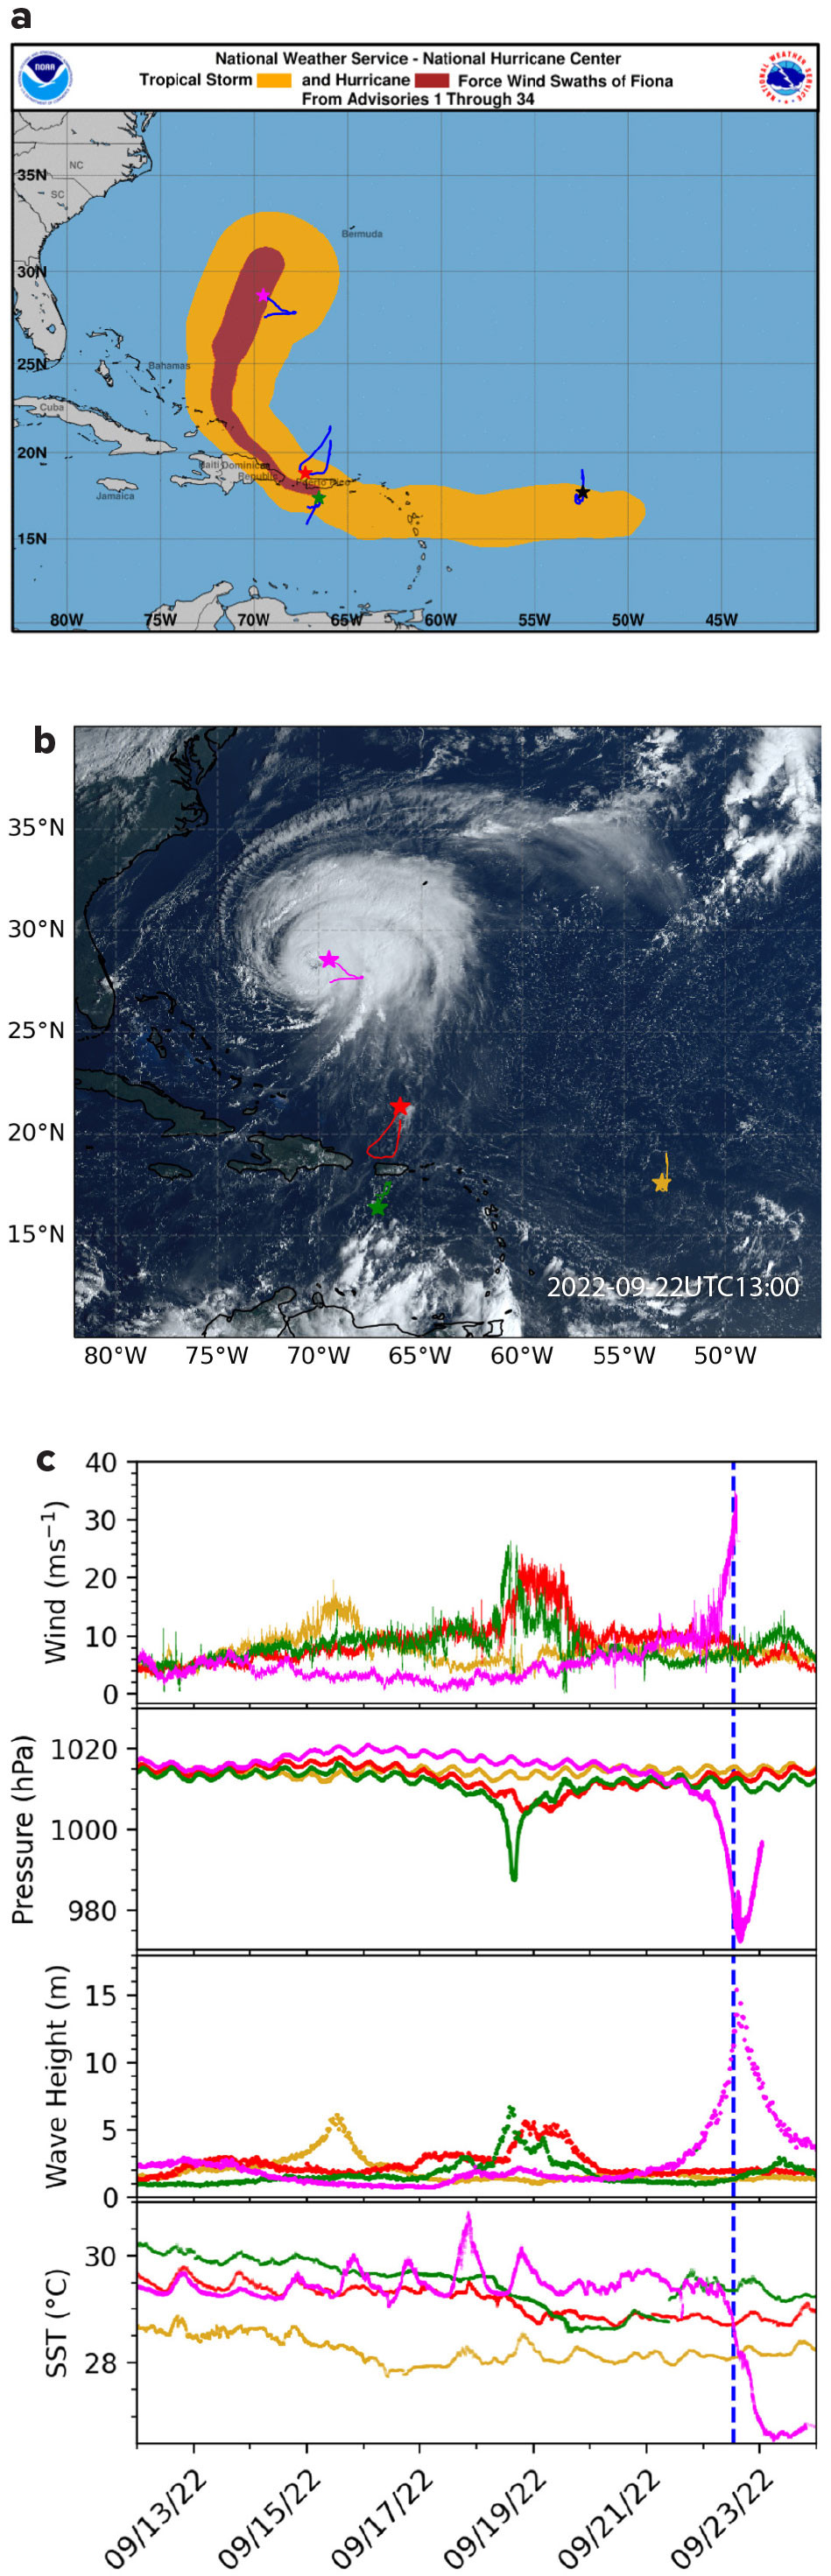
FIGURE 4. (a) Tracks of four saildrones that were mobilized during September 13–23, 2022, to intercept Hurricane Fiona at different stages from tropical storm to category 4 hurricane. Stars indicate the USV locations closest to the storm center. (b) Stars superimposed on a GOES satellite image of Hurricane Fiona at category 4 indicate USV locations on September 22, 2022, at 1300 UTC. (c) Time series of 1-minute mean wind speed, sea level pressure, significant wave height, and sea surface temperature (SST) from the four saildrones, designated SDs 1083, 1031, 1040, and 1078, as they measured Fiona in sequence: SD1083 (gold), SD1031 (green), SD1040 (red), and SD1078 (magenta). The vertical blue line marks 13:00 UTC. > High res figure
|
Summary
The accelerated development of un-crewed systems in recent years has led to their deployments in many areas of scientific research as well as in military and commercial sectors. Zero-emission saildrones, although slow, have long endurance, and can be launched from shore and sail to remote areas of the world ocean. With decades of experience and knowledge of moored buoy and shipboard observations, PMEL has collaborated with Saildrone Inc. to develop the USV into an air-sea interaction observing platform and has tested its performance in the open waters of the tropical Pacific and the Bering Sea. Guided by satellite imagery and numerical sea ice prediction, saildrones have followed the seasonal sea ice retreat from the Bering Sea into the Chukchi and Beaufort Seas and allowed experimental observations within the marginal ice zone. Their potential was thus successfully demonstrated for sustained observations of air-sea interaction processes in the vast remote high-latitude ocean, where rapid seasonal ice retreats and advances make measurements with traditional long-term monitoring platforms such as moored or free-drifting buoys difficult.
To fill gaps in high-quality continuous measurements at the air-sea interface inside hurricanes, where strong air-sea heat and momentum fluxes are key to storm intensification, PMEL, AOML, and Saildrone Inc. developed the short-wing saildrone to survive extreme hurricane-strength winds and waves. Although saildrones move more slowly than typical hurricane translation speeds, with careful planning and preparation based on forecasted hurricane tracks, PMEL and AOML scientists have successfully directed short-wing USVs into the eyewalls of category 4 hurricanes to collect and transmit data to the GTS in real time to be used by operational centers for hurricane prediction and situational awareness. The saildrones’ capability for adaptive sampling and the ease with which these platforms can be coordinated with other observing platforms will greatly expand the current GOOS network’s geographic extent and capacity for monitoring multiscale, multi-process air-sea interaction processes.
The quick development of saildrones from a sailing vehicle to an ideal observing platform that can make field-validated, high-quality, state-of-the-art measurements of air-sea interaction is a great example of a public-private-partnership (PPP). The use of saildrones to obtain high-quality data within GOOS requires even closer PPP because the data are collected on a “pay-for-service” or “data-buy” basis: the platform and most of its sensors are owned, operated, and maintained by Saildrone Inc., and scientists are responsible for designing the sampling scheme that dictates where, when, and how measurements are made. For scientists or government agencies, this requires no up-front investment and eliminates the cost of ownership and maintenance. A fixed daily rate for data-mission days also allows for a science mission with predictable costs, which is particularly important for observing extreme ocean and weather events. The risks of loss and potential damage to the platform and sensors are not taken by scientists but by the private partner and are diluted by the use of a large USV fleet making observations over the global ocean in diverse environmental conditions. While the dedication of the private partner to providing well-maintained observing platforms and sensors is important, the ability of scientists or customers to guide and supervise pre- and post-mission sensor calibration and to employ the best possible adaptive sampling strategies in real time are also critical to science mission success and the collection of high-quality data that can be integrated into the GOOS network. Looking to the future, the mutually beneficial PPP will continue to be the cornerstone for developing next-generation USVs for global ocean observation in order to improve the prediction of climate variations and extreme ocean and weather events.
Acknowledgments
The authors would like to acknowledge the support of NOAA’s Weather Program Office (WPO), Office of Marine and Aviation Operations (OMAO), Global Ocean Monitoring and Observing Program (GOMO), Oceanic and Atmospheric Research (OAR) Ocean Portfolio, Pacific Marine Environmental Laboratory, and Atlantic Oceanographic and Meteorological Laboratory. This publication is partially funded by the Cooperative Institute for Climate, Ocean, and Ecosystem Studies (CICOES) under NOAA Cooperative Agreement NA20OAR4320271, Contribution No. 2023-1254. This is PMEL contribution 5492.