Introduction
This paper presents the preliminary findings of an observational array, comprised of an eXpendable Spar (X-Spar) buoy, an Air-Launched Autonomous Micro-Observer (ALAMO) profiling float, and two Seagliders, that observed the passage of Extratropical Cyclone Epsilon during the Near Inertial Shear and Kinetic Energy in the North Atlantic Experiment (NISKINe). We investigate the input of near-inertial and kinetic energy into the upper ocean, specifically in relation to how these phenomena impacted upper-ocean structure as a result of the storm’s passage. We describe the methodology used to summarize the development of an autonomous approach to observing hurricanes and extratropical cyclones and to elucidate how similarly designed observational campaigns can be further used to study the physics governing the evolution of upper-ocean dynamics during and after storms.
Background
Atmospheric forcing (chiefly time-varying wind stress) at the air-sea interface can resonantly incite motions that oscillate at frequencies constrained by Earth’s local rotation rate. Motions around this frequency, called near-inertial internal waves (NIWs), dominate upper-ocean dynamics (Pollard, 1970; D’Asaro et al., 1995) such as shear and strain on vertical scales of tens to hundreds of meters (Alford et al., 2016). When NIWs grow sufficiently energetic, they create large velocity shear at the base of the mixed layer, which sustains shear-driven mixing at the base of the mixed layer (Large and Crawford, 1995; Plueddemann and Farrar, 2006; Johnston et al., 2020). Furthermore, while a portion of this near-inertial energy is dissipated as local mixing, some low-mode NIWs have been observed radiating into the ocean interior and laterally (Lee and Niiler, 1998; Sanford et al., 2011). While their effects are evident, questions around the life cycle of NIWs still remain (Thomas and Zhai, 2022).
Historically, the transition from fall to winter is when the North Atlantic exhibits its strongest atmospheric forcing (Marshall et al., 2009; Silverthorne and Toole, 2009). Storms transport cold and dry continental air masses over the ocean and thus drive some of the largest momentum, heat, and moisture fluxes across the air-sea interface. A key characteristic of North Atlantic storm winds is that their cyclonic rotation is on a comparable timescale to the NIWs that develop in response to the surface forcing, which suggests a resonant response (Plueddemann and Farrar, 2006; Alford and Whitmont, 2007). Significant synoptic-scale (>1,000 km) features worth investigating in this regard are hurricanes and extratropical cyclones (Price, 1981).
Hurricanes (tropical cyclones; TCs) feature organized, deep, moist convection and a closed, symmetric wind field that circulates about a definable center. When TCs propagate northward into the extratropics, they lose their tropical characteristics (Jones et al., 2003). A degradation of tropical characteristics is linked to the shift from a convective regime to a baroclinically driven extratropical regime. Many Atlantic hurricanes transition to extratropical cyclones (ETCs) after entering the mid-latitudes, especially during late fall when the meridional temperature gradient is enhanced by a process called extratropical transition (Hart and Evans, 2001; see online supplementary Figure S1). As a TC propagates northward, the baroclinic influence leads to increased likelihood that the storm will interact with atmospheric features such as upper-level troughs or fronts (Evans et al., 2017). As a result, ETCs are fast-moving, powerful storms that continue to produce intense rainfall, large waves, and hurricane-strength winds despite their non-TC status (Jones et al., 2003). Thus, they continue to pose a significant threat in many of the same ways that a TC does. Two such societally impactful examples are the infamously remembered “Perfect Storm” (1991; Pasch and Avila, 1992; Davis and Dolan, 1992; Junger, 1997) and “Superstorm” Sandy (2012; Blake et al., 2013).
Leveraging Autonomous Instruments
Not only do some ETCs pose a comparable threat to that of major TCs, but they also present a significant forecasting problem. Most extratropical transition events occur while the storm is over the open ocean and after routine aerial reconnaissance flights have ended so that satellite diagnostic techniques are the only tools available to forecasters. While satellite observations provide data for coupled numerical prediction model initialization, the lack of in situ data, as well as uncertainties in satellite observations due to clouds and precipitation, cause significant errors (Goni et al., 2017). As a result, monitoring extratropical transition events and predicting ETC track and intensity are challenging problems. One way to bolster ETC observational and forecasting efforts is to strategically deploy autonomous and Lagrangian platforms and sensors (ALPS; see Lee et al., 2017, for a review) ahead of and in the storm environment (Domingues et al., 2019; Jayne et al., 2022).
While accurate storm track forecasting has improved over the past few decades, intensity forecasting has lagged behind but steadily improved since the early 2000s (Cangialosi et al., 2020), in part because of increased in situ ocean observations (Domingues et al., 2019). ALPS such as surface drifters, profiling floats, and gliders have been used to observe upper ocean structure during the passage of a TC since Electromagnetic-Autonomous Profiling EXplorer (EM-APEX; Sanford et al., 2005) floats were deployed ahead of Hurricane Frances (2004) during the Coupled Boundary Layer Air-Sea Transfer (CBLAST) program (Black et al., 2007). In a post-storm analysis, Sanford et al. (2011) argued that the unique capabilities of profiling floats made them prime candidates for investigating upper ocean response to significant forcing events. These observations supported the Price (1981) theoretical model for explaining how the passage of a TC affects upper ocean structure.
Thereafter, Halliwell et al. (2011) identified that ALPS, specifically profiling floats, were proficient for initializing coupled numerical prediction models that produce intensity forecasts (DeMaria et al., 2005; Halliwell et al., 2015; Mogensen et al., 2017). Thus, profiling floats and gliders have been strategically deployed ahead of storms to survey upper ocean temperature and salinity structures (Jayne et al., 2022; Miles et al., 2022) to provide the three-dimensional, in situ observations necessary for most-accurate intensity forecasts. Sanabia et al. (2013) further demonstrated how the real-time delivery of upper ocean temperature profiles to coupled numerical prediction models significantly improved TC track and intensity forecasts. These studies built a framework for producing more accurate intensity forecasts by strategically deploying ALPS along storm tracks to assimilate real-time subsurface observations to better constrain modeling and forecasts (Goni et al., 2017).
Post-storm analyses depend heavily on ALPS to investigate how storm passage affected the air-sea coupled system. Storms are a primary source of momentum, sensible heat, and moisture fluxes across the air-sea interface, and they also input episodic near-inertial and kinetic energy into the upper ocean. Signatures of each are distinguishable thanks to the high resolution and persistent sampling of ALPS. Without the widespread use of ALPS, exploring the evolution of upper ocean dynamics is a challenging problem. However, the capabilities of next-generation autonomous platforms are rapidly advancing the community’s understanding of air-sea interaction, especially in targeted deployments ahead of storms (Chen et al., 2017; Domingues et al., 2019).
2020 NISKINe Deployment
Scientific Design
The NISKINe observational array was deployed on October 4 from R/V Armstrong into an anticyclone eddy south of Iceland (58.4°N, 21.5°W; Figure 1). Of note, a quasi-permanent eddy is often found near this location, colloquially named the PRIME Eddy (Figure S2; Martin et al., 1998). This deployment strategy was designed to keep the components of the array together to facilitate the contemporaneous collection of surface and subsurface data of the subpolar North Atlantic. Though no specific storm activity was targeted, the goal was to leverage the array to observe how strong forcing events, such as locally generated storms, would affect upper-ocean structure.
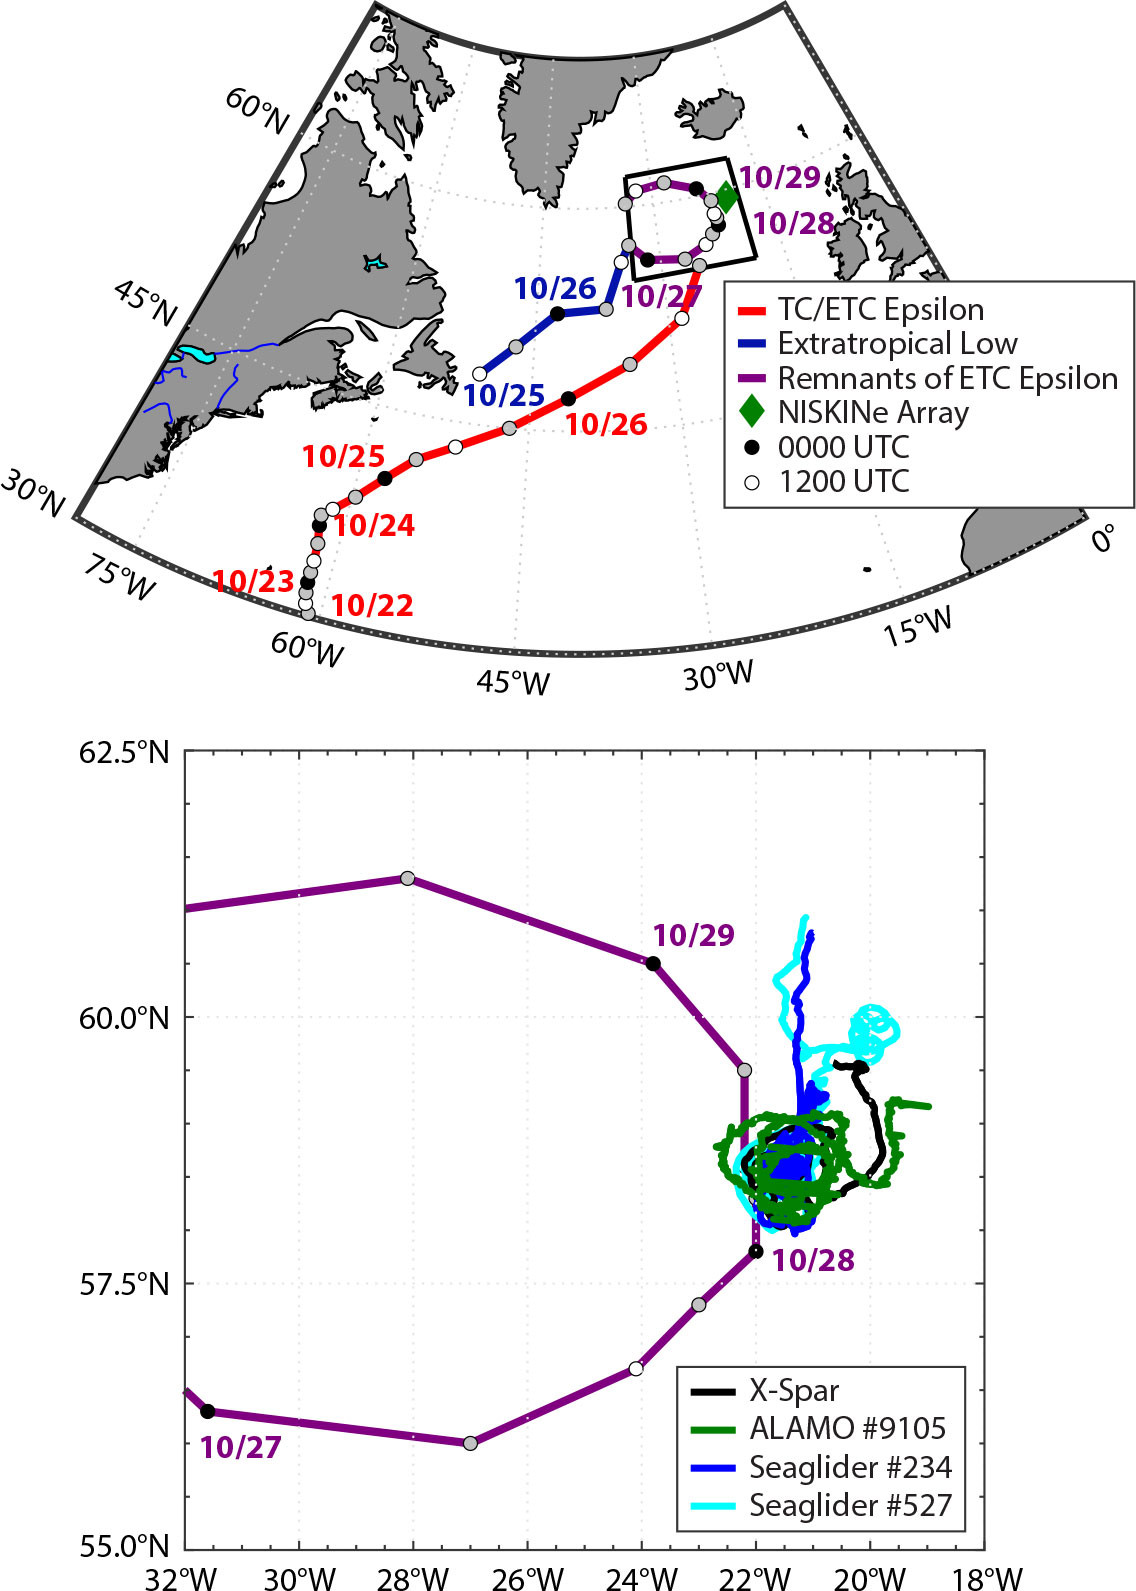
FIGURE 1. (top) Tracks of Hurricane Epsilon (red), an extratropical low (dark blue), and remnants of extratropical cyclone (ETC) Epsilon (purple) through the subpolar North Atlantic with approximate locations of the center of circulation every six hours from 0000 UTC October 25 to 1800 UTC October 29. The approximate position of the Near Inertial Shear and Kinetic Energy in the North Atlantic Experiment (NISKINe) observational array is marked with a green diamond. The black box represents the focused observational area that is highlighted in the bottom panel. (bottom) Remnants of ETC Epsilon (purple) directly interacted with the NISKINe observational array from approximately 1200 UTC October 27 to 1200 UTC October 29. Colored lines show the trajectories of each platform in the array: X-Spar (black), Air-Launched Autonomous Micro Observer (ALAMO) #9105 (green), Seaglider #234 (blue), and Seaglider #527 (cyan). > High res figure
|
X-SPAR
The X-Spar buoy is a recently developed freely drifting platform designed and equipped to investigate air-sea interaction and upper-ocean response to atmospheric forcing (https://www2.whoi.edu/site/casimas/currentprojects/x-spar/; Figure S3). X-Spar supports a variety of sensors above and below the ocean surface, including those required to make direct measurements of momentum and buoyancy fluxes across the air-sea interface. The Direct Covariance Flux System (DCFS; Edson et al., 1998) estimates momentum and buoyancy fluxes and also measures wind speed and direction. The DCFS makes a direct estimate of wind stress (the vertical flux of horizontal momentum) through the calculation of the covariance between the time-varying, motion-corrected, horizontal and vertical wind observations sampled at 20 Hz.
Below the air-sea interface, X-Spar samples the surface wave field using subsurface pressure sensors in conjunction with an inertial measurement unit, and the near-surface stratification using an array of temperature and salinity instruments. The small cross-sectional area and sensor placement 7 m above the air-sea interface induces minimal flow distortion and relative insensitivity to high-frequency waves. Therefore, the raw atmospheric data observed by X-Spar is of higher quality than that observed from ships, autonomous surface vessels, or traditional buoys. During the 2020 NISKINe deployment, X-Spar was programmed to sample on a 66% duty cycle (sequentially sampling for 20 minutes, then processing the observations in the following 10 minutes). A unique capability of X-Spar is its ability to process, compute, and telemeter this high-frequency data in near-real time, which means the instrument does not need to be recovered to collect the desired measurements.
The results from the 2020 NISKINe deployment are being used to both harden the X-Spar telemetry system and increase the robustness of the meteorological sensors and performance in an excited sea-state. Promisingly, X-Spar not only survived the passage of ETC Epsilon but it also returned observations of surface winds peaking above 20 m s–1, wind stresses greater than 1 N m–2, and surface waves with significant wave heights (SWHs) exceeding 10 m. Ultimately, after 45 days of operation, a system failure terminated data transmissions from X-Spar on November 17; the buoy was recovered with the help of the Icelandic Coast Guard on March 24, 2021.
ALAMO
ALAMO is a small profiling float that was originally designed to be launched from aircraft equipped with an “A-sized” launch tube (Figure S4; Jayne and Bogue, 2017). This instrument can persistently monitor the upper ocean over many months, and depending on mission requirements, can last over years. ALAMO was developed to meet the objective of deploying ocean profilers during operational storm reconnaissance missions by the “Hurricane Hunters.” These upper-ocean observations have been used to measure ocean heat content ahead of TCs (Jayne et al., 2022) and to understand the evolution of upper-ocean response during and after a storm (Chen et al., 2017; Sanabia and Jayne, 2020). Along with other ALPS-like surface drifters and gliders, ALAMO can provide a better understanding of air-sea interaction as it pertains to storm activity. During the 2020 NISKINe deployment, ALAMO #9105 was programmed to profile to 200 m approximately every two hours. In addition to a CTD sensor to measure temperature, salinity, and pressure, ALAMO #9105 was also equipped with a Wave Inertial Measurement Sensor (WIMS). WIMS is a compact, low-power nine-axis inertial sensing device designed for use on ALAMO to capture the directional properties of ocean surface waves, enabling rapid targeted deployment in the paths of TCs. Due to the limitations of satellite telemetry bandwidth, WIMS performs onboard orientation estimation, digital signal processing, and spectral analysis. At each surfacing, select co- and quadrature-power spectral densities are averaged across several segments of a 10-minute sample window and transmitted by the float. These spectra can then be used to derive parameters of interest, including SWH, period, and direction. These combined capabilities of ALAMO were leveraged to evaluate the evolution of the upper ocean before, during, and after the passage of ETC Epsilon.
Seagliders
Gliders are buoyancy-driven, long-range autonomous underwater vehicles that collect profiles of temperature, salinity, current velocities, and other ocean parameters (Rudnick, 2016). They steer through the water by autonomously controlling attitude and can thus execute desired survey patterns. Gliders surface at the end of every dive cycle, at which point they can download new commands and upload data via Iridium telemetry (Rainville et al., 2022). Given that gliders propel themselves horizontally, they can be strategically positioned ahead of and hold their positions surrounding the passage of storms to improve understanding of upper ocean processes in relation to storm activity (Miles et al., 2022).
Two Seagliders (Figure S5; Eriksen et al., 2001) were deployed during the 2020 NISKINe cruise, providing spatial coverage around X-Spar and complementing ALAMO by measuring temperature, salinity, and horizontal current velocity. Seaglider #234’s program attempted to shadow X-Spar while Seaglider #527 was executing north-south transects across the observational area. Horizontal current velocities were measured using a Nortek Signature 1000 acoustic Doppler current profiler (ADCP) specifically designed for Seagliders. Each Seaglider collected ADCP data both on the descent and the climb, with 15 vertical bins and a cell size of 2 m recorded every 15 sec. The processing for the Seaglider ADCP generally follows the general methodology described in Todd et al. (2017).
Extratropical Cyclone Epsilon
Given the inherent overlap of sensing capabilities within the NISKINe observational array, the design provided a comprehensive approach to exploring how strong forcing events would affect upper-ocean structure via shear-driven mixing likely caused by near-inertial and kinetic energy. The X-Spar observed meteorological, sea surface temperature (SST), and wave data; ALAMO #9105 observed upper ocean structure and wave data; and Seagliders #234 and #527 observed upper ocean structure and velocity.
Fortuitously, the NISKINe observational array was overrun by remnants of ETC Epsilon from 1200 UTC October 27 to 1200 UTC October 29 (Figure 1). Throughout the storm passage period, the assets were all within 52 km of each other. The closest point of approach between the NISKINe observational array and the storm occurred at 1200 UTC October 28, where each asset was within 51 km from the center of circulation: X-Spar: 8 km; ALAMO #9105: 51 km; Seaglider #234: 40 km; and Seaglider #527: 51 km (Figure 1).
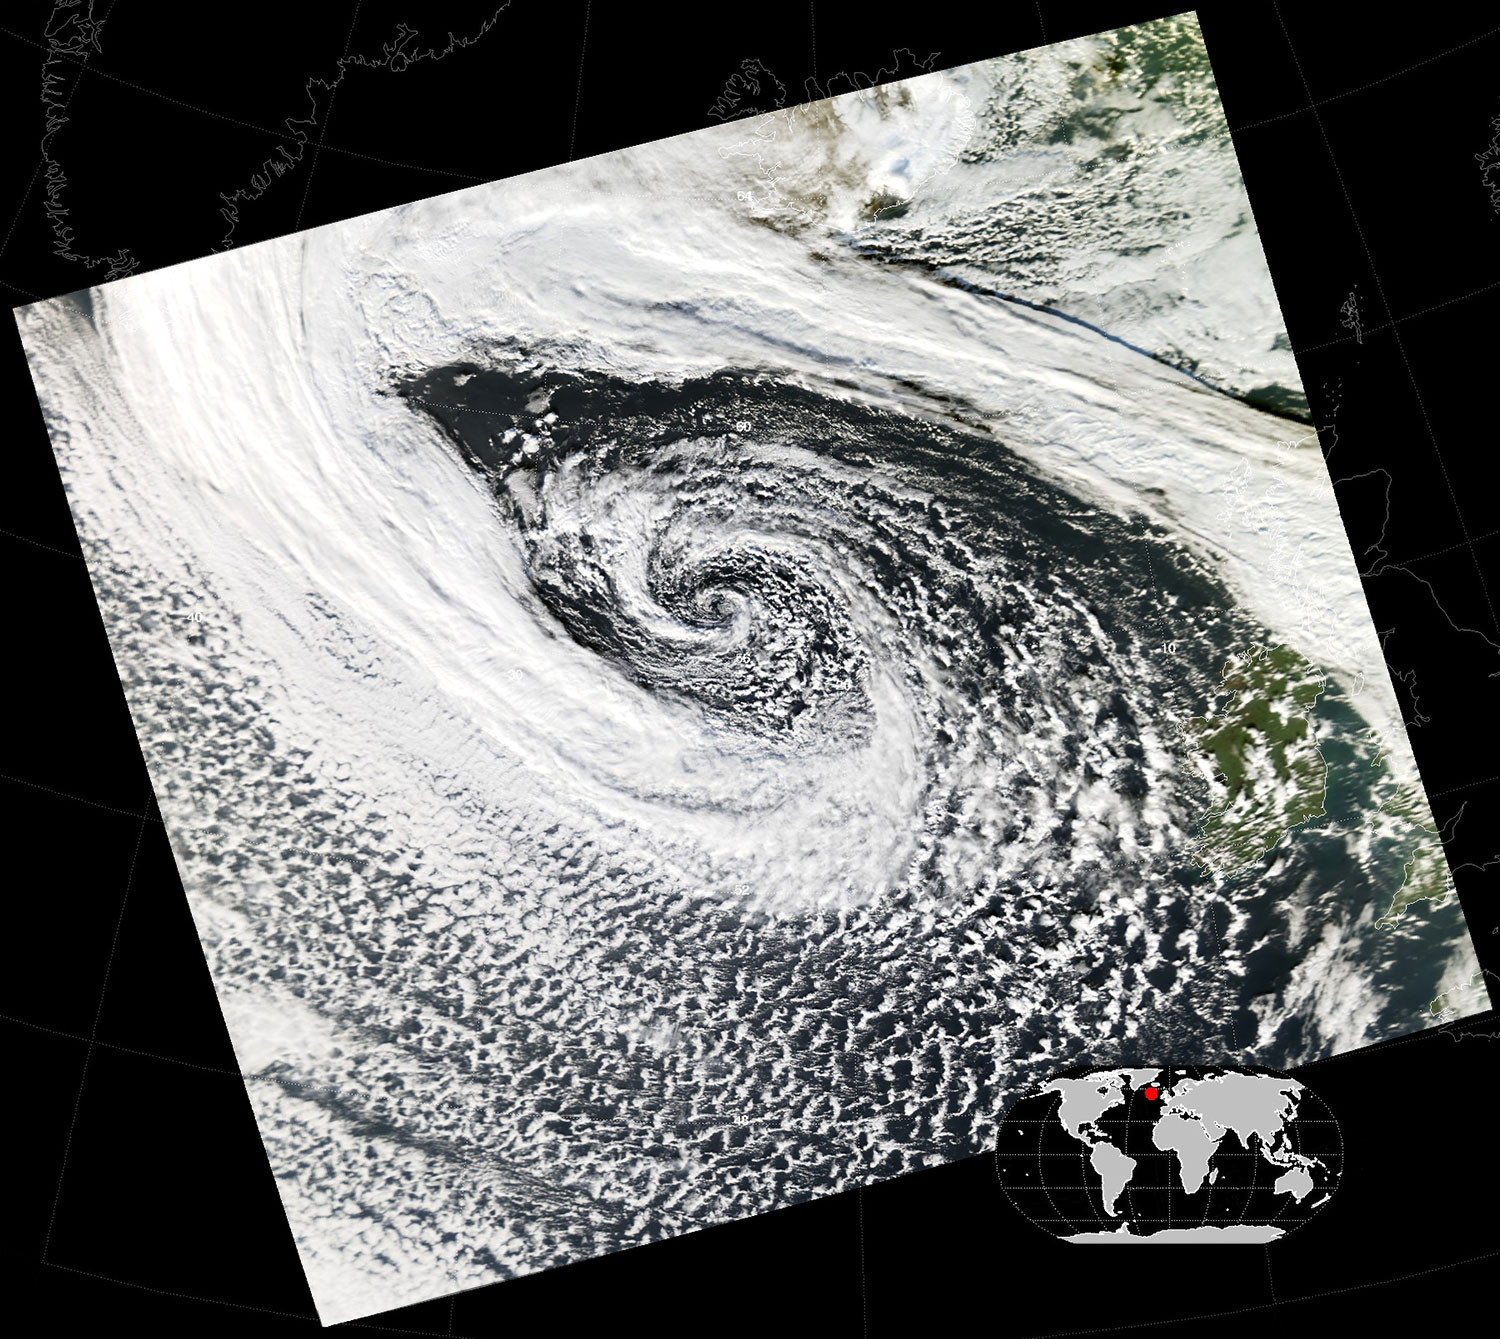
Hurricane Epsilon was a category 3 TC that originated in mid-October 2020 (Figure S6; Papin, 2020). On October 21, Tropical Storm Epsilon rapidly intensified, gained major TC status, and was named Hurricane Epsilon approximately 550 km southeast of Bermuda. The storm underwent extratropical transition and was reclassified as ETC Epsilon at 0600 UTC on October 26 approximately 900 km east of Newfoundland, Canada (Figures 1 and S6). In its final advisory, the National Hurricane Center noted that the storm would remain very dangerous and maintain its track toward the subpolar North Atlantic. An extratropical low absorbed ETC Epsilon by 1800 UTC October 26 (Figures 1 and S6). The merged storm continued a northeast track into the far subpolar Atlantic where it approached the NISKINe observational array (Figure 1). Remnants of ETC Epsilon were identifiable via satellite imagery through the 1800 UTC October 29 forecast (Figure S7).
Surface Ocean Analysis
Surface Pressure
As ETC Epsilon approached the array, X-Spar recorded a deep depression in surface pressure from 1,015 mb at 2310 UTC October 20 to 938 mb at 2340 UTC October 26 (Figure 2). The North Atlantic surface analysis from National Weather Service/National Centers for Environmental Prediction’s Ocean Prediction Center (NWS/NCEP OPC, 2020), issued at 1453 UTC October 27 and valid for 1200 UTC October 27, predicted that the array was in a region of low pressure ranging from approximately 950 mb to 970 mb as the storm approached (Figure S7). X-Spar data captured the sustained low pressure during storm passage, reading surface pressures ranging from 938 mb to 957 mb. The X-Spar surface pressure record indicates that Epsilon-related forcing likely concluded by 0000 UTC November 2 (Figure 2). This pressure observation is slightly lower than the forecasted 940 mb, indicating that the low could have been slightly deeper than predicted by NWS/NCEP OPC (Figures 2 and S7).
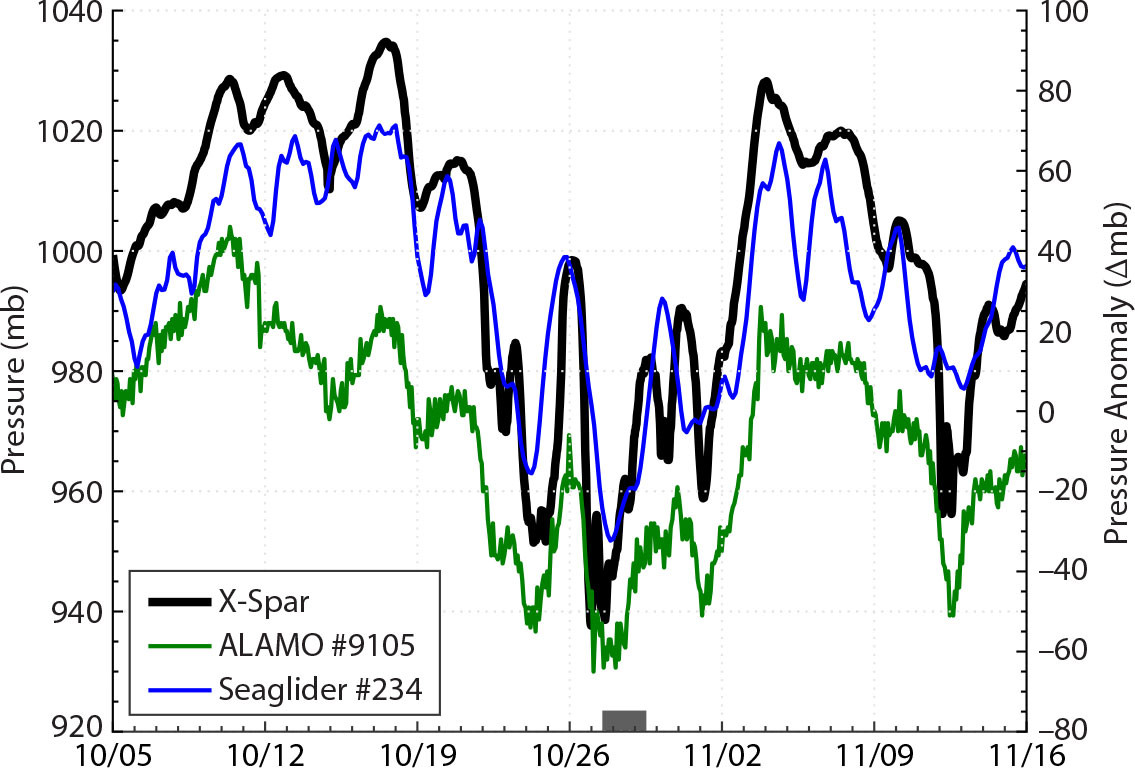
FIGURE 2. Time series of surface pressure (mb) observations from X-Spar (black) and surface pressure anomalies (∆mb) from ALAMO #9105 (green), Seaglider #234 (blue), and Seaglider #527 (cyan) before, during (gray rectangle), and after the passage of ETC Epsilon. > High res figure
|
The ALAMO and Seaglider CTD sensors include pressure transducers for depth, which were leveraged to derive an estimate for the change in surface pressure. When surfacing, both instruments collect a pressure time series so that the profile can be corrected for atmospheric pressure offset. While these measurements are not suitably accurate for measurement of the absolute atmospheric pressure, the effects of the storm are apparent in the calculated surface pressure anomaly and are consistent with that of the X-Spar: ALAMO #9105 recorded a surface pressure anomaly of +5 ∆mb at 2040 UTC October 20, which decreased to –55 ∆mb at 1023 UTC October 24, capturing the deep depression of surface pressure as ETC Epsilon approached (Figure 2); further, ALAMO #9105 supports the sustained low pressure during the passage period, ranging from a –65 ∆mb at 0218 UTC 27 October to a –59 ∆mb at 1323 UTC October 28 (Figure 2).
Similar surface pressure anomalies are seen in the Seaglider measurements, which were approximated as water depth offset; note that the total range in pressure associated with the passage of ETC Epsilon (~100 mb) corresponds to about 1 m of equivalent sea surface height from the inverted barometer effect (Figure 2). The surface pressure anomaly records indicate that Epsilon-related forcing had ceased by November 3. It remains to be seen how these measurements could be of use to operational centers; however, the agreement between the instruments is encouraging.
Surface Forcing
Wind stress observations were made by the X-Spar buoy using the DCFS package to estimate turbulent momentum flux along with bulk wind speed and direction (Edson et al., 1998). X-Spar recorded a maximum wind stress of 1.3 N m–2 at 2210 UTC October 26 (along with a 7 m wind speed of 21 m s–1), which signaled the arrival of the first band of extreme winds (Figure 3). The passage of a cold front at 0140 UTC October 27 was also well captured when wind stress fell to 0.1 N m–2 and then rapidly recovered into the second band of extreme winds (Figure 3). By 1010 UTC, the second band of extreme winds caused wind stress of 1.0 N m–2 which corresponds to the passage of the center of circulation as deduced by the minimum surface pressure (Figure 2). At 1140 UTC October 28, X-Spar measured a wind stress of 0.0 N m–2 (Figure 3). Wind stress then rebounded into the third and fourth bands of extreme winds, peaking at 0.7 N m–2 at 1940 UTC October 28, and 1.0 N m–2 at 1210 UTC October 30, respectively (Figure 3).
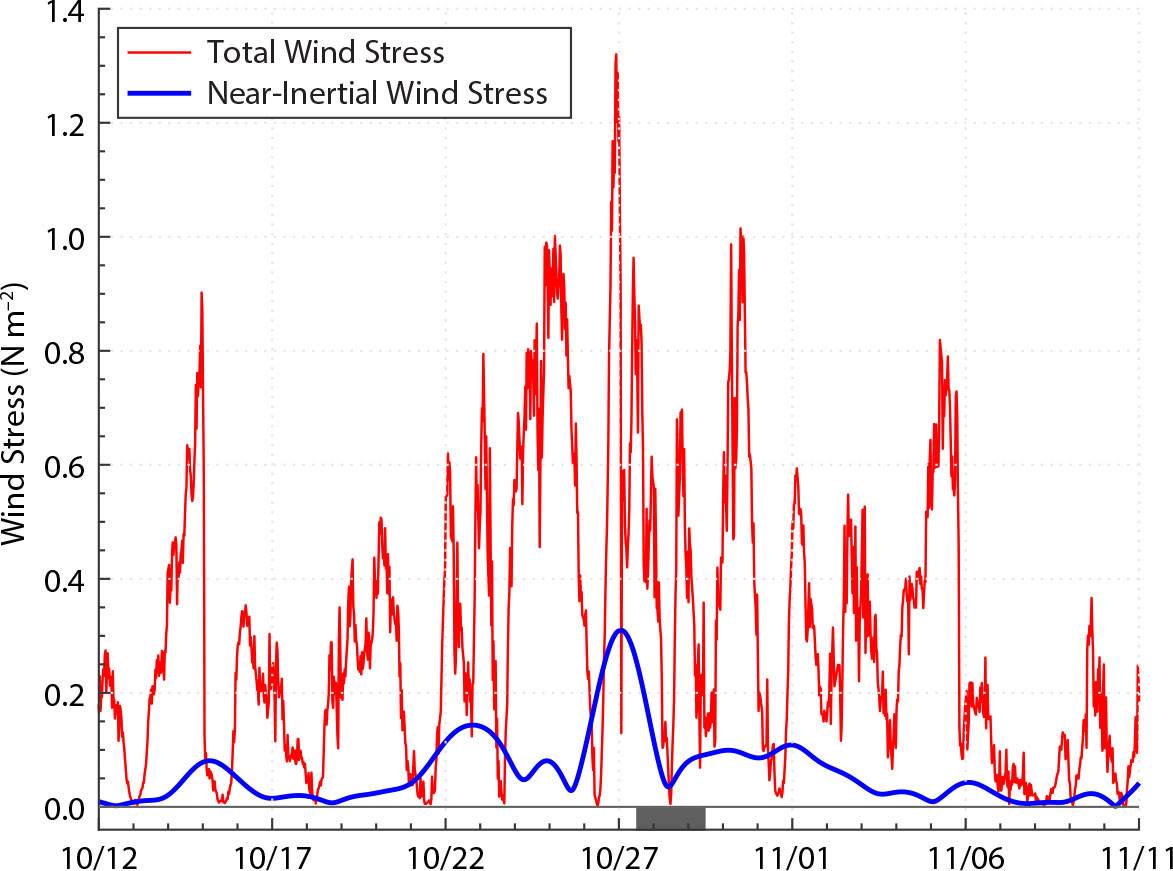
FIGURE 3. Time series of total and near-inertial wind stress (red and blue; N m–2) from X-Spar before, during (gray rectangle), and after the passage of ETC Epsilon. > High res figure
|
Following the methodology outlined by Liu and Miller (1996), a band-pass filter at the local inertial frequency (~14 hours) using a complex Morlet wavelet demodulation and filter-width of one day was used to extract near-inertial wind stress from the total wind stress (Figure 3). The inertial-band-passed time series shows a major source of near-inertial energy as ETC Epsilon approached the NISKINe observational array. Around October 22, the near-inertial wind stress increased due to forcing from the previously mentioned deep fall low that preceded ETC Epsilon (Figure 3). The influence of ETC Epsilon is apparent, as the maximum near-inertial wind stress coincided with the approach and passage of the storm. The peak in near-inertial wind stress (0.3 N m–2) occurred on October 27 (Figure 3), and after the passage of the storm, near-inertial wind stress drastically subsided.
Sea State
At 1200 UTC on October 27, the largest waves in the global ocean were due to ETC Epsilon (Figure S8). The result was record-breaking surf along the European Atlantic coast, highlighted by a 32.3 m rogue wave off of Ireland observed on October 28 (Guidhir et al., 2022). The sea-state analysis for 1200 UTC on October 27 (NWS/NCEP OPC, 2020) indicated that 7 m to 9 m SWHs were in the vicinity of the NISKINe observational area (Figure S9). Both platforms observed higher than forecasted SWHs: ALAMO #9105 reported maximum SWHs of 9.8 m at 1911 UTC October 27, while X-Spar measured 11.1 m at 1910 UTC (Figure 4). These observations suggest that the sea-state was slightly larger than NWS/NCEP OPC predicted.
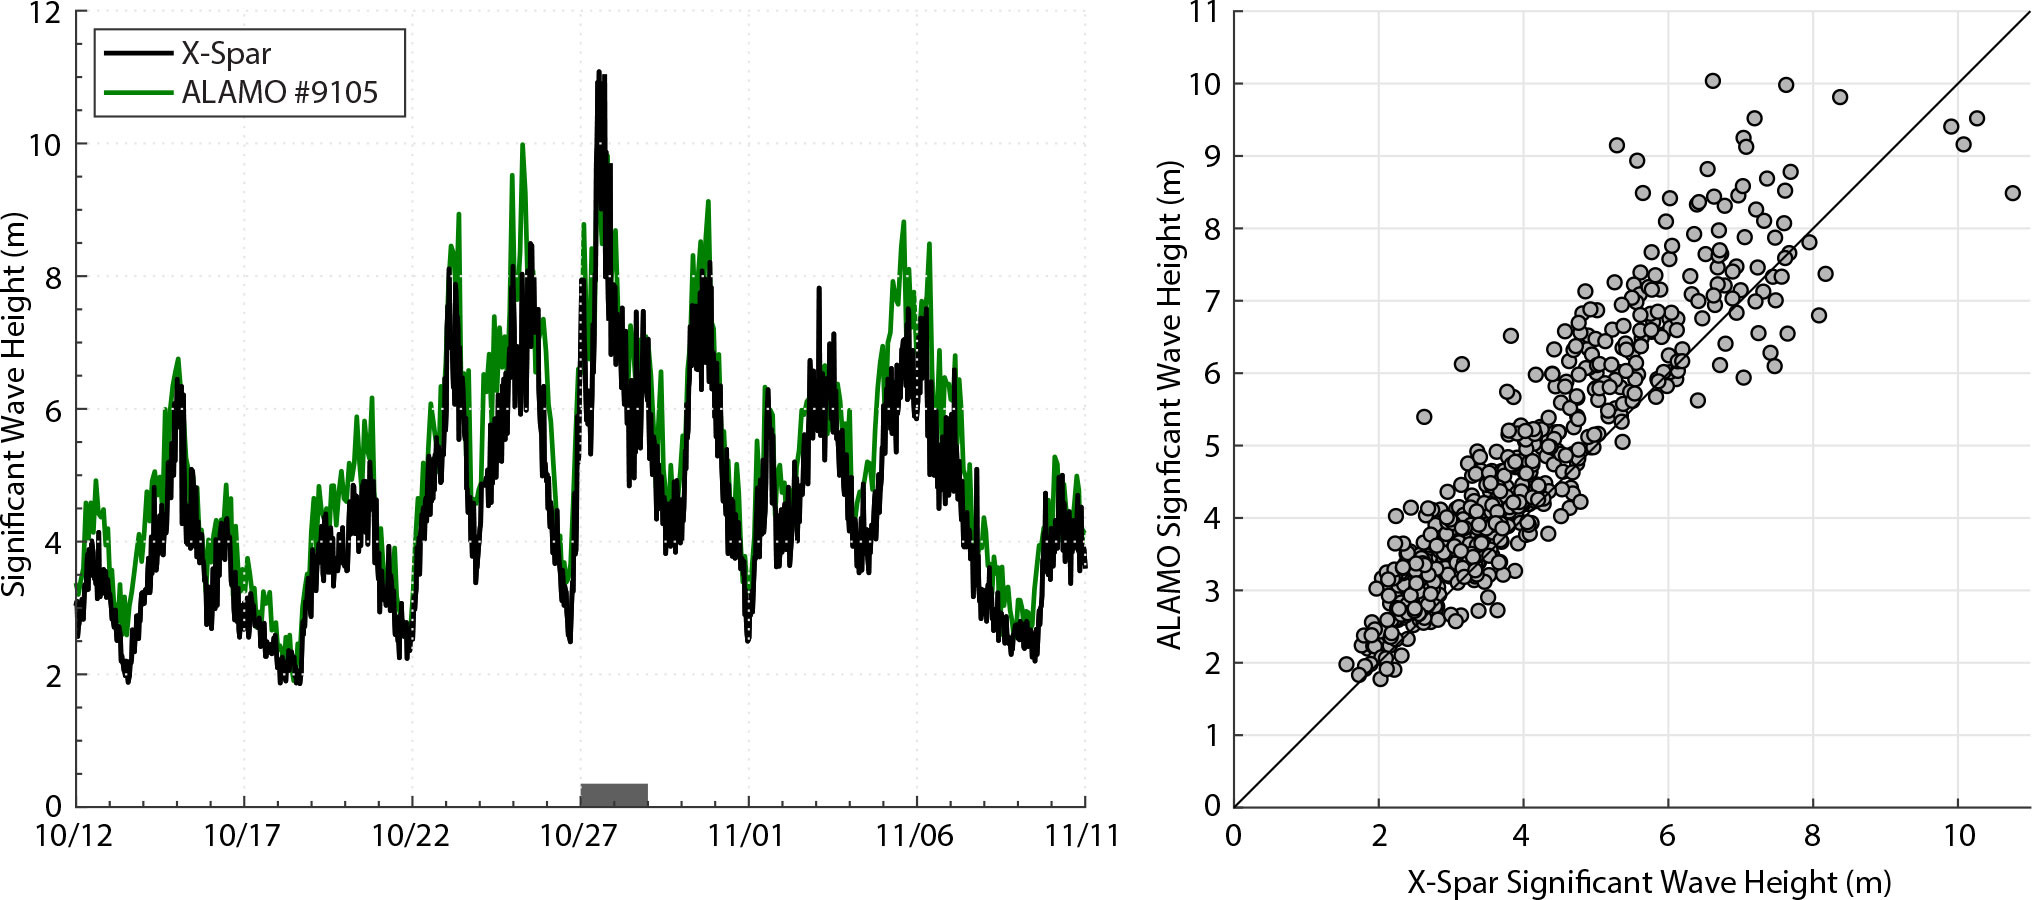
FIGURE 4. (left) Time series of significant wave height (SWH) observations from X-Spar (black) and ALAMO #9105 (green) before, during (gray rectangle), and after the passage of ETC Epsilon. (right) Scatter plot of X-Spar and ALAMO #9105 SWH observations with a one-to-one line for comparison. > High res figure
|
Post-storm analysis shows that the ALAMO and X-Spar wave data compare remarkably well. However, the design of X-Spar likely led to a tendency to measure slightly lower SWHs (~0.5 m) than ALAMO #9105 (Figure 4). By design, X-Spar heave is relatively insensitive to high-frequency waves, but the buoy does follow the motion of the low-frequency swell. The low-frequency component of the wave field is estimated by the heave of the platform observed by the inertial motion package. The high-frequency component is sensed by the subsurface pressure sensor; the combination yields estimates of the total wave field. However, the wave-induced pressure signal decays exponentially with depth, and although an (ad hoc) attempt was made to compensate for the bias, this is the most plausible reason for the slight discrepancy between the X-Spar and ALAMO #9105 SWH measurements (Figure 4).
Subsurface Ocean Analysis
Temperature and Salinity Structure
The NISKINe observational array measured SSTs before, during, and after the passage of ETC Epsilon. All four instruments had similar readings, while the trends in the data were exactly the same (Figure S10). On October 12, X-Spar measured surface air temperatures of 10.5°C with SSTs of 11.3°C. From October 19 to 26, as the storm approached, the air temperature decreased by approximately 3°C, while SSTs dropped 0.5°C. From October 27 to November 2, SSTs decreased another 0.5°C from 10.8°C to 10.3°C, while the air temperature fluctuated from 5.6°C to 9.2°C. Although an anomalous warm air mass intruded into the observational area from November 3 to 6, which likely caused the slight warming of SSTs observed during this period (Figure S10), the prominent cooling directly after the storm passed is evidence of ETC Epsilon’s “cold wake.” Surface and upper ocean cooling in the wake of a storm is often noted in satellite observations after TC passage due to the entrainment of cold subsurface water into the mixed layer (Mrvaljevic et al., 2013; Sanabia and Jayne, 2020). Observations from the NISKINe observational array suggest such surface cooling was a result of the passage of ETC Epsilon.
ALAMO #9105 and Seaglider #234 observations from October 12 to November 11suggest a strong and enduring upper-ocean response due to the passage of ETC Epsilon (Figures 5, S10, and S11). Minimal upper-ocean variability was observed prior to the approach of Epsilon-induced surface forcing; however, upper-ocean conditions started to change on October 26, coinciding with the arrival of the first band of extreme winds (Figure 3) and an excited sea state (Figures 4 and S9). Beneath the strong surface forcing, vertical records of the temperature, salinity, density, and stratification suggest that the passage of ETC Epsilon led to strong mixing and a deepened mixed layer (Figures 5, S11, and S12).
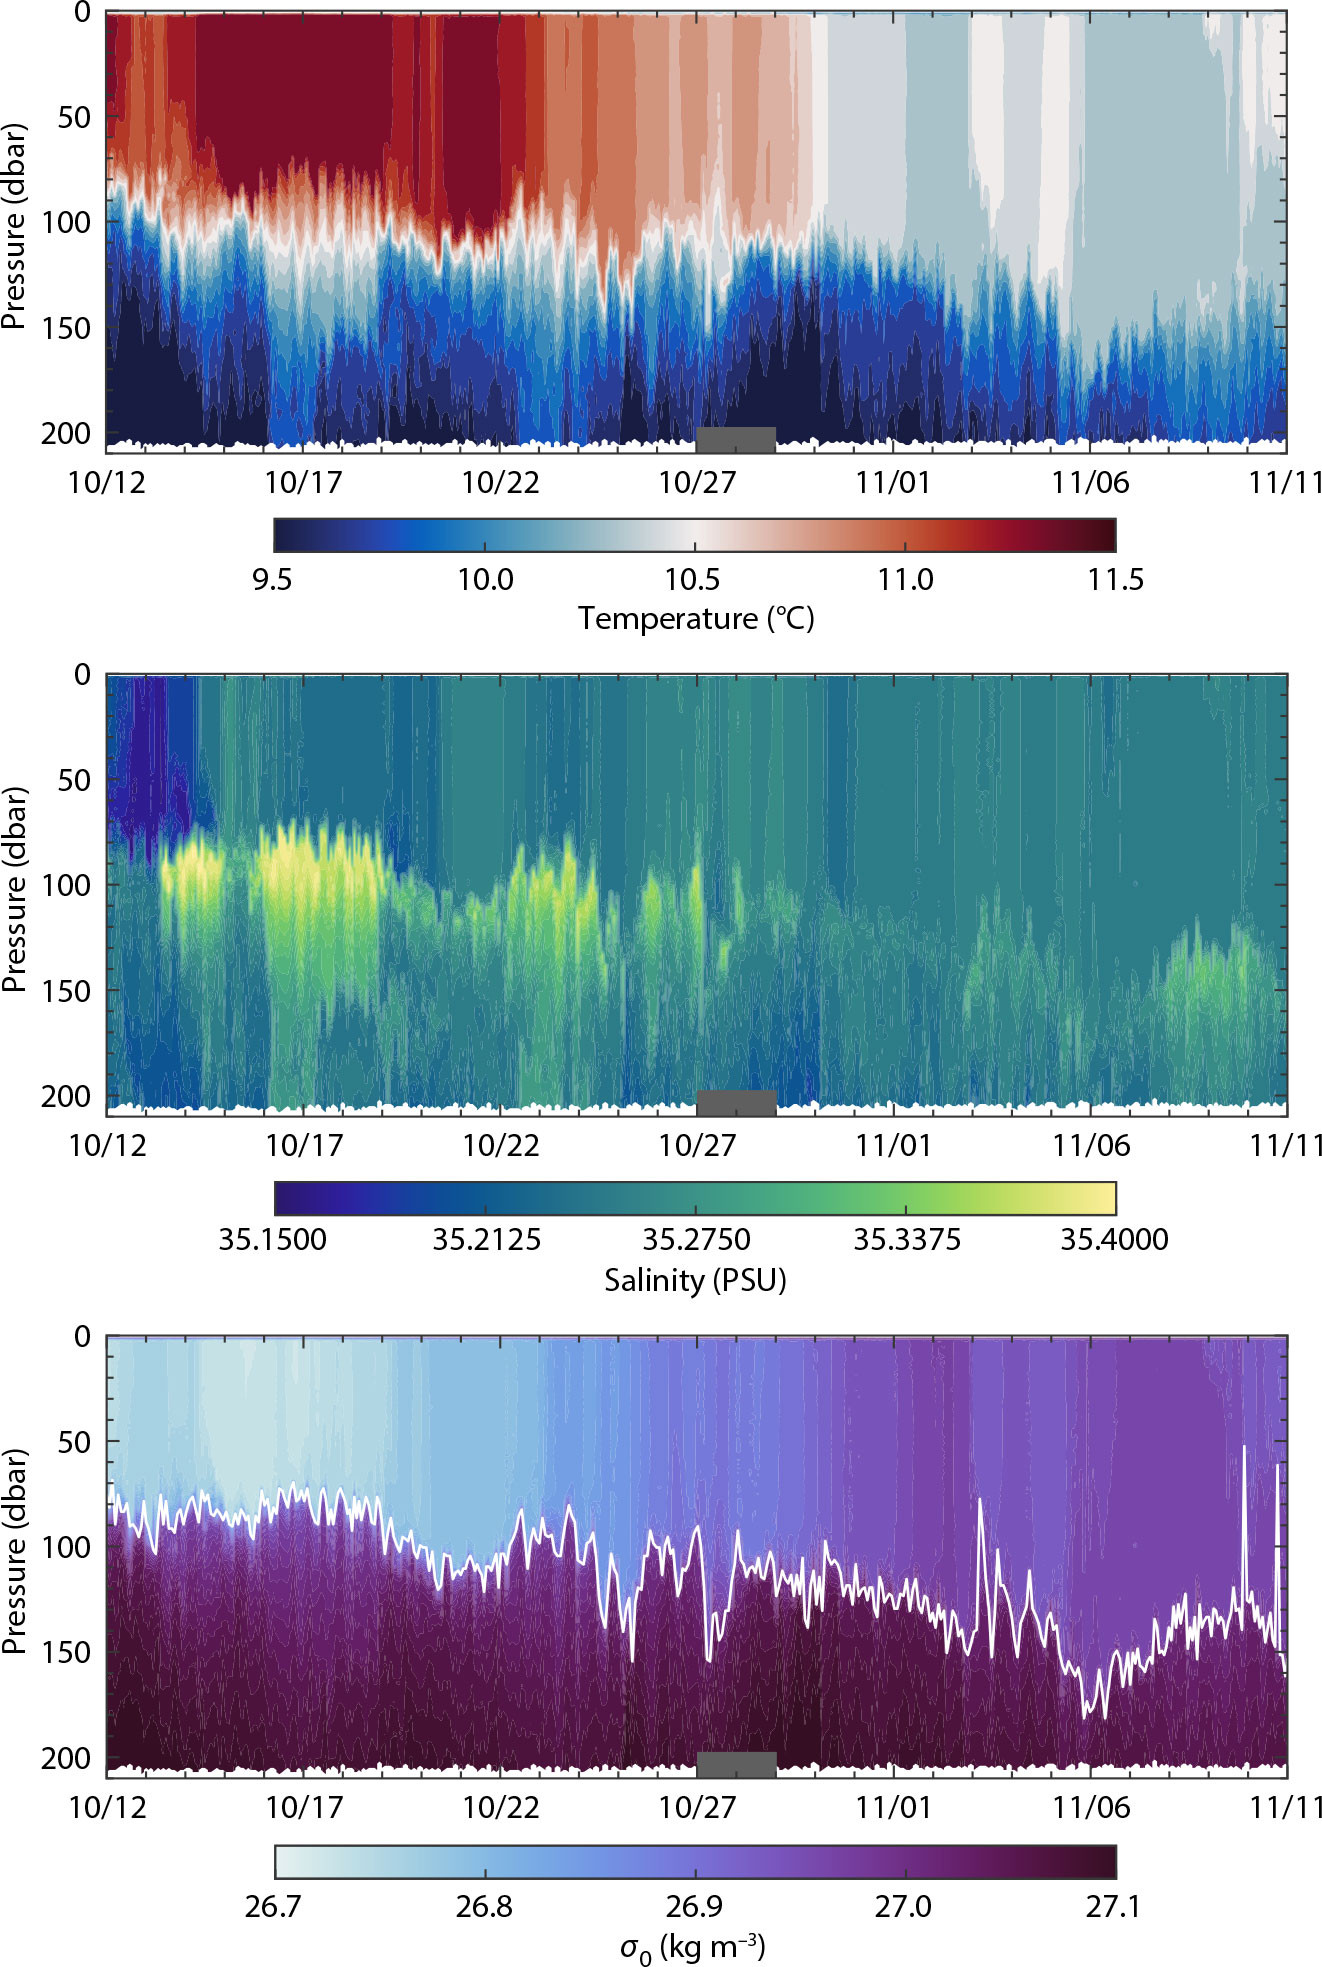
FIGURE 5. ALAMO #9105 temperature (top; °C), salinity (middle; PSU), and potential density (bottom; σ0 = ρ0 − 1000 kg m–3) records before, during (gray rectangle), and after the passage of ETC Epsilon. > High res figure
|
Currents and Near-Inertial Energy
Ocean current observations made by the Seaglider’s ADCP suggest that the passage of ETC Epsilon input significant momentum to the upper ocean (Figure S12). Using the same band-pass filter technique as was used to extract the near-inertial wind stress (Liu and Miller, 1996), the near-inertial current magnitude was extracted from the total ocean velocity (Figure 6). By October 25, Seaglider #234 detailed near-inertial current magnitudes greater than 0.15 m s–1 as deep as 60 dbar. The strongest total and near-inertial current magnitudes were observed during and after the passage of ETC Epsilon. By October 28, the near-inertial signal peaked, measuring greater than 0.20 m s–1 down to 90 dbar until October 31. The passage of ETC Epsilon coincided with a significant increase in near-inertial energy in the upper ocean (Figure 6), illuminating its surface forcing as the energy source deduced from the near-inertial wind stress (Figure 3).
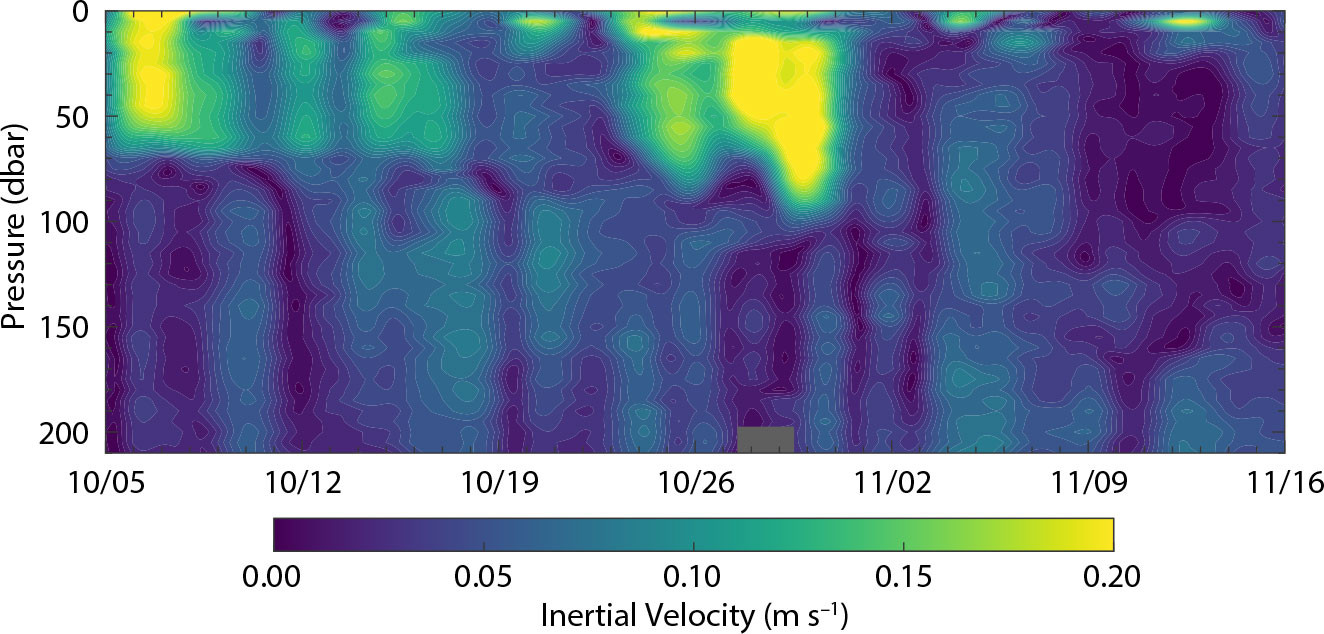
FIGURE 6. Near-inertial current magnitude (m s–1) as calculated from observations by the acoustic Doppler current profiler (ADCP) onboard Seaglider #234 before, during (gray rectangle), and after the passage of ETC Epsilon. > High res figure
|
During the passage of ETC Epsilon, the increase in upper-ocean currents resulted in an enhancement of the velocity shear in the near-surface and at the base of the mixed layer (Figure 7). While the presence of strong velocity shear is necessary to sustain shear-driven mixing, it is not a sufficient condition to induce it. The local stratification must be overcome in order for the environment to be susceptible to mixing. Thus, evidence for shear-driven mixing can be examined by using reduced shear (Figure S13), defined as S2 − 4N2, where S is the velocity shear (Figure 7), and N is the Brunt-Väisälä frequency (Figure S13). This parameter is a means of assessing the stability regime across the upper ocean: unstable, stable, or neutral. Regions of the water column characterized by the unstable regime are the most susceptible to shear-driven mixing. In such regions, shear-driven mixing can overcome the existing stratification and vertically mix water parcels. The passage of ETC Epsilon coincided with intensified signatures of unstable regions, especially at the base of the mixed layer (Figure 7). After storm passage, the mixed layer depth was 50 m to 60 m deeper than it was in the pre-storm environment (Figures 5, 7, S11, and S12), indicating that Epsilon-induced surface forcing was at least partially responsible for mixing the upper ocean. Further analyses can be found in Zimmerman (2023).
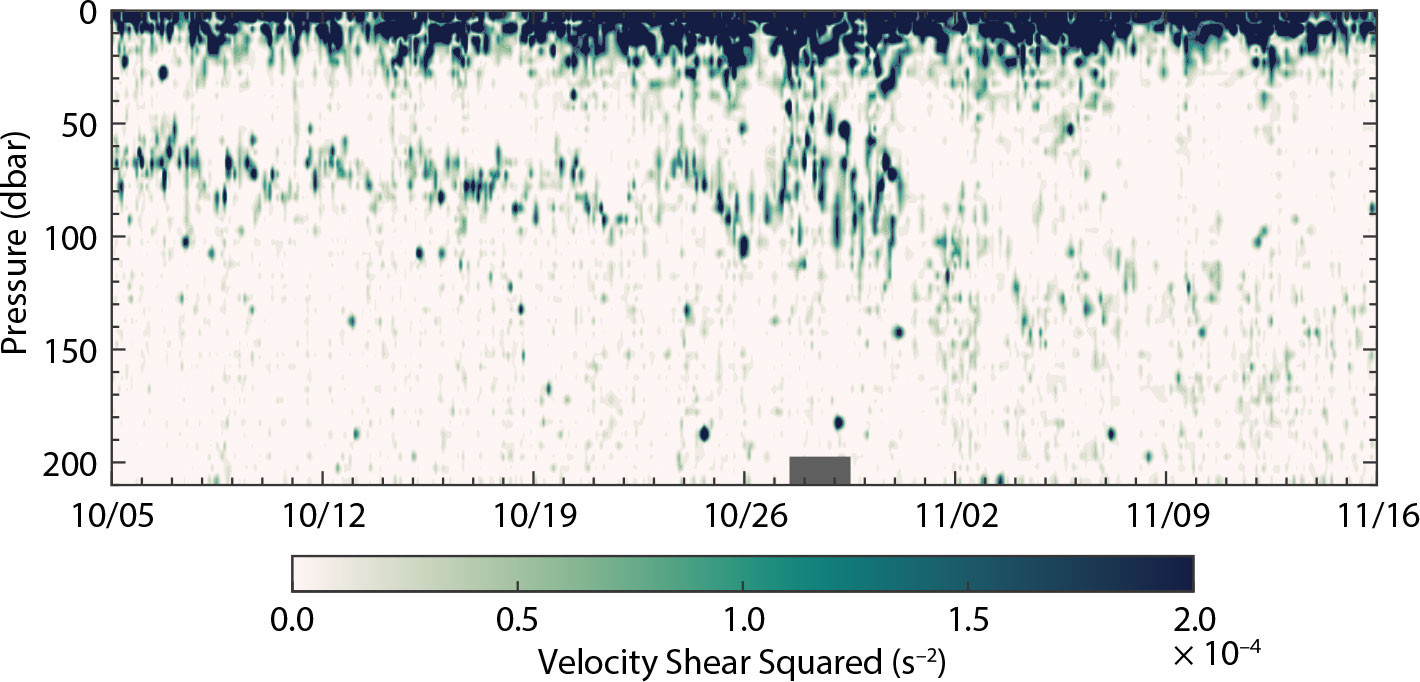
FIGURE 7. Velocity shear squared (s–2) as calculated from observations by the ADCP onboard Seaglider #234 before, during (gray rectangle), and after the passage of the remnants of ETC Epsilon. > High res figure
|
Summary
As a part of the NISKINe field program, we explored air-sea interaction in the subpolar North Atlantic during the passage of ETC Epsilon using three types of autonomous instruments: an X-Spar buoy, an ALAMO profiling float, and two Seagliders. While the passage of ETC Epsilon was unplanned, the utility and unique capabilities of each platform facilitated a multi-pronged approach to investigating upper-ocean evolution in response to the passage of a strong forcing event. It is apparent the near-inertial energy that ETC Epsilon injected into the ocean played a role in breaking down the remaining local summer surface stratification in the region. The wind stress from ETC Epsilon excited near-inertial upper-ocean currents whose shear then drove mixing at the base of the mixed layer, deepening it while cooling it through the entrainment of colder subsurface water. Thus, ETC Epsilon precipitated the shift to the winter stratification regime by causing significant ocean cooling and mixing in the surface layer.
The observations of each asset are complementary. They provide a robust in situ data set to improve forecast models and highlight the capability of this observational array as a force multiplier for the storm prediction communities. The synergistic observational opportunity that these platforms provide can facilitate a better understanding of how strong forcing events affect upper-ocean structure and contribute to the life cycle of near-inertial energy in the upper ocean. Similar observational arrays should be purposely leveraged in future studies, specifically in relation to the ocean’s role and response to TCs and ETCs and to improving their forecasts.
Acknowledgments
The authors are deeply appreciative of Gunnar Voet of Scripps Oceanographic Institution and of the crew of R/V Armstrong for the 2020 NISKINe deployment cruise. Tom Lanagan of Woods Hole Oceanographic Institution must also be gratefully acknowledged for his efforts during the cruise and also for leading the new design of X-Spar. We also owe many thanks to Angel Ruiz-Angulo of the University of Iceland; Héðinn Valdimarsson, Andreas Macrander, and Jacek Sliwinski of the Marine Freshwater Research Institute; and the Icelandic Coast Guard for recovering instruments and facilitating logistics during field operations. This work was supported by the Office of Naval Research under grant numbers N00014-18-1-2813, N00014-20-1-2765, and N00014-18-1-2780.