INTRODUCTION
Aquaculture is defined as the cultivation or farming of aquatic organisms encompassing finfish, shellfish, crustaceans, invertebrates, aquatic plants, and algae (Naylor et al., 2021). While aquaculture is primarily focused on the production of food for human consumption, it also includes pharmaceutical, cosmeceutical, and nutraceutical applications, as well as the production of ornamental aquatic species, species used as bait by recreational fisheries, biofuel production, and conservation/restoration efforts focused on populations of wild organisms (Leal et al., 2018). Depending on the needs of the aquatic species being produced, aquaculture is conducted in fresh, brackish, and salt water environments using various culture systems and methods.
The long history of aquaculture began with the growing of various species of carp (Family Cyprinidae) in Chinese freshwater ponds before 1500 BCE. Around 500 BCE, the ancient Romans developed initial methods for cultivating the European flat oyster (Ostrea edulis) in Mediterranean coastal environments, and during the Middle Ages, a variety of finfish and shellfish species were cultured in Europe (Stickney and Treece, 2012). However, despite its antiquity, aquaculture did not become an appreciable factor in global food production until the twentieth century (Stickney, 2000).
Since the 1950s, aquaculture production has expanded greatly and is now a major enterprise in several areas of the globe (Figure 1). Indeed, aquaculture currently represents the fastest growing food production sector in the world (Bartley, 2022; FAO, 2022). Its increase is due to factors that include expansion in global trade, reduction in capture fisheries, competitive product pricing, rising incomes, and urbanization, all of which have contributed to greater per capita consumption of seafood worldwide (Naylor et al., 2021; Boyd et al., 2022). In 2020, aquaculture accounted for approximately 122 million metric tons (MT), or 57% of the total weight of global aquatic species production (including capture fisheries; FAO, 2022).
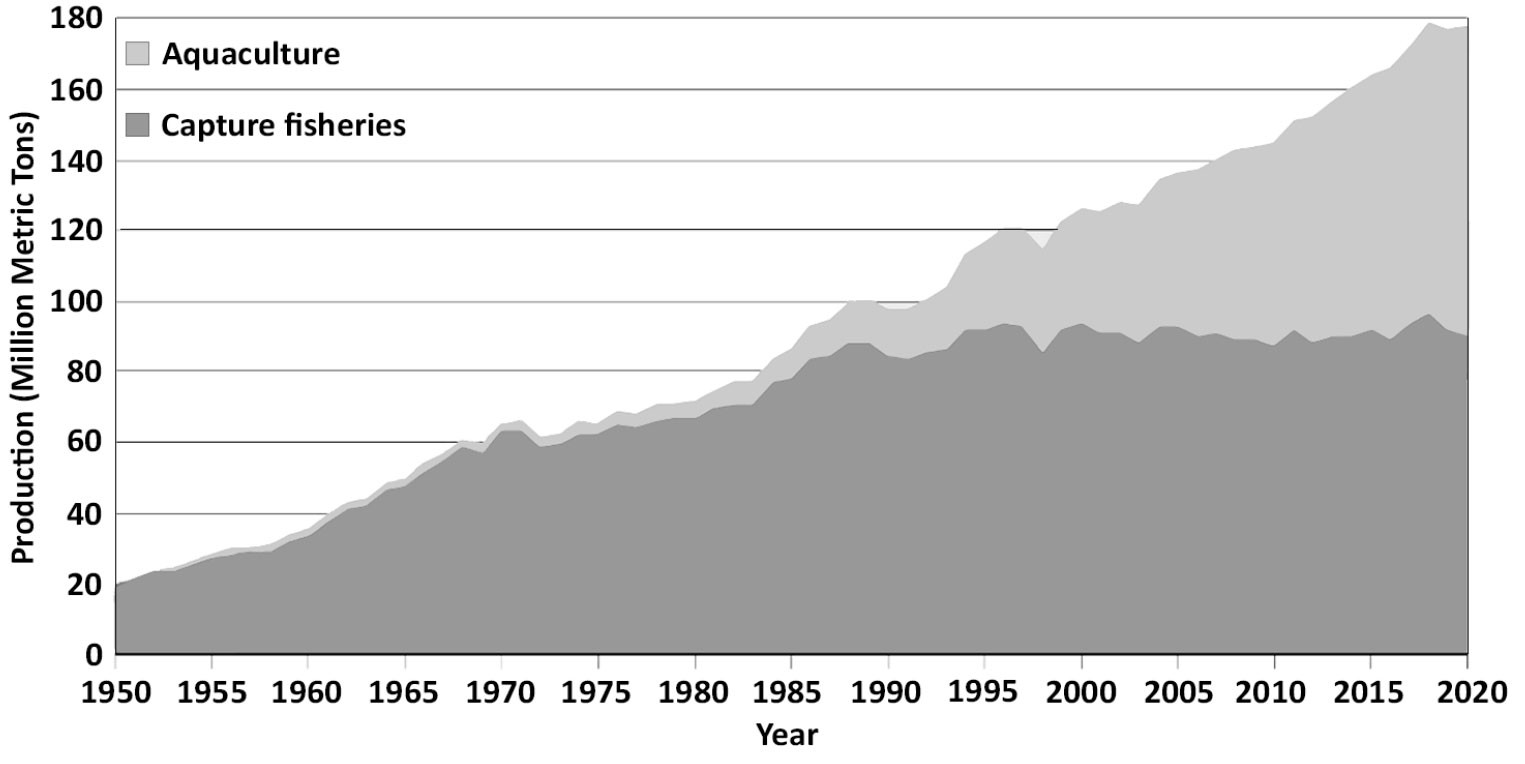
FIGURE 1. Global production of capture fisheries and of aquaculture (in million metric tons) from 1950 to 2020. Sources: Boyd et al. (2022) and FAO (2022). > High res figure
|
Currently, Asia dominates global aquaculture production, particularly China and countries in Southeast Asia. In contrast, in the United States, aquaculture is in its relative infancy, ranking 18th globally with respect to output (NMFS, 2022a). It is important to note that the United States currently imports 70%–85% of its seafood, and the nation’s seafood trade deficit was $17 billion in 2020, representing one of the country’s largest commodity trade deficits (NMFS, 2022b). It is estimated that more than half of this imported seafood is produced via foreign aquaculture (NMFS, 2022a).
Despite currently being a minor contributor to global aquaculture production, in recent years the US aquaculture industry has been the nation’s fastest growing agriculture sector, and there is a convincing case for continuing to increase aquaculture production domestically. In addition to reducing dependence on foreign aquaculture, increasing domestic aquaculture can help improve food security and food production, enhance human nutrition, boost economic growth in coastal and rural areas, and can, in some cases, provide ecosystem services (NMFS, 2020).
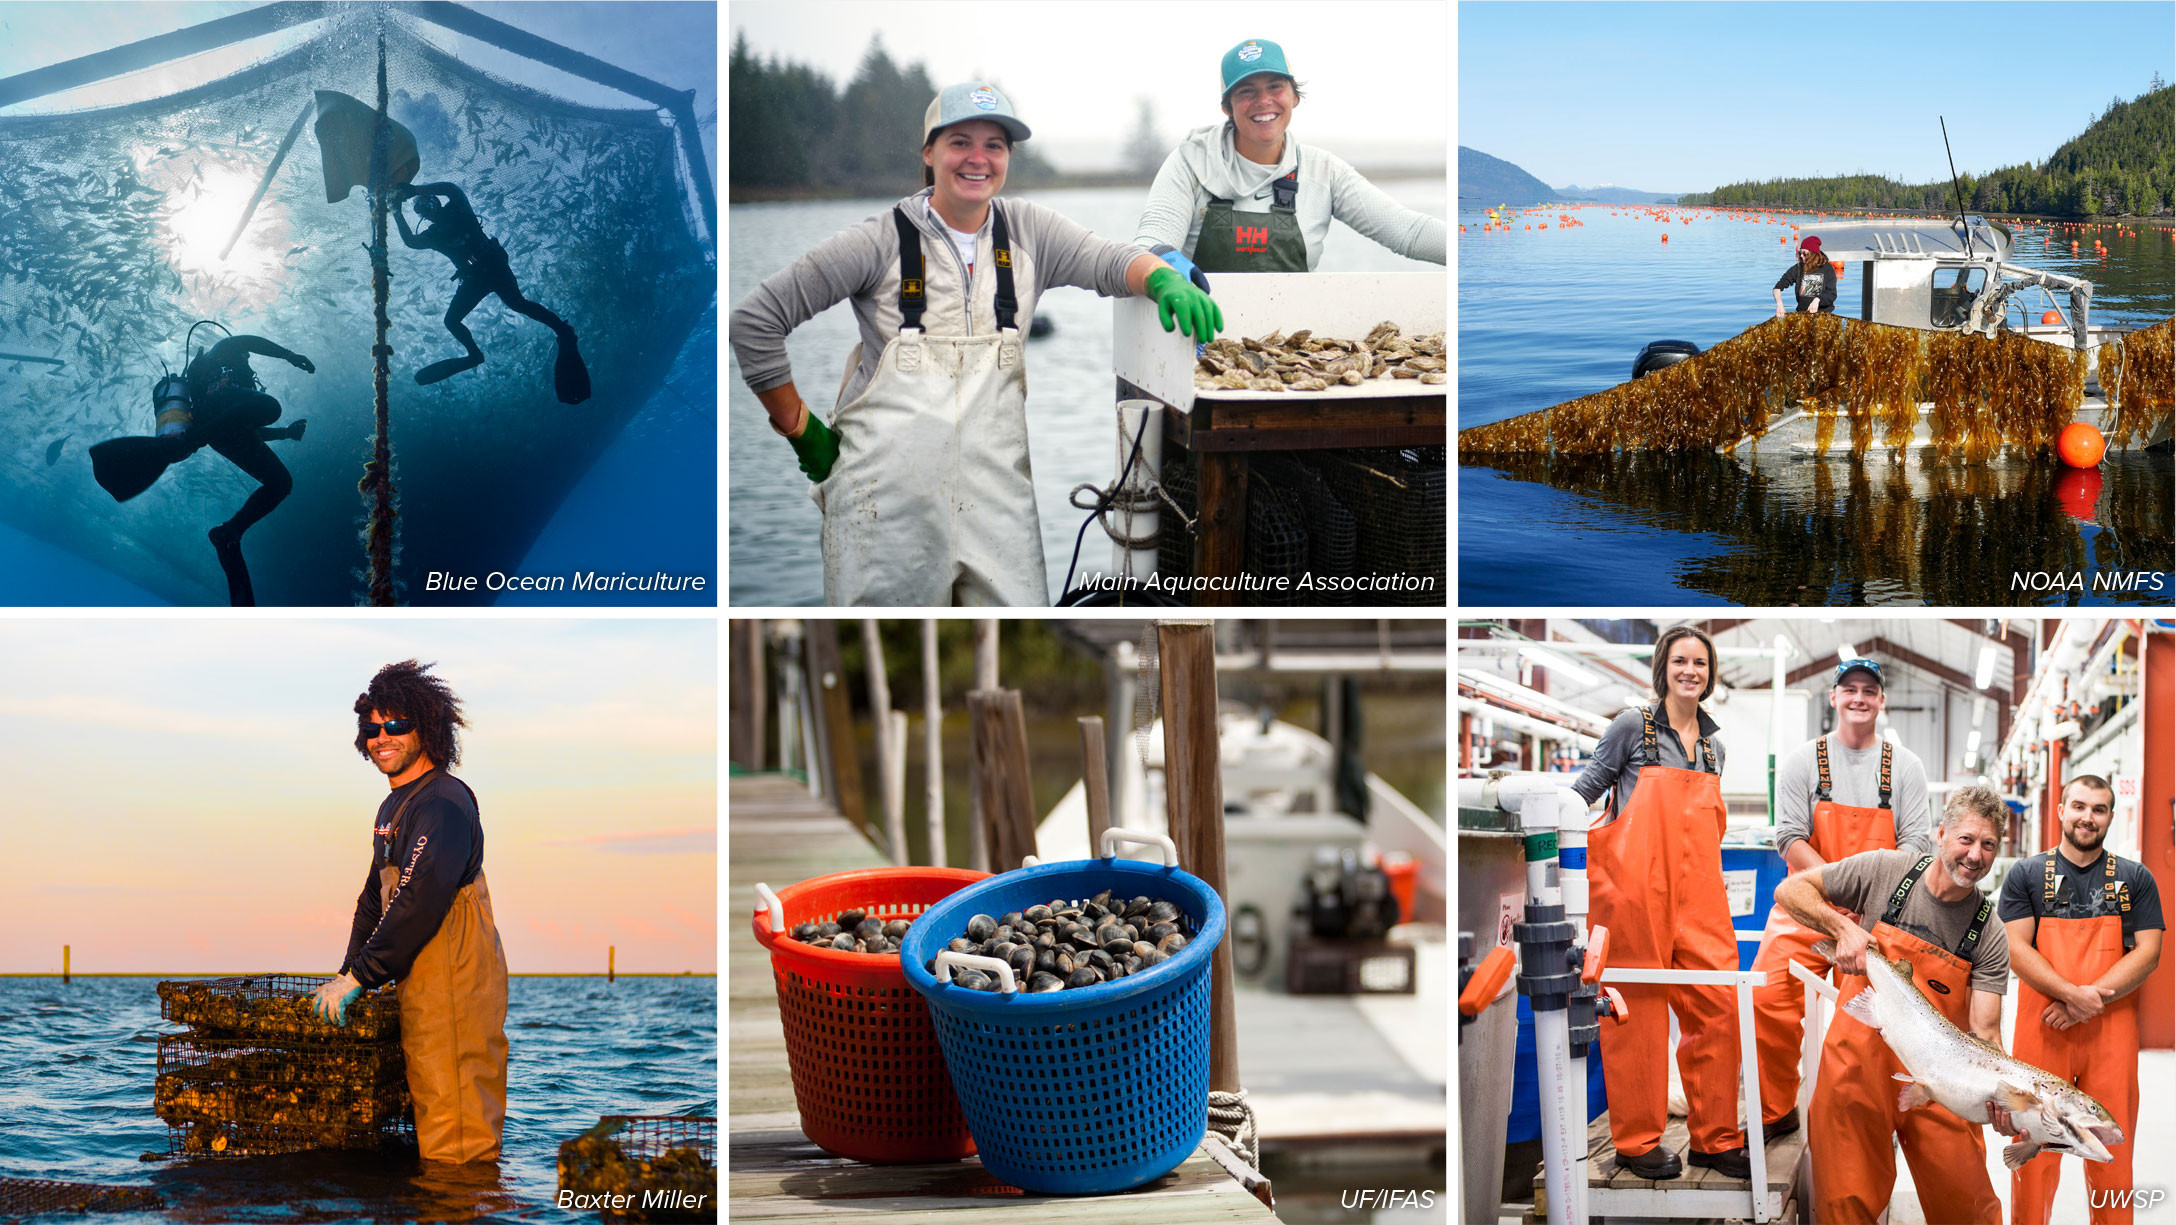
To date, the bulk of US aquaculture production has focused on freshwater species such as channel catfish (Ictalurus punctatus), rainbow trout (Oncorhynchus mykiss), and red swamp crawfish (Procambarus clarkii), with lesser production of coastal and marine aquatic species. In 2019, total US aquaculture production was approximately 298,000 MT with a farm gate value (FGV: market value of product minus selling costs such as transport and marketing costs) of $1.5 billion. Of that total, freshwater aquaculture accounted for approximately 257,000 MT of production with an FGV of $694 million, and coastal and marine aquaculture accounted for approximately 41,000 MT with an FGV of $430 million (NMFS, 2022b). Although coastal and marine aquaculture has lagged behind freshwater aquaculture, the former has the potential to contribute greatly to future domestic production. US coastal and marine aquaculture has long centered on the production of molluscan shellfish species such as Eastern and Pacific oysters (Crassostrea virginica and Magallana gigas, respectively) and hard clams (Mercenaria mercenaria). However, in recent decades, coastal and marine aquaculture production has expanded in the United States to include species such as Atlantic salmon (Salmo salar), various marine finfish species, and macroalgae or seaweeds (see article title page photos).
HISTORY OF SEA GRANT AQUACULTURE SUPPORT
As a boundary organization operating at the interface of science and policy, Sea Grant has a long history of supporting coastal, marine, and Great Lakes aquaculture development, working in collaboration with other NOAA line offices, notably the National Marine Fisheries Service (NMFS) and the National Ocean Service (NOS), as well as with other federal agencies, particularly the US Department of Agriculture (USDA) Agricultural Research Service (USDA-ARS) and the USDA National Institute of Food and Agriculture (USDA-NIFA). Having long employed extension personnel with joint appointments, in recent years, Sea Grant and USDA have increased collaborative efforts to fund research directed toward cultivation of species such as Eastern oysters and Atlantic salmon.
Sea Grant funds coastal, marine, and Great Lakes aquaculture at individual program and national levels, and also supports education, engagement, and technology transfer programs in collaboration with aquaculture industry members and others in the aquaculture community. The majority of these Sea Grant programs include one or more aquaculture extension professionals who provide trusted local connections to the aquaculture industry and its related communities as they work and live in those same communities.
To summarize Sea Grant’s history of supporting coastal and marine aquaculture, an expert panel was convened in 2019 to synthesize Sea Grant’s historical aquaculture research, extension, and education investments and create phylogenies for selected topics (Swann, 2019). A phylogeny is a representation of the evolutionary history and relationships between groups. In the context of Sea Grant, aquaculture phylogenies represent the relationship between a species or production system and how pioneering research, education, or engagement evolve as new discoveries or industry needs are identified. The panel reviewed state programs’ annual reporting information with a focus on accomplishments and impacts submitted to the NSGO through 2018. The information provided to the panel was used in multiple ways, including identifying areas in which Sea Grant made significant and measurable contributions to the programmatic areas of research, education, engagement, and technology transfer. The panel assisted in the development of program phylogenies to demonstrate Sea Grant’s strategic approach to addressing issues of concern for the aquaculture industry.
Development of the phylogenies began with an analysis of Sea Grant’s accomplishments and impacts obtained from annual reporting data. This resulted in identification of 78 aquaculture topics addressed over the years, encompassing a total of 3,459 accomplishments and impacts. It is important to note that the majority of accomplishments and impacts occurred after the year 2000, when Sea Grant began requiring the entry of more detail into the NSGO annual reporting database. The 78 most commonly identified topics were distilled into 17 phylogenies focused on species or production systems, encompassing 1,458 accomplishments and impacts (Figure 2).
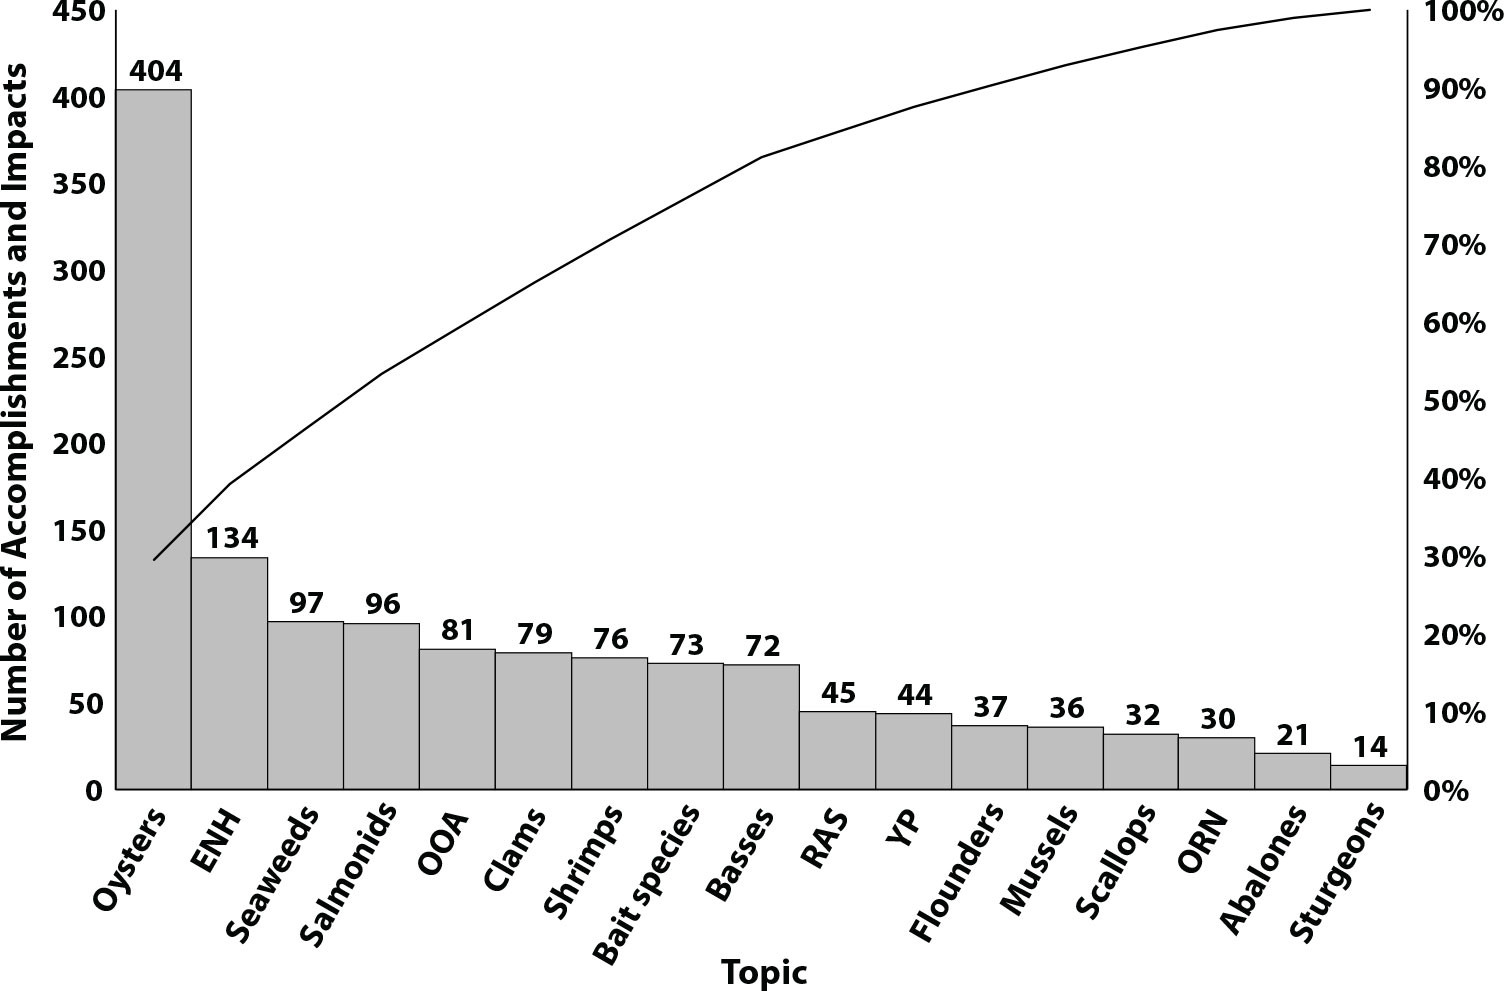
FIGURE 2. The 17 aquaculture phylogenies discussed in the text focused on species or production systems identified by a 2019 expert panel. They were developed from 78 topics identified via annual reporting data obtained through 2018. The 17 phylogenies contained 1,458 accomplishments and impacts, which are shown in the order of frequency of mention. The primary y-axis shows the total number of accomplishments and impacts associated with each phylogeny. The secondary y-axis indicates percentages of the totals, associated with the curved line. Approximately 80% of the accomplishments and impacts are contained in the first 9 phylogenies. ENH = Enhancement of species. OOA = Open ocean aquaculture. RAS = Recirculating aquaculture systems. YP = Yellow perch. ORN = Ornamentals species. > High res figure
|
The phylogenies developed were: oysters, including Eastern, Pacific, and Olympia (Ostrea lurida) oysters; enhancement or restoration of various freshwater and marine aquatic species; seaweeds, including brown algae species, such as various kelps, and red algae species, such as dulse, gracilaria, and porphyra; salmonids, including Atlantic, Chinook (Oncorhynchus tshawytscha), and coho (O. kisutch) salmon; open ocean aquaculture (OOA); clams, including geoducks (Panopea generosa), Manila (Venerupis philippinarum), sunray venus (Macrocallista nimbosa), giant (Tridacna gigas), Atlantic surf (Spisula solidissima), soft-shell (Mya arenaria), and hard clams; shrimps, primarily Pacific white shrimp (Litopenaeus vannamei); bait species, including various freshwater and marine finfish species and marine shrimp species; basses, including striped bass (Morone saxatilis) and hybrid striped bass (M. chrysops X M. saxatilis), largemouth bass (Micropterus salmoides), white sea bass (Atractoscion nobilis), and black sea bass (Centropristis striata); recirculating aquaculture systems (RAS); yellow perch (Perca flavescens); flounders, including summer (Paralichthys dentatus), southern (P. lethostigma), and winter (Pseudopleuronectes americanus) flounder; mussels, primarily blue mussels (Mytilus edulis); scallops, including bay (Argopecten irradians), Atlantic sea (Placopecten magellanicus), purple-hinged rock (Crassodoma gigantea), and lion’s paw (Nodipecten nodosus) scallops; ornamentals (ORN), including various marine ornamental aquatic species; abalones, including white (Haliotis sorenseni), black (H. cracherodii), red (H. rufescens), and pinto (H. kamtschatkana) abalone; and sturgeons, including green (Acipenser medirostris), white (A. transmontanus), lake (A. fulvescens), and Russian (A. gueldenstaedtii) sturgeon.
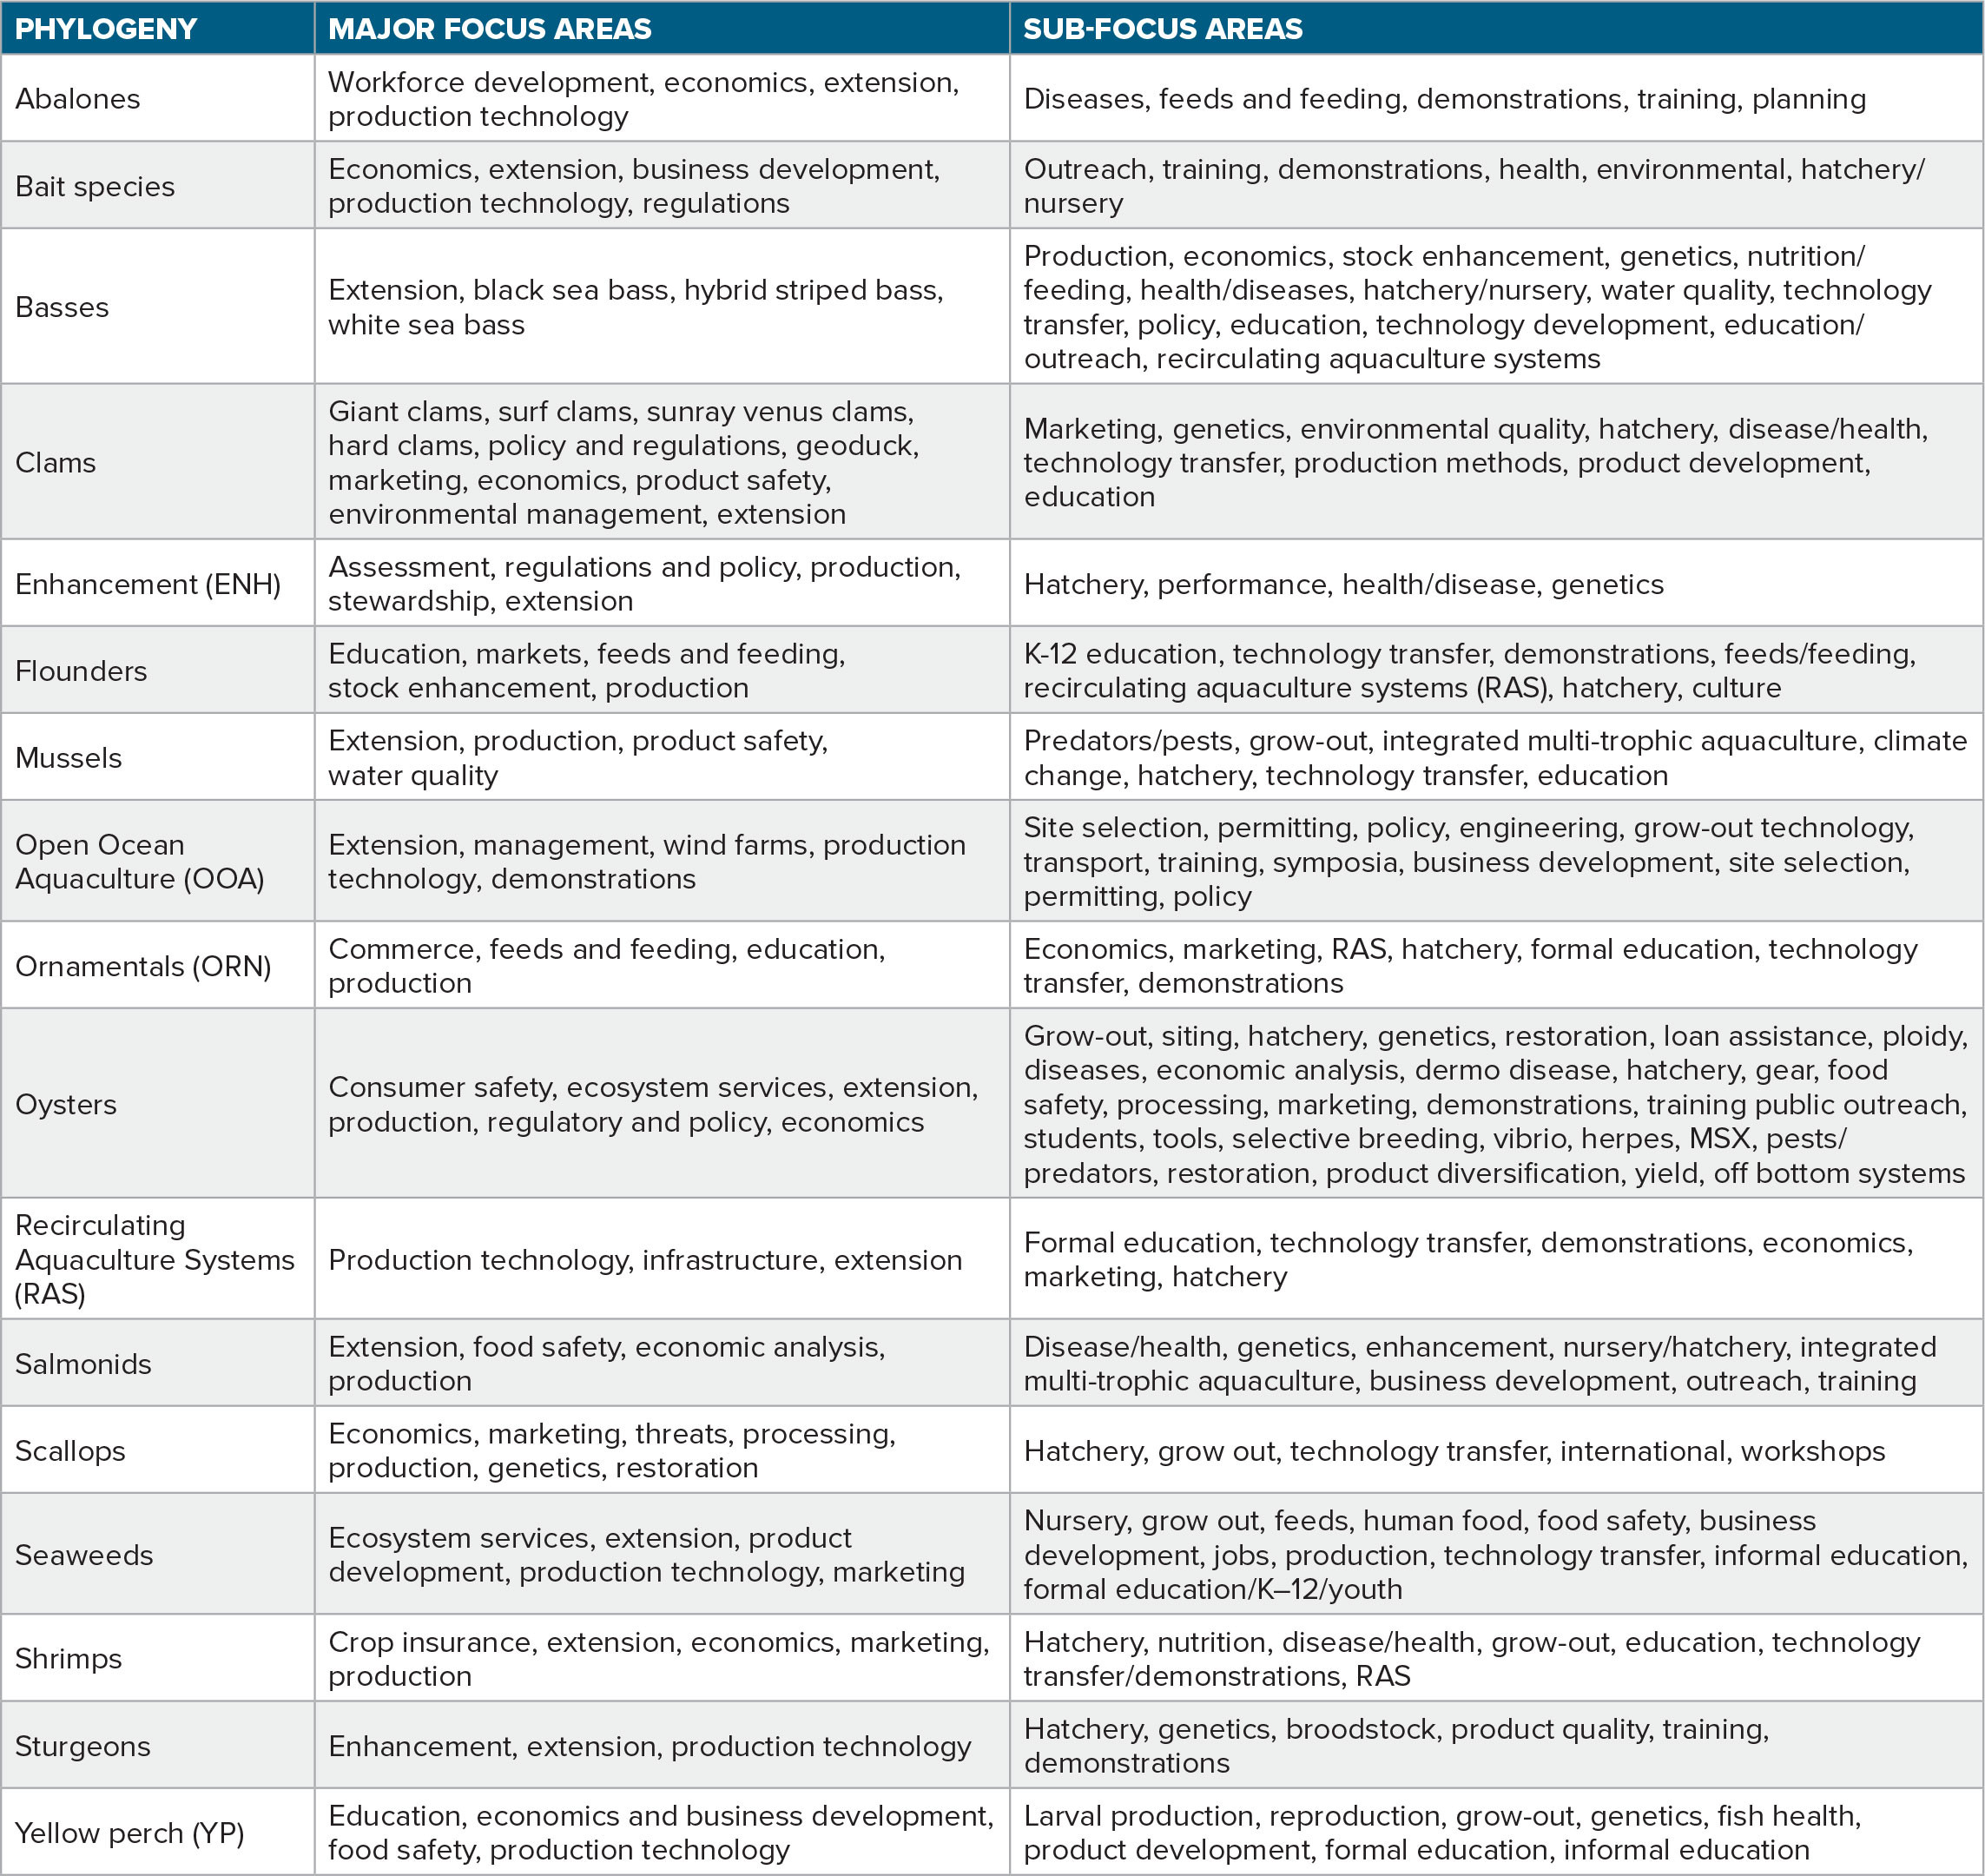
Table 1 lists major focus areas and sub-focus areas for each of the 17 phylogenies. As an example of major and sub-focus areas, Figure 3 presents a spaghetti diagram of the phylogeny focused on Sea Grant’s support of yellow perch aquaculture through 2018.
TABLE 1. Major focus areas and sub-focus areas associated with each of the 17 aquaculture phylogenies, developed from a list of 78 topical areas identified during the analysis of aquaculture accomplishments and impacts submitted to the National Sea Grant Office by Sea Grant programs through 2018. > High res table
|
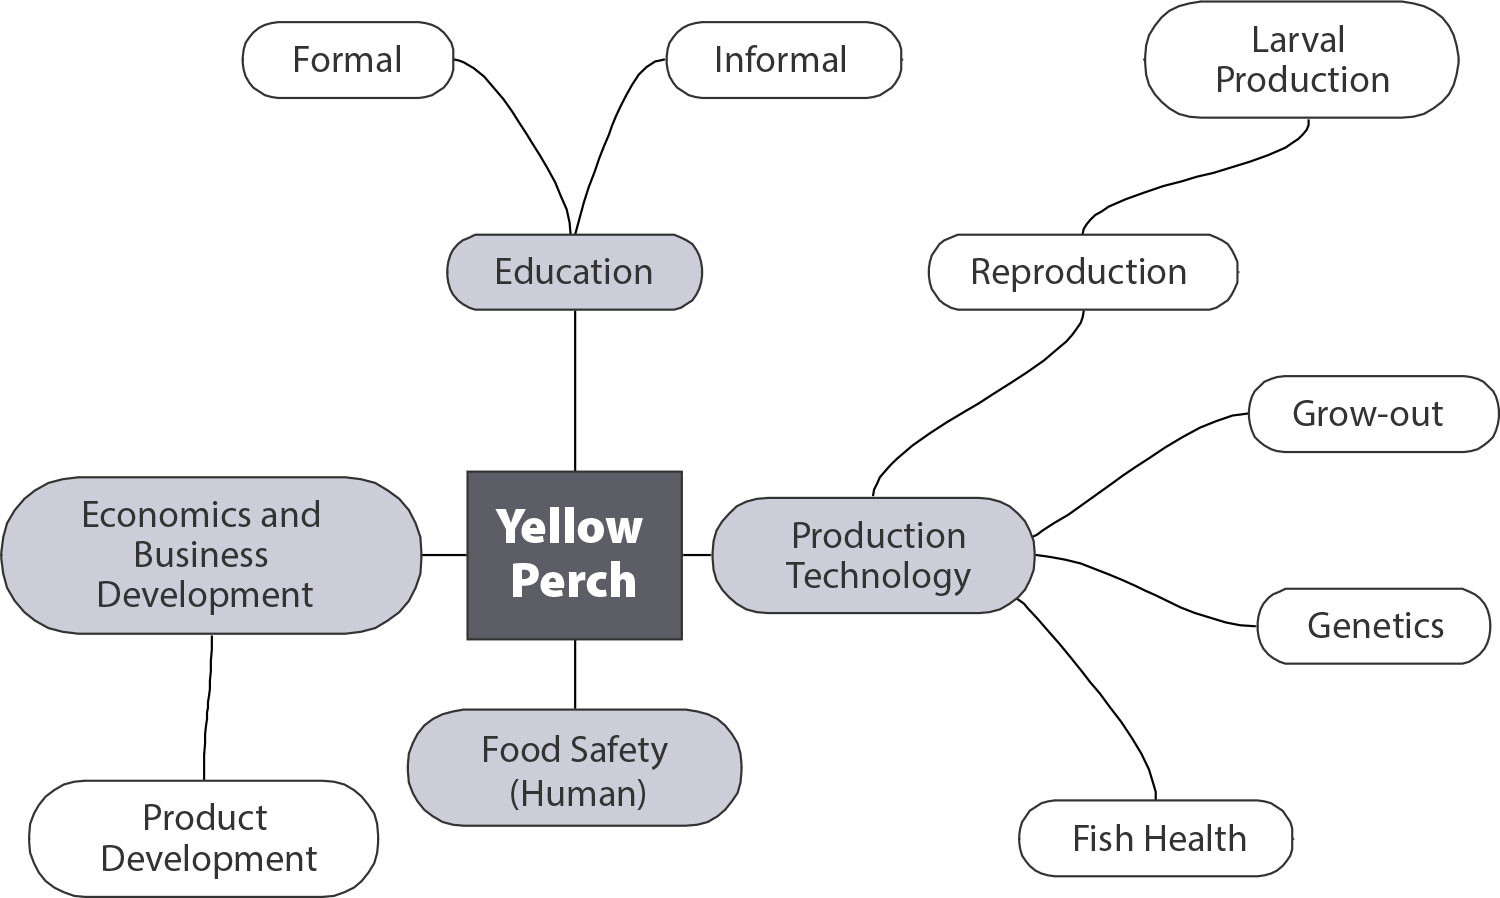
FIGURE 3. A spaghetti diagram shows major focus areas (denoted by gray backgrounds) and sub-focus areas (denoted by white backgrounds) of the yellow perch phylogeny created using 44 annual reporting accomplishments and impacts submitted by Sea Grant programs through 2018. > High res figure
|
Results from the expert panel provided fundamental information Sea Grant needed to establish a benchmark to better understand topics in which Sea Grant has made significant investments in aquaculture. These data, coupled with the amount of funding invested per topic, will aid in future determination of Sea Grant’s return on investment (ROI) per topic. Future work can also lead to case studies and planning documents, highlighting the role of Sea Grant, the aquaculture industry, and other NOAA programs and agencies in the commercialization of new species, production systems, and other technologies.
SEA GRANT'S AQUACULTURE INVESTMENT PORTFOLIO
Sea Grant has been funding aquaculture for over 55 years (through Sea Grant federal appropriations). Beginning in fiscal year (FY) 2010, the additional funding specifically for Sea Grant aquaculture activities was moved from OAR to the National Sea Grant College Program within OAR in the federal budget. Since that time, the separate National Sea Grant aquaculture funding line has increased 292%, along with increased support through the National Sea Grant College Program legislatively mandated requirement for a 50% match from funding applicants. Both the National Sea Grant aquaculture funding line and the National Sea Grant College Program funding line have been utilized to address national, regional, and state aquaculture priorities (Figure 4).
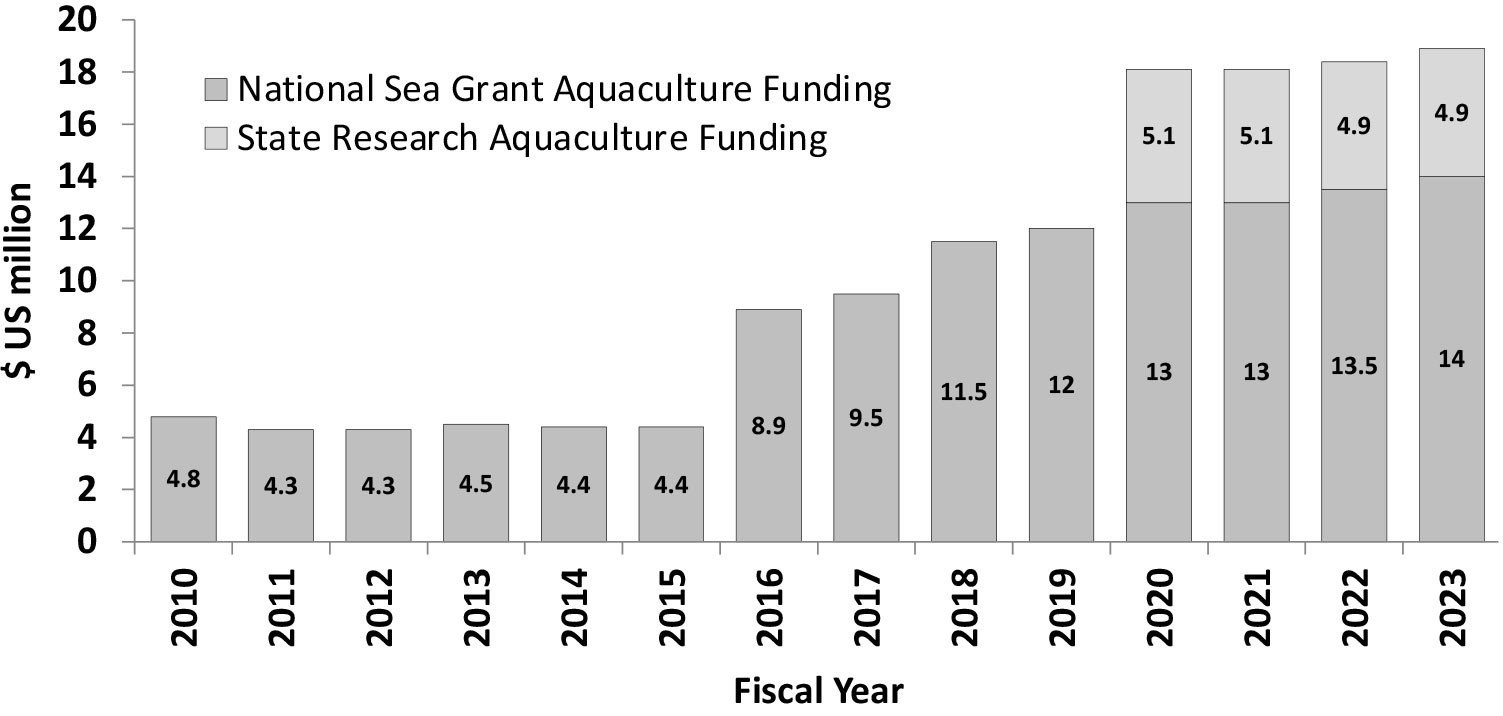
FIGURE 4. National Sea Grant aquaculture funding between fiscal year (FY) 2010 and FY 2023 ($US million). Data for state research aquaculture funding are part of the National Sea Grant College Program funding and were not tracked separately prior to FY 2020. > High res figure
|
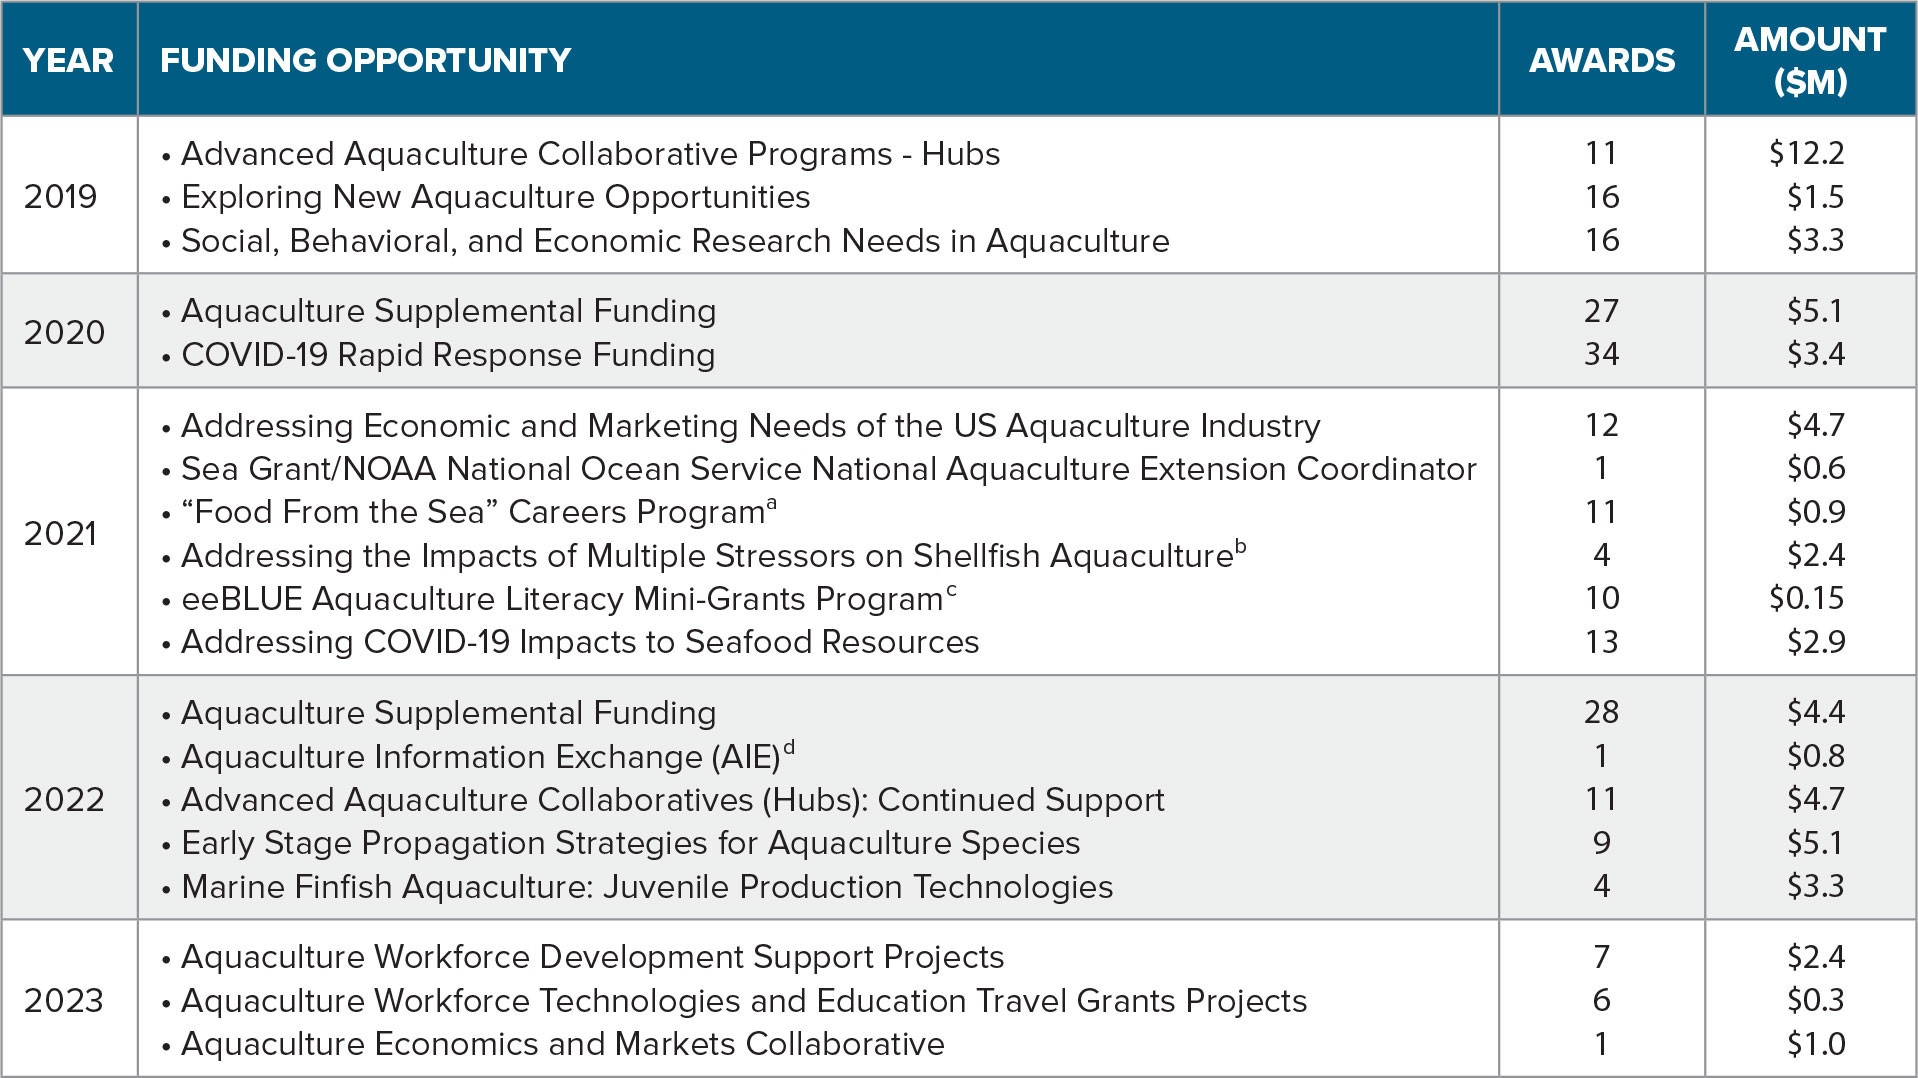
With this funding increase, Sea Grant has been able to significantly expand its investment portfolio supporting coastal, marine, and Great Lakes aquaculture. For example, since 2019 a number of aquaculture funding investments, some jointly funded in collaboration with other federal partners, have addressed a broad range of topics, including production biology and production systems, education, aquaculture economics and markets, aquaculture outreach and communications, technology transfer, and workforce development. Funding has also targeted a variety of aquaculture species including macroalgae, shellfish, crustaceans, and marine and freshwater finfish (Table 2).
TABLE 2. National Sea Grant College Program aquaculture funding investments, 2019–2023, resulting in 222 awards granted with a total investment of approximately $59.1 M. Superscript letters refer to investments jointly funded with: aNOAA Office of Sustainable Fisheries; bNOAA Ocean Acidification Program; cNorth American Association for Environmental Education, NOAA Office of Education, and National Marine Fisheries Service; dNational Marine Fisheries Service, US Department of Agriculture Agricultural Research Service, and US Department of Agriculture National Institute of Food and Agriculture. Because most awards span more than one year, the total amounts listed here will not equal values shown in Figure 4 for a specific year. > High res table
|
Development of funding opportunities is accomplished using a combination of resources, including input from partners and constituents around the country through the individual Sea Grant programs’ strategic planning processes that feed into the National Sea Grant College Program strategic plan; Department of Commerce, NOAA, and the NOAA Aquaculture Program Strategic Plans; and congressional language. Funding opportunities can either be competitive or noncompetitive, and open to Sea Grant programs partnering with individuals, state and tribal agencies and organizations, minority serving institutions, nongovernmental organizations, aquaculture industry members and associations, universities, colleges, and/or other Sea Grant programs, or open to entities without the involvement or participation of a Sea Grant program. Innovation and nimbleness in selecting topics, utilizing funding sources, and conceiving of new mechanisms of support allows Sea Grant to build successful aquaculture research and extension programs that can become self-sustaining.
One example of a successful funding method was a competition held in FY 2019 to establish Advanced Aquaculture Collaborative Programs, commonly referred to as “aquaculture hubs.” The following eleven hubs were created to focus on accelerating the development of specific aquaculture topics through integrated teams of professionals.
- Advancing Southern New England Shellfish Aquaculture
- Atlantic and Gulf Shellfish Seed Biosecurity Collaborative
- East Coast Hard Clam Selective Breeding Collaborative
- Great Lakes Aquaculture Collaborative
- Hawai’i-Pacific Aquaculture Consortium
- Indigenous Aquaculture Cross-Pacific Regional Collaborative Hub
- Maine Aquaculture Hub
- National Seaweed Hub
- Recirculating Aquaculture Salmon Network
- StriperHub: Advancing Commercial Striped Bass Aquaculture
- West Coast Aquaculture Collaborative
Since these hubs were initiated, several have secured funding from other sources in order to sustain collaborations designed to improve domestic aquaculture. Given the success of this model, Sea Grant plans to continue to offer funding opportunities for the creation of hubs that focus on various topics. For example, in FY 2023, an Aquaculture Economics and Markets Collaborative was established, and in FY 2024, there are plans for the establishment of Regional Aquaculture Communications/Literacy Collaboratives.
In addition to establishing aquaculture hubs, Sea Grant further expanded use of funding mechanisms in FY 2020 by initiating aquaculture supplemental funding to address local and state needs that cannot be addressed at the national level. This supplemental funding is correlated to aquaculture-related projects selected in each individual Sea Grant program’s biennial competitive research competition. It may be used by programs to fund a variety of activities, including capacity building and additional activities toward sustainable aquaculture practices such as social science work with surrounding local communities, economics and marketing, food safety and new products, and food security and health.
A unique aspect of Sea Grant’s aquaculture investment portfolio is that it is sufficiently nimble and flexible to respond to immediate and pressing issues. For example, in FY 2020, Sea Grant funded the 34 Sea Grant programs to support work to address short and long-term aquaculture community needs resulting from the COVID-19 pandemic. This rapid response funding allowed Sea Grant programs to immediately address needs of the industry resulting from the pandemic, including efforts toward using shellfish in restoration projects and development of direct marketing strategies for aquaculture products.
Sea Grant’s aquaculture investments continue to impact responsible aquaculture development in the United States in many ways. For example, from FY 2018 to FY 2022, the estimated average annual economic impact of Sea Grant’s investments in aquaculture was $69.6 M while creating or sustaining an estimated average of 1,147 aquaculture-related jobs and 572 businesses each year. In addition, during this same period, Sea Grant investments resulted in the publication of 328 peer reviewed aquaculture journal articles. Metrics that are more difficult to quantify include increased knowledge, understanding, and capacity translating to more informed decision making, safer production practices, and more efficient management efforts.
Pending federal appropriations, Sea Grant will continue to connect with local, state, regional, and national partners, including the aquaculture industry, to identify and invest in the most pressing needs for an economically, environmentally, and socially sustainable US aquaculture industry. Through consistent, reliable, and recurring funding opportunities, using a variety of funding mechanisms, Sea Grant will support efforts that include enhancing the production of aquaculture species as well as aquaculture economics and markets, improving product quality and processing, expanding aquaculture education and literacy, and bolstering aquaculture workforce development.
CONCLUSIONS
Sea Grant has a more than 55-year history of investing in research, education, and engagement activities to support the development of responsible and sustainable US coastal, marine, and Great Lakes aquaculture. Investments to date have focused on a wide variety of topics and aquaculture species and have helped in the development and expansion of aquaculture species such as Eastern and Pacific oysters, and development and refinement of technologies such as recirculating aquaculture systems. In recent years, with an increase in federal appropriations, Sea Grant has been able to enhance the scope of its aquaculture investments as well as broaden offerings to address various topical areas in continued support of research, education, and outreach activities to benefit the US aquaculture industry.
ACKNOWLEDGMENTS
The authors wish to thank Amara Davis, NSGO; Melissa Schneider, Mississippi Alabama Sea Grant Consortium; and Alexis Horn, National Marine Fisheries Service, for assistance in development of graphics. We also thank Jessica Dupree and Susan Holmes, NSGO, for providing data regarding impacts resulting from Sea Grant investments in aquaculture. In addition, thanks are extended to Rebecca Briggs and Alison Krepp, NSGO, for reviewing this manuscript.

