Full Text
The Ocean Molecular Ecology (OME) program at the NOAA Pacific Marine Environmental Laboratory (PMEL) is a recently established research group that partners with several PMEL and Alaska Fisheries Science Center (AFSC) programs including Ecosystems & Fisheries-Oceanography Coordinated Investigations (EcoFOCI), Ocean Carbon, and Earth-Ocean Interactions (EOI). The OME program utilizes a suite of molecular tools to support long-term research initiatives through genomics applications, and their development and application as novel environmental (e)DNA approaches has been key for facilitating collaborations within PMEL and NOAA Oceanic and Atmospheric Research, and across NOAA line offices.
|
|

Environmental DNA is the genetic material of multicellular and single-celled eukaryotes, Bacteria, and Archaea that can be extracted from an environmental sample without isolating a stand-alone species (Taberlet et al., 2012). Utilizing eDNA from water collected for other research (e.g., water chemistry, phytoplankton measurements) provides a complementary tool for characterizing ecosystem biodiversity down to species level for some taxa (Kelly et al., 2014) and for detecting endangered inconspicuous species (Jerde et al., 2011); in addition, it yields information regarding temporal variability and spatial distribution of target species (Sutter and Kinziger, 2019). Compared to traditional approaches (e.g., trawling, surveys), eDNA sampling can be both less costly and less environmentally damaging. When used in tandem with established monitoring methods, eDNA can provide data on community composition as well as biodiversity shifts over time through repeated sampling (Goldberg et al., 2015). Further, eDNA extracts can often be cataloged for future use to address additional, complementary questions, such as quantitative estimates of species abundance (Spear et al., 2020). The integration of eDNA into routine ecosystem monitoring has the potential to be transformative by providing managers with novel additional resources to address NOAA’s goal of predicting, conserving, and managing the impacts of a changing ocean on US marine resources.
At high latitudes, the impacts of climate change are among the most extreme in the world (Walsh, 2008). Climate change and other environmental impacts attributed to anthropogenic inputs include ocean warming, loss of seasonal sea ice cover, hypoxia, ocean acidification, and noise pollution. These cumulative stressors impact ecosystem dynamics and directly influence the distribution and diversity of key species at all trophic levels (Cheung et al., 2009). The Arctic Ocean and Bering Sea, known for their high productivity, are home to abundant and diverse populations of benthic invertebrates, seabirds, marine mammals, and commercially significant fish (Hood and Calder, 1981). PMEL has monitored the Bering, Chukchi, and Beaufort Seas for over 25 years (Tabisola et al., 2022). Mooring measurements and multidisciplinary sampling at a set of observatories have allowed scientists to detect and predict environmental changes in this region. Additional tools that can help to quantify a rapidly changing ecosystem, such as moored automated environmental samplers, would be welcome additions. Within the last decade, PMEL scientists have begun employing eDNA metabarcoding in the Arctic to expand on previous efforts that mainly employed remote sensing, fisheries surveys, and moorings (Leduc et al., 2019). In 2020, eDNA sampling was added to PMEL’s extensive Arctic sampling effort to complement ongoing work (Stabeno et al., 2023, in this issue) and to provide further information on species distribution and abundance.
Biodiversity Standards for the Arctic Observatories
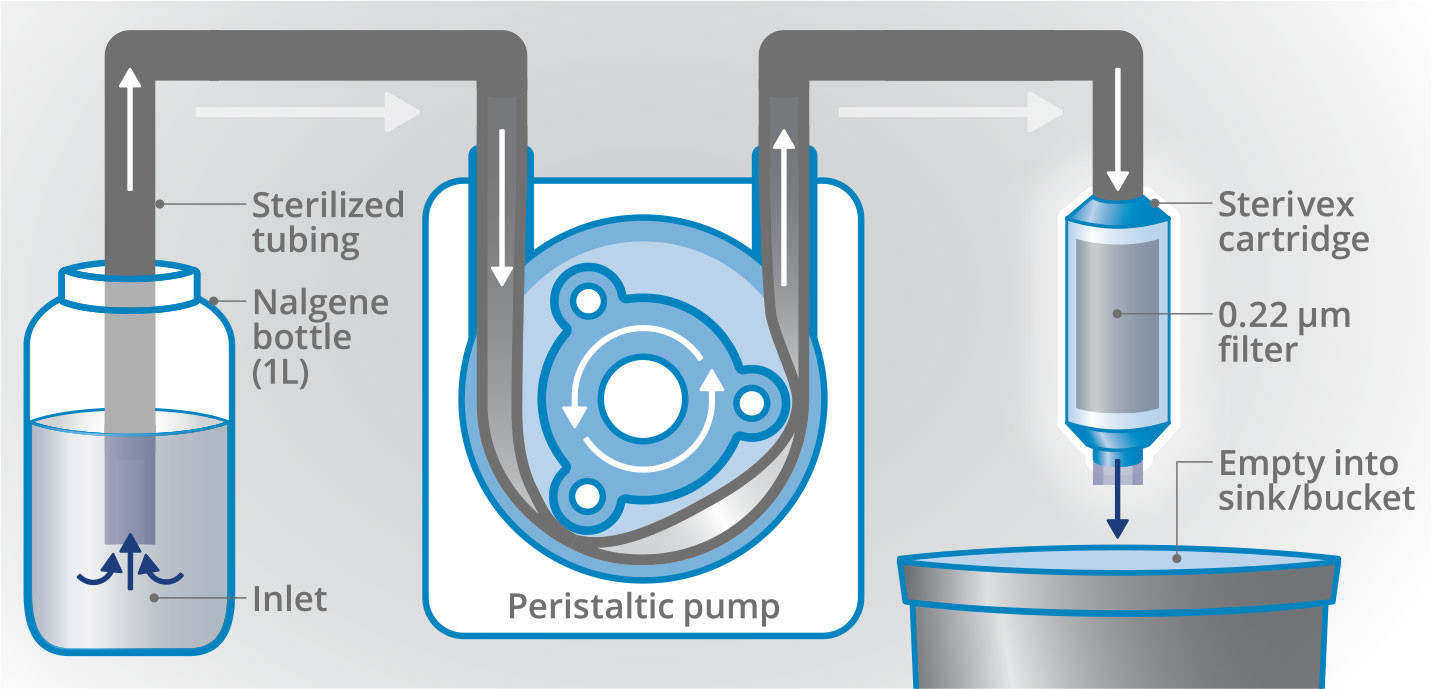
From September through October 2020, 249 eDNA samples were collected in partnership with EcoFOCI. These efforts had additional support through the Arctic Marine Biodiversity Observation Network (AMBON), and the samples will be shared with the AFSC to address complementary scientific questions related to fish. In total, 51 sampling sites in the Bering, Chukchi, and Beaufort Seas were selected to be co-located with long-term EcoFOCI moored sites and the established Distributed Biological Observatories. One-liter seawater samples were collected by Niskin bottles on CTD casts and were subsequently filtered onto single-use Sterivex capsule filters following sterile procedures (Figure 1), preserved with molecular grade ethanol, and frozen at –20°C for further analysis.
|
|
Preserved eDNA samples were sent to a contracted laboratory (Center for Quantitative Life Sciences, Oregon State University) for DNA extraction following Spens et al. (2017). Two complementary loci, the 18S nuclear rRNA locus (Machida and Knowlton, 2012) and the 16S rRNA mitochondrial locus (Parada et al., 2015), were amplified using the source literature’s published protocols and sequenced on an Illumina MiSeq platform, using 2 × 300 bp paired-end sequencing. Each sample was processed in triplicate to detect potential amplification bias, and both positive and negative controls were integrated throughout the sample processing protocol. Raw sequences were analyzed using the bioinformatic pipeline, REVAMP (McAllister et al., 2023, in this issue), which quality-control reads (Cutadapt, DADA2; Martin, 2011; Callahan et al., 2016), merges paired reads and assigns sequence variants (DADA2), assigns taxonomy (BLASTn; Camacho et al., 2009), and conducts initial data analyses. Data analysis includes estimation of alpha-diversity metrics as well as non-metric multidimensional scaling (NMDS) to visualize multivariate data (phyloseq; McMurdie and Holmes, 2013) and fit environmental observations (vegan; Oksanen et al., 2020). DNA extractions are stored at PMEL, while all raw sequence data are deposited in the National Center for Biotechnology Information (NCBI) system for public dissemination.
Results and Discussion
This initial assessment of the Alaskan/Arctic eDNA captured substantial biodiversity from microbes to phytoplankton in addition to detecting many important metazoans. The 18S marker captured 1,536 unique amplicon sequence variants (ASVs, or DNA sequences) from 557 unique Eukaryotic and 25 unique Bacterial taxa. Due to within-species genetic variation, multiple ASVs can be assigned to a single species. Through the 16S primer, we captured 2,326 ASVs from 260 unique Eukaryotic, 318 Bacterial, and six Archaeal taxa. While the two genetic markers applied are complementary, some species were detected by both assays. Between the two markers, 722 unique Eukaryotic, 340 Bacterial, and 6 Archaeal lineages were detected, an overlap of only 8.4% identical taxa between markers.
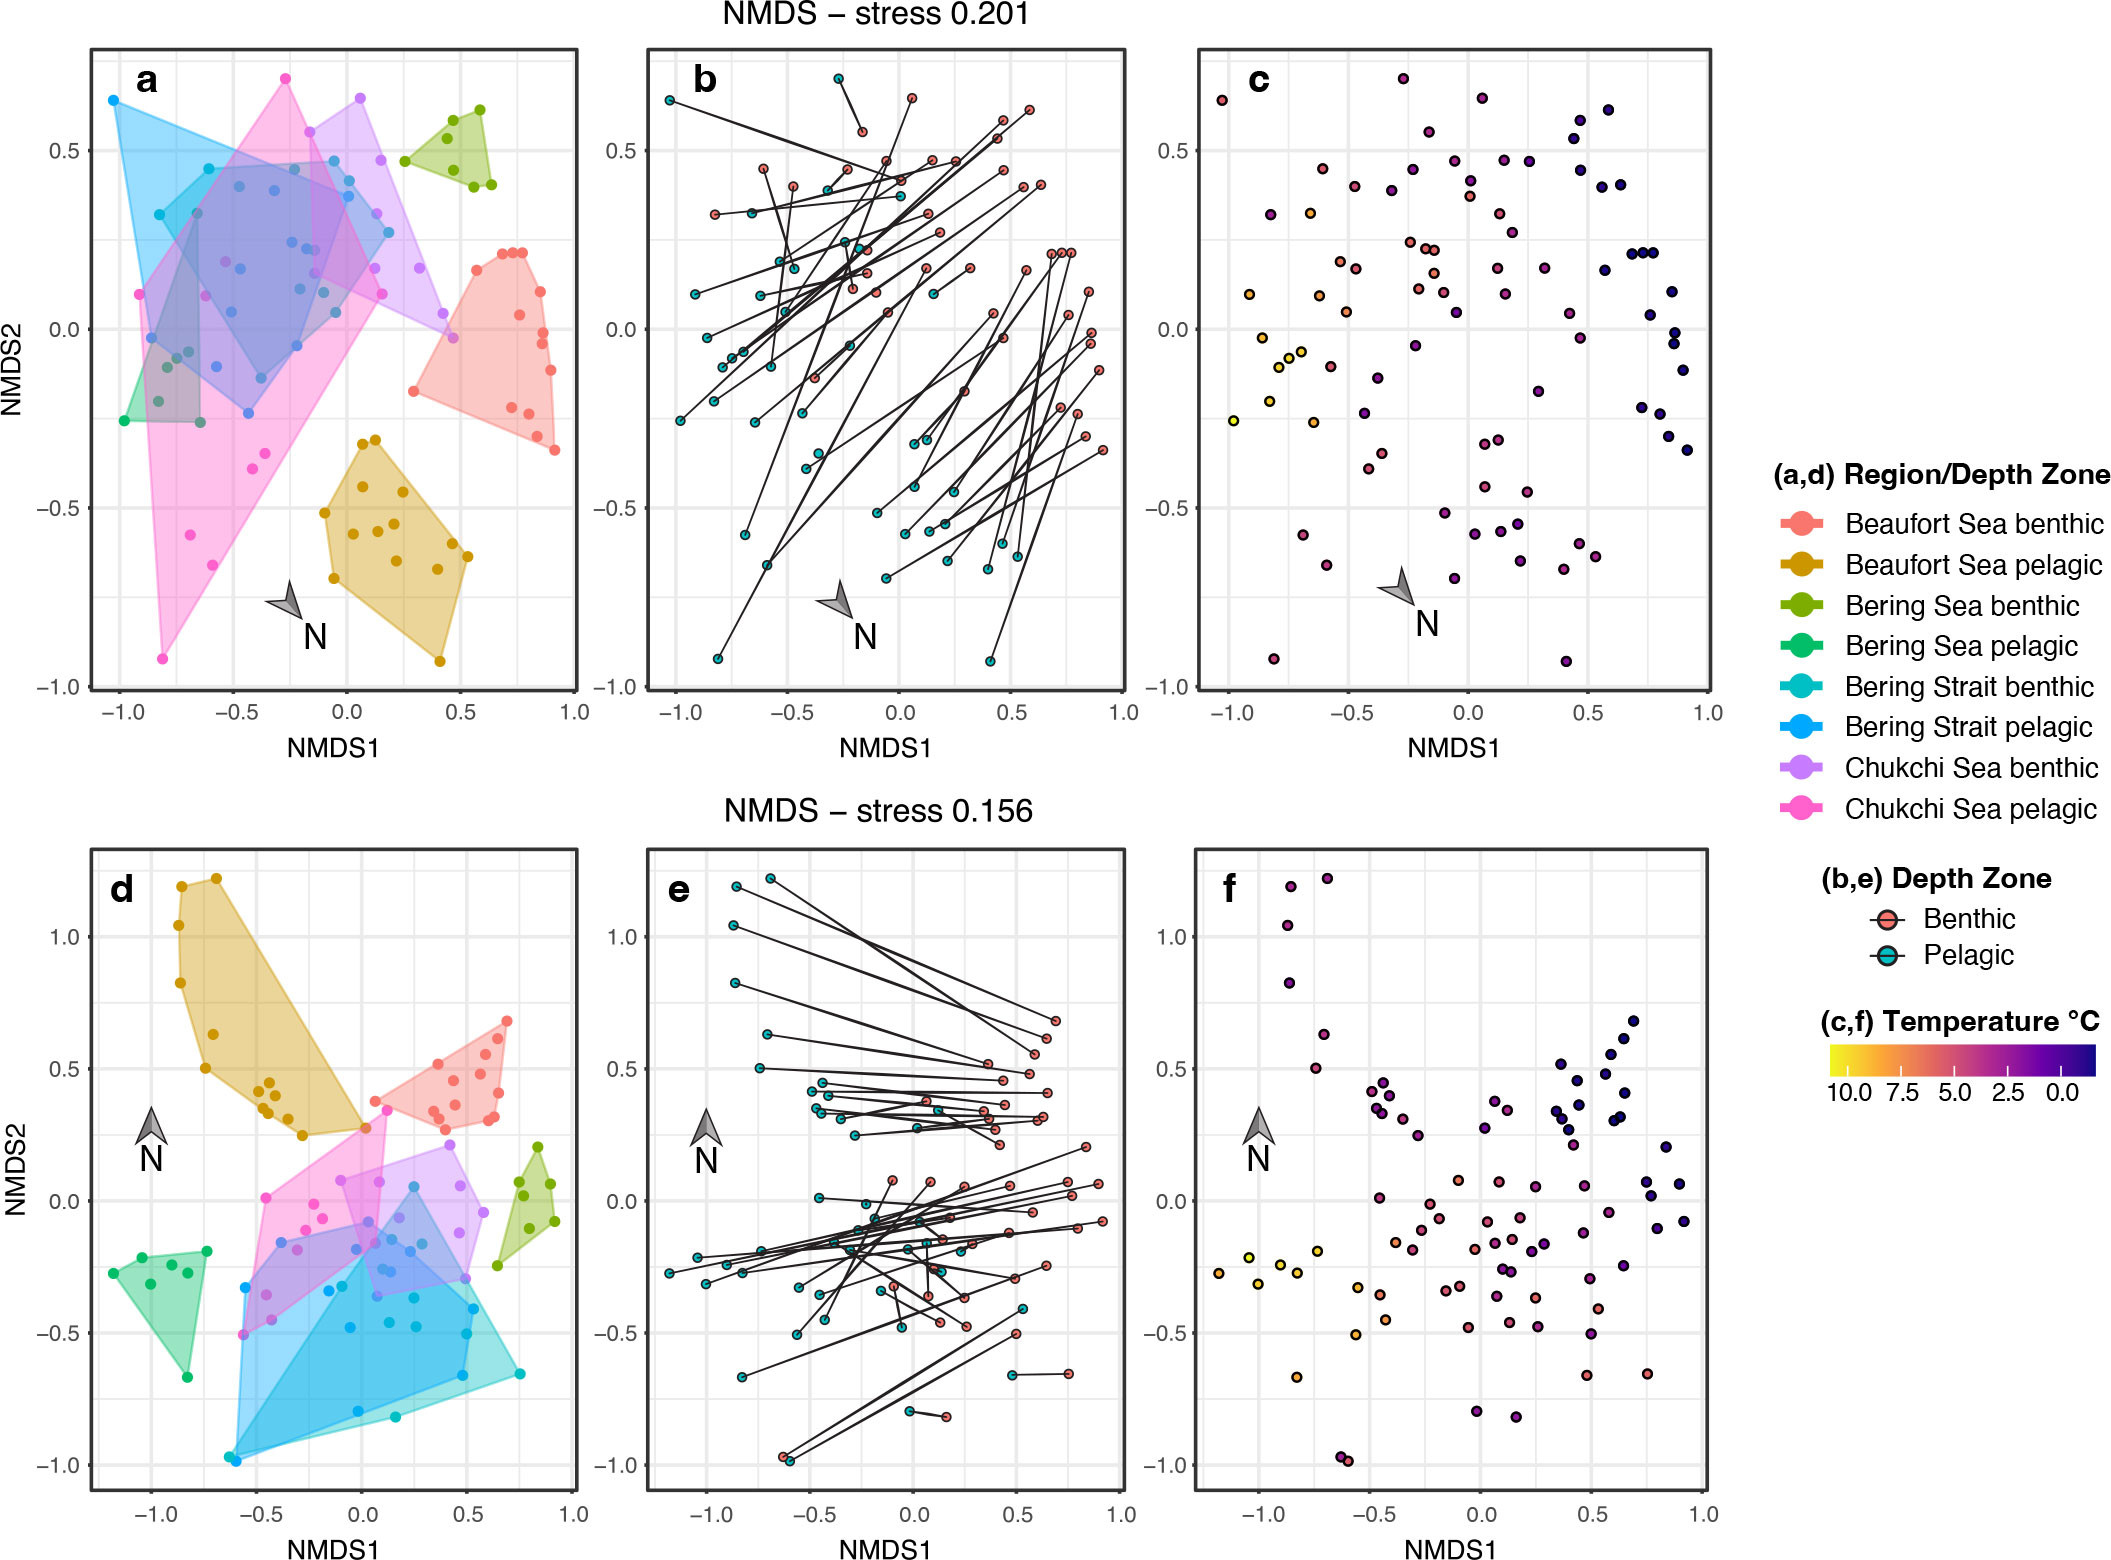
Applying NMDS to the eDNA metabarcoding sequence data showed structuring of the biological community (Figure 2), differentiating the northernmost samples (Beaufort Sea) from the rest, particularly along NMDS2 axis (Figure 2a,d). Along the latitudinal sample gradient in the Bering Sea, pelagic and benthic communities were clearly differentiated, while these communities overlapped in the Bering Strait, and were only slightly differentiated in the Chukchi Sea before differentiating again in the Beaufort Sea. This effect is more pronounced with the 16S marker (bottom) compared to the 18S marker (top). Further, depth trends are also clear along the NMDS1 axis (Figure 2b,e).
|
|
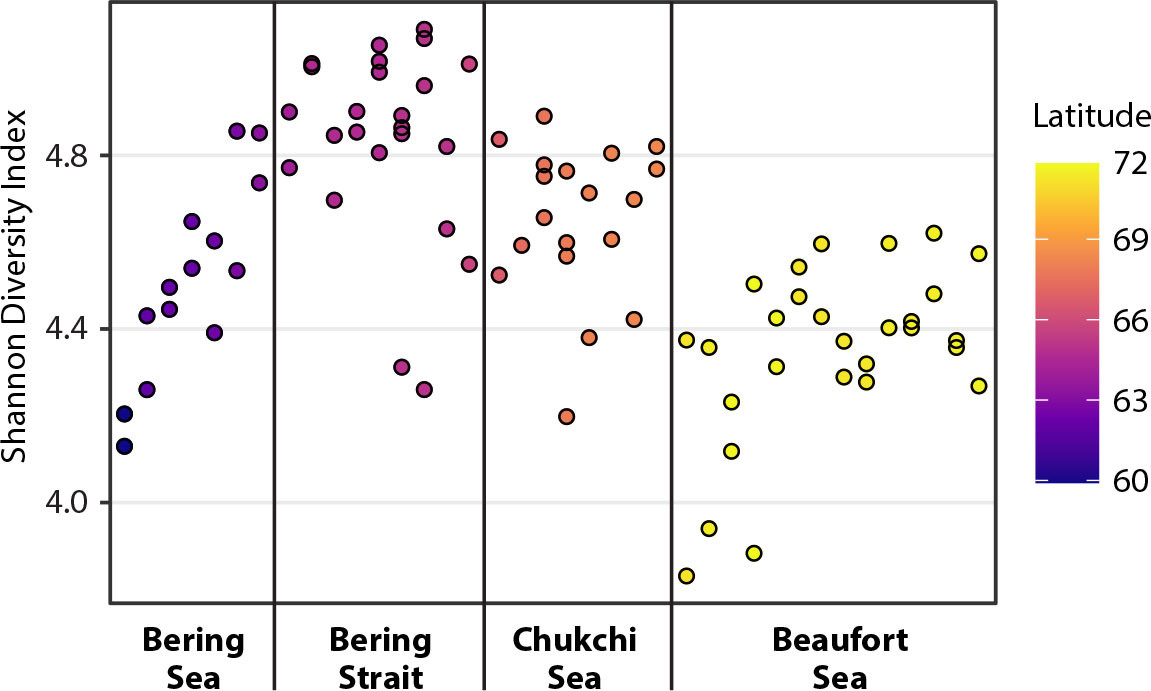
The Shannon diversity index (alpha-diversity measurement; Shannon, 1948) considers both the number (richness) and relative abundance (evenness) of the ASVs detected in each sample. Here, a clear trend in Shannon diversity was identified in the 16S marker data set, where high diversity was associated with Bering Strait samples compared to regions either to the south or the north (Figure 3). This trend appears to be related to the constriction of benthic and pelagic samples in the NMDS space.
|
|
Environmental fitting, applied to the observations in the NMDS plots, provided unique insights into the factors affecting the observed patterns of biodiversity. In order of statistical significance, the following variables impacted structuring of the biological diversity found in Alaskan waters: degrees latitude (p-value = 0.001), temperature (p-value = 0.001), salinity (p-value = 0.001), depth (p-value = 0.001), fluorescence (p-value = 0.003, 18S only), and oxygen (p-value = 0.005 for 18S; p-value = 0.003 for 16S). Additionally, these models highlighted the most significant ASVs that differentiated the sampled communities (see Figshare 18S and 16S links in Data Availability below: statistically significant ASVs for each marker). For the 18S marker, 359 ASVs were attributed to significant (p-value ≤ 0.05) differentiation among communities, the majority associated with phytoplankton, protists, and dinoflagellates. Data from the 16S marker revealed 589 statistically significant ASVs, with 328 associated with Bacteria, 255 with Eukaryota, and six with Archaea. We detected representatives across a wide array of marine phyla, including Annelida, Chaetognatha, Cnidaria, Copepoda, Crustacea, Ctenophora, Echinodermata, Mollusca, Rotifera, and Tunicata. Only nine metazoan ASVs were significant to community differentiation within the 18S data (none for the 16S data), including four annelids (Nephyts sp., Phyllodoce sp., Trochochaeta sp., and a member of family Capitellidae), two copepods (Oithona sp. and Pseudocalanus sp.), a chaetognath (order Aphragmophora), a cnidarian (family Pelagiidae), and a ctenophore (Dryodora glandiformis).
The base of the food web (primary productivity, primary consumers, and the microbial loop) were particularly well represented by both markers. Primary consumers included the protists in Ciliophora and dinoflagellates in Dinophyceae. From the microbial community, we detected substantial signals from Bacteroidetes taxa, suggesting a prolific heterotrophic community for organic carbon degradation (Thomas et al., 2011). Due to warming trends, there is increasing concern within Alaska about marine species responsible for harmful algal blooms (HABs; Anderson et al., 2022). We detected genera and species that may be associated with toxic HABs, though they were primarily found in very low relative abundance. This included known HAB species—Aureococcus anophagefferens, Karenia mikimotoi, Karenia papilionacea, Karlodinium veneficum, Margalefidinium fulvescens, Pseudo-nitzschia delicatissima, and Pseudo-nitzschia multiseries—in addition to several toxic HAB genera, including Alexandrium. We also detected HAB associated parasites from the genus Amoebophrya, an endoparasite that can infect a wide range of dinoflagellates and has been associated with the termination of blooms (Velo-Suárez et al., 2013; Nishitani et al., 2021). The detection of this endoparasite in the water column may indicate a recent bloom, and detections such as this exemplify the potential use of eDNA for tracking HAB frequencies in time and space via key indicator species.
From microbes to metazoans, this work reflects the PMEL OME program’s inaugural eDNA biodiversity assessments in Alaska and the Arctic, in collaboration with EcoFOCI, AFSC, and AMBON. By expanding the scope of species detected through the use of additional biodiversity markers and standardizing eDNA as an integrated routine protocol in field season surveys by PMEL and our partners, we can build on the work conducted at these observatories with a highly informative, complementary, biodiversity-focused toolset. Further, building a long-term spatial data set will provide a fundamental record of how the Alaskan and Arctic ecosystems are responding to a rapidly changing marine environment. To this end, large geographic surveys are critical to our understanding of the system as a whole, but the inclusion of moored automated samplers, a PMEL staple, are key for detecting seasonal and annual variability. These efforts are critical to the mission goals of NOAA, PMEL, our local and academic partners, and stakeholders.