Full Text
The 2004 magnitude (M) 9.1 Sumatra-Andaman Islands earthquake in the Indian Ocean triggered the deadliest tsunami ever, killing more than 230,000 people. In response, the United Nations Educational, Scientific, and Cultural Organization (UNESCO) established three additional Intergovernmental Coordination Groups (ICGs) for the Tsunami and Other Coastal Hazards Early Warning System: for the Caribbean and Adjacent Regions (ICG/CARIBE-EWS), for the Indian Ocean, and for the Northeastern Atlantic, Mediterranean, and Connected Seas. Along with the ICG for the Pacific Ocean, which was established in 1965, one of the goals of the new ICGs was to improve earthquake and tsunami monitoring and early warning. This need was further demonstrated by the 2011 Great East Japan (Tōhoku-oki) earthquake and tsunami, which killed more than 20,000 people, and other destructive tsunamis that occurred in the Solomon Islands, Samoa, Tonga, Chile, Indonesia, and Peru.
In response to the call to action by the UN Decade of Ocean Science for Sustainable Development (2021–2030), as well as the desired safe ocean outcome (von Hillebrandt-Andrade et al., 2021), the Intergovernmental Oceanographic Commission (IOC) of UNESCO approved the Ocean Decade Tsunami Programme in June 2021. One of its goals is to develop the capability to issue actionable alerts for tsunamis from all sources with minimum uncertainty within 10 minutes (Angove et al., 2019). While laudable, this goal presents complexities. Currently, warning depends on quick detection as well as the location and initial magnitude estimates of an earthquake that may generate a tsunami. Other factors that affect tsunamis, such as the faulting mechanism (how the faults slide past each other) and areal extent of the earthquake, currently take at least 20–30 minutes to forecast and are still subject to large uncertainties. Hence, agencies charged with tsunami early warning need to broadcast public alerts within minutes after an earthquake occurs but may struggle to meet this 10-minute goal without further technological advances, some of which are outlined in this article.
To reduce loss of life through adequate tsunami warning requires global ocean-based seismic, sea level, and geodetic initiatives to detect high-impact earthquakes and tsunamis, combined with sufficient communication and education so that people know how to respond when they receive alerts and warnings. The United Nations International Strategy for Disaster Reduction defines an early warning system as “a set of capacities needed to generate and disseminate timely and meaningful warning information to enable individuals, communities, and organizations threatened by a hazard to prepare and to act appropriately and in sufficient time to reduce the possibility of harm or loss” (UNISDR, 2012). In short, a successful early warning system requires technology coupled with human factors (Kelman and Glantz, 2014).
In this article, we explore case studies from Japan and Canada, where scientists are leading the way in incorporating ocean observing capabilities in their early warning systems. We also explore advancements and challenges in the Caribbean, an area with a complex tectonic environment that would benefit greatly from increased global ocean observing capabilities. We also explore physical and social science interventions necessary to reduce loss of life.
Technological Capabilities
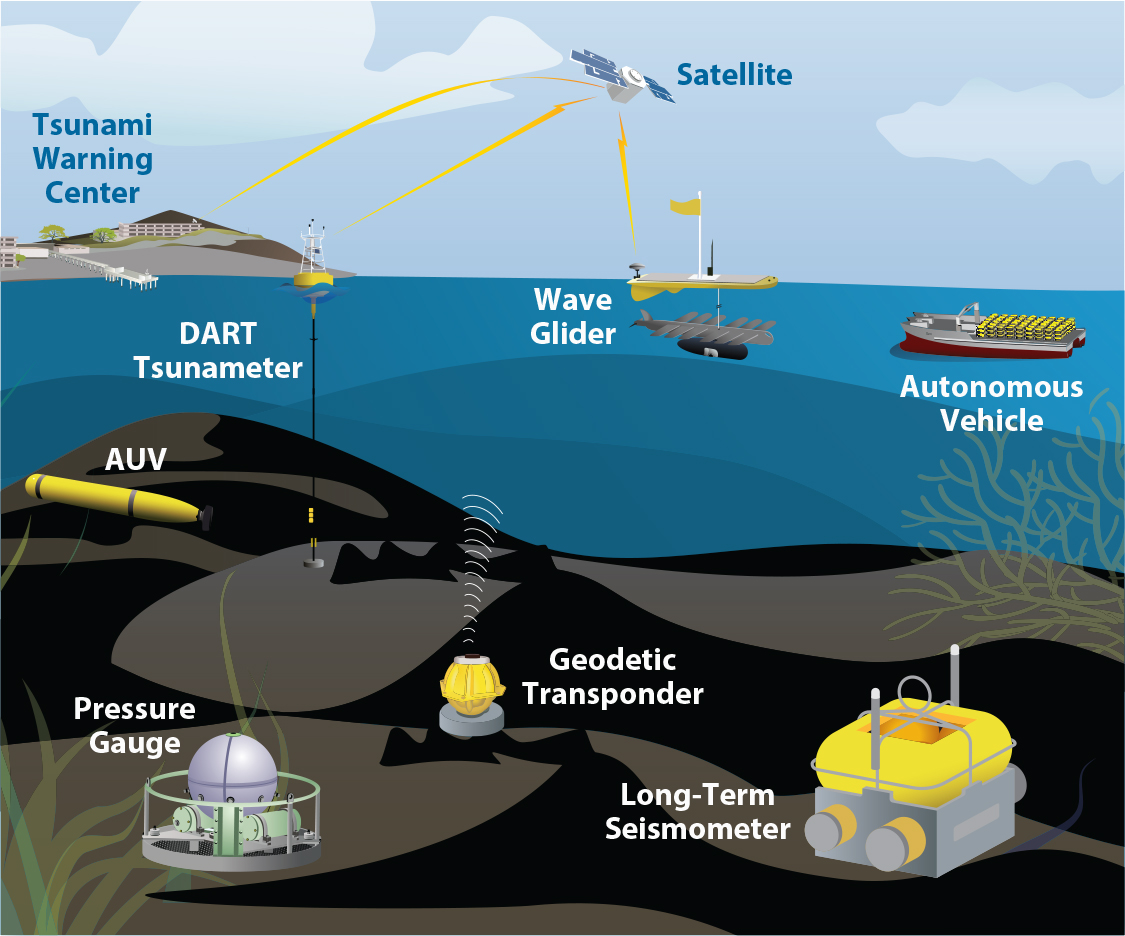
Seafloor seismometers measure Earth motions in three dimensions across an extensive frequency band, from tides, earthquake-caused resonances, and seismic waves to sounds created by whales and ships (e.g., Kohler et al., 2020; Kuna and Nábelek, 2021; Figure 1). Seafloor bottom pressure recorders enable detection of a tsunami wave and its speed, direction, and wavelength, providing information to help forecast coastal tsunami height and duration (e.g., Rabinovich and Eblé, 2015). For instance, Deep-ocean Assessment and Reporting of Tsunamis (DART) seafloor pressure recorders (or tsunameters) are coupled with a separately moored buoy at the sea surface (Figure 1) to send real-time data via satellite transmission to tsunami warning centers (TWCs). The real-time transmission of data (on the order of minutes to tens of minutes) to TWCs helps refine the location of a potential tsunami-generating earthquake and produce more accurate tsunami forecasts and warnings. Technological improvements in acoustic data transmission from seafloor networks to wave gliders, autonomous underwater vehicles, and buoys closer to or at the sea surface have helped reduce delays in delivery of data to TWCs (Figure 1). Wave gliders, which look like autonomous surfboards with collapsible propellers, use wave and solar energy for electrical power and propulsion. Within minutes, onboard communications systems access orbiting satellites in order to send data from seafloor sensors to onshore collection points.
|
|
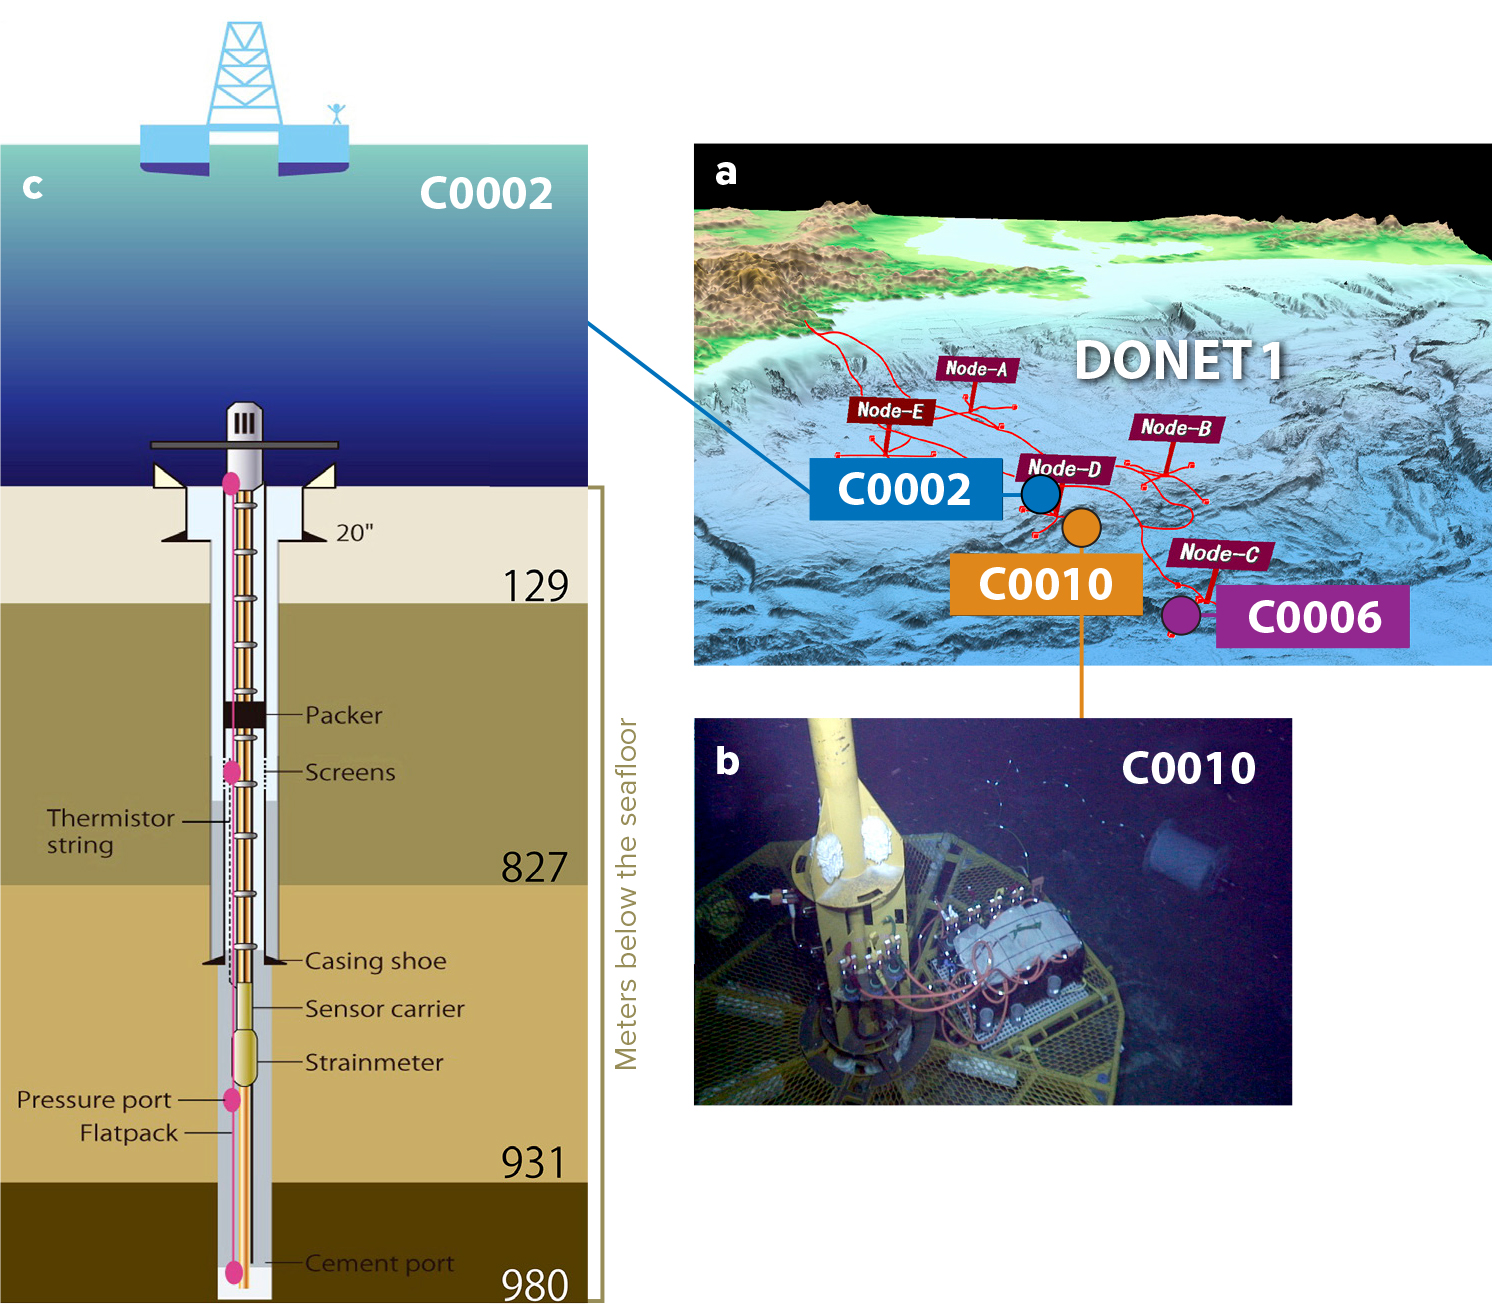
In the past two decades, Japan, Canada, and the United States have also installed seismic and bottom pressure recorders onto regional ocean bottom fiber-optic cable arrays located in the Pacific Ocean. For example, in waters off southwestern Japan in the Nankai Trough, the Japan Agency for Marine-Earth Science and Technology (JAMSTEC) constructed DONET, the Dense Oceanfloor Network system for Earthquakes and Tsunamis (Aoi et al., 2020). DONET connects various sensors to a node (a junction that connects sensors to a submarine cable) to provide data for evaluating the coupling and slip behavior along the Nankai Trough, a fault area presumed to be primed for a future earthquake and potential tsunami (Figures 2a and 3a). M8 earthquakes occur at intervals of about 100–200 years at the Nankai Trough due to the subduction of the Philippine Sea Plate beneath the Eurasian Plate. More than 75 years have elapsed since the last two M8+ earthquakes, the 1944 M8.1 and 1946 M8.3 events, ruptured the Nankai Trough. The probability of an M8 earthquake occurring in this region in the next 30 years is estimated to be more than 80% (Geological Survey of Japan, 2021).
|
|
|
|

DONET contains seismometers, pressure recorders, and borehole observatories (Figure 2b,c). JAMSTEC also constructed a seafloor geodetic network by utilizing the DONET system as data transmission infrastructure. In the central part of the Nankai Trough, a sensor system for observing earthquakes, strain, tilt, and pore fluid pressure is installed in boreholes drilled by the vessel Chikyu and connected to DONET (Figure 2b,c). The pore pressure data obtained show that the plate boundary fault slips slowly (by 1–2 cm) over a duration of ~2 weeks, with a frequency of every 1 to 1.5 years, in the shallow part of the presumed earthquake fault (Araki et al., 2017). Because recent seismological studies reveal a possible relationship between slow slip phenomena and the timing of large earthquakes (e.g., Araki et al., 2017), the development of a seafloor network for real-time geodetic observations that includes a borehole observatory, seafloor tiltmeters, and fiber-optic cable strainmeters is underway to quickly identify unusual slip behavior (Aoi et al., 2020).
After the 2011 Tōhoku-Oki earthquake, the National Research Institute for Earth Science and Disaster Resilience (NIED) quickly established an earthquake and tsunami monitoring network called S-net to monitor aftershock activity and to detect future tsunamis for early warning purposes (Figure 3b, e.g., Mulia and Satake, 2021). S-net is characterized by seismometers and pressure gauges embedded in offshore submarine cables that are now used to develop and implement a tsunami inundation early warning system. In the western part of the Nankai Trough, a hybrid observation network called N-net is under construction, with the features of both S-net (i.e., cable-embedded sensor system) and DONET (i.e., node-connected sensor system).
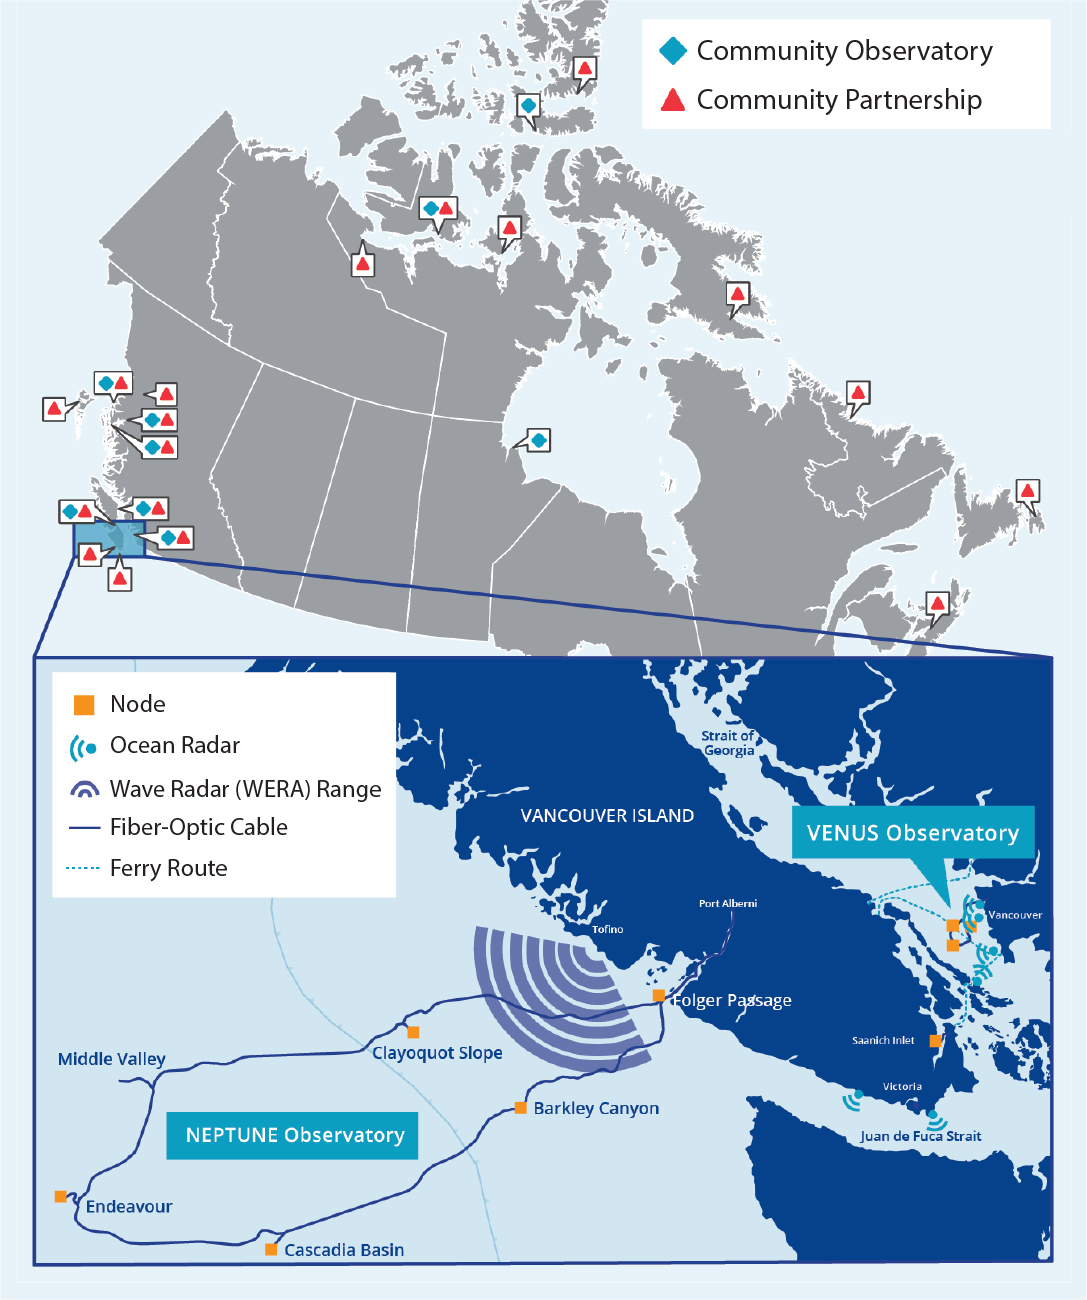
Similar to the Nankai Trough but on the other side of the Pacific Ocean, the Cascadia Subduction Zone (CSZ), runs beneath the west coast of the United States from northern California up through Washington state and then into southern Canada beneath Vancouver Island. Ocean Networks Canada (ONC) installed seafloor cabled observatories, called NEPTUNE and VENUS, to measure seafloor tectonic movement on the CSZ where the Juan de Fuca Plate subducts beneath the North American Plate. In 1700, the CSZ ruptured in a large M9 earthquake and produced tsunamis both locally and across the ocean in Japan, so we know the CSZ represents a significant earthquake and tsunami hazard to Canada and the United States. ONC’s seabed geodesy observatory uses long-endurance acoustic sensing seafloor monument nodes, similar to Japan’s DONET, where the data are wirelessly transmitted to a surface autonomous vehicle that, in turn, connects with the Global Navigation Satellite System (GNSS) (Figure 4; Farrugia et al., 2019). Knowledge of the relative distance between the nodes enables scientists to calculate movement between the two converging plates with high accuracy.
|
|
To date, most seafloor cabled observatories and other infrastructure designed to make tsunami early warning a possibility are located in the Pacific Ocean. The variety of earthquake and tsunami-generating sources in the Caribbean dictate the location and instrument types needed for an ocean monitoring network in this region. An extensive network of coastal sea level stations, DART tsunameters, GNSS stations, and seismic stations contribute real-time data to ICG/CARIBE-EWS. These data are used by the Pacific Tsunami Warning Center, as the Regional Tsunami Service Provider, and national tsunami warning centers to monitor, detect, and warn of impending tsunamis (von Hillebrandt-Andrade, 2013).
UNESCO performance standards are carefully applied to the location of Caribbean seismic stations with the goal of reducing to within one minute the time needed to detect an earthquake and determine whether it reaches a magnitude threshold of M4.5, which could generate strong enough shaking to constitute a tsunami threat (e.g., McNamara et al., 2016). In the first 10 years of ICG/CARIBE-EWS (2006–2015), large increases in the number of data-sharing seismic and sea level stations improved the performance of seismic and tsunami wave detection (Figure 5). For example, the seismic system increased from 10 stations, mostly operated by the onshore Puerto Rico Seismic Network (PRSN), to over 100 stations shared by all countries in the region (McNamara et al., 2016). The number of sea level stations reporting in near-real time increased from 5 to 78 between 2004 and August 2017 (http://caribewave.org). However, station operation faces many challenges in a region with annual hurricanes and other hazards. In September 2017, earthquake and tsunami monitoring performance in the Caribbean was significantly reduced due to damage to onshore networks and regional seismic and sea level networks by Hurricanes Maria and Irma, and then Hurricane Iota in 2020 (Figure 5).
|
|
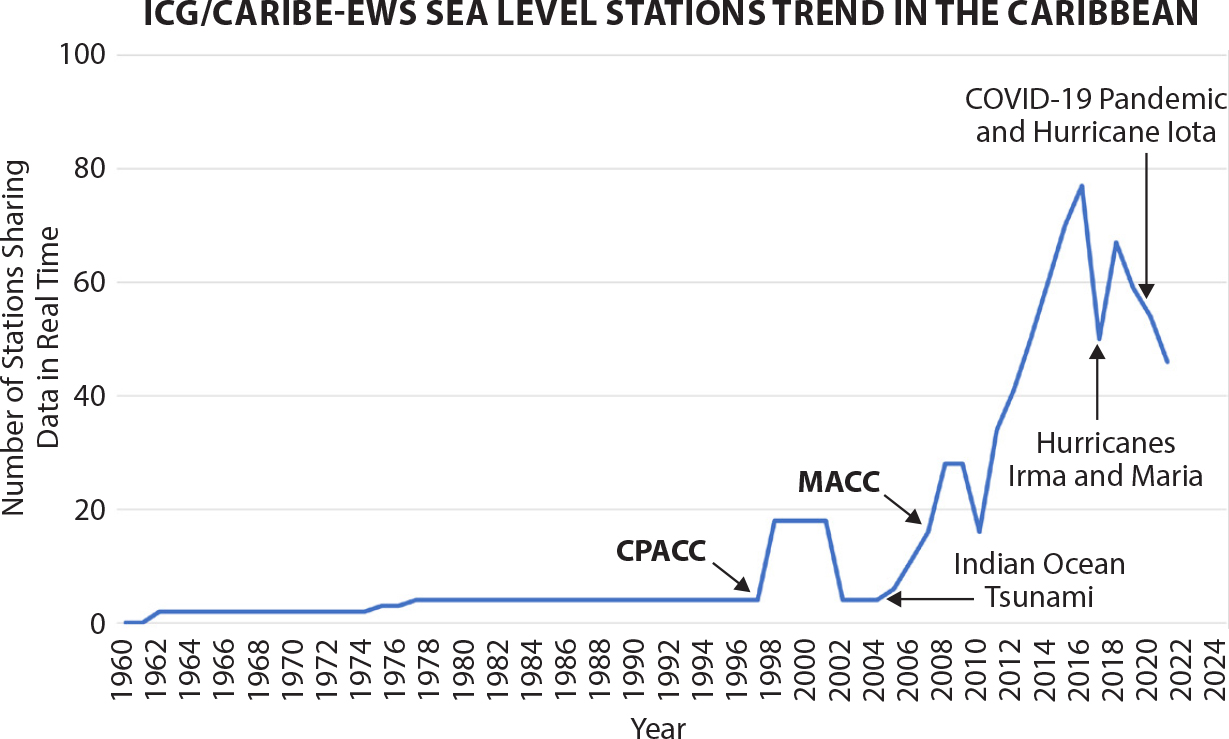
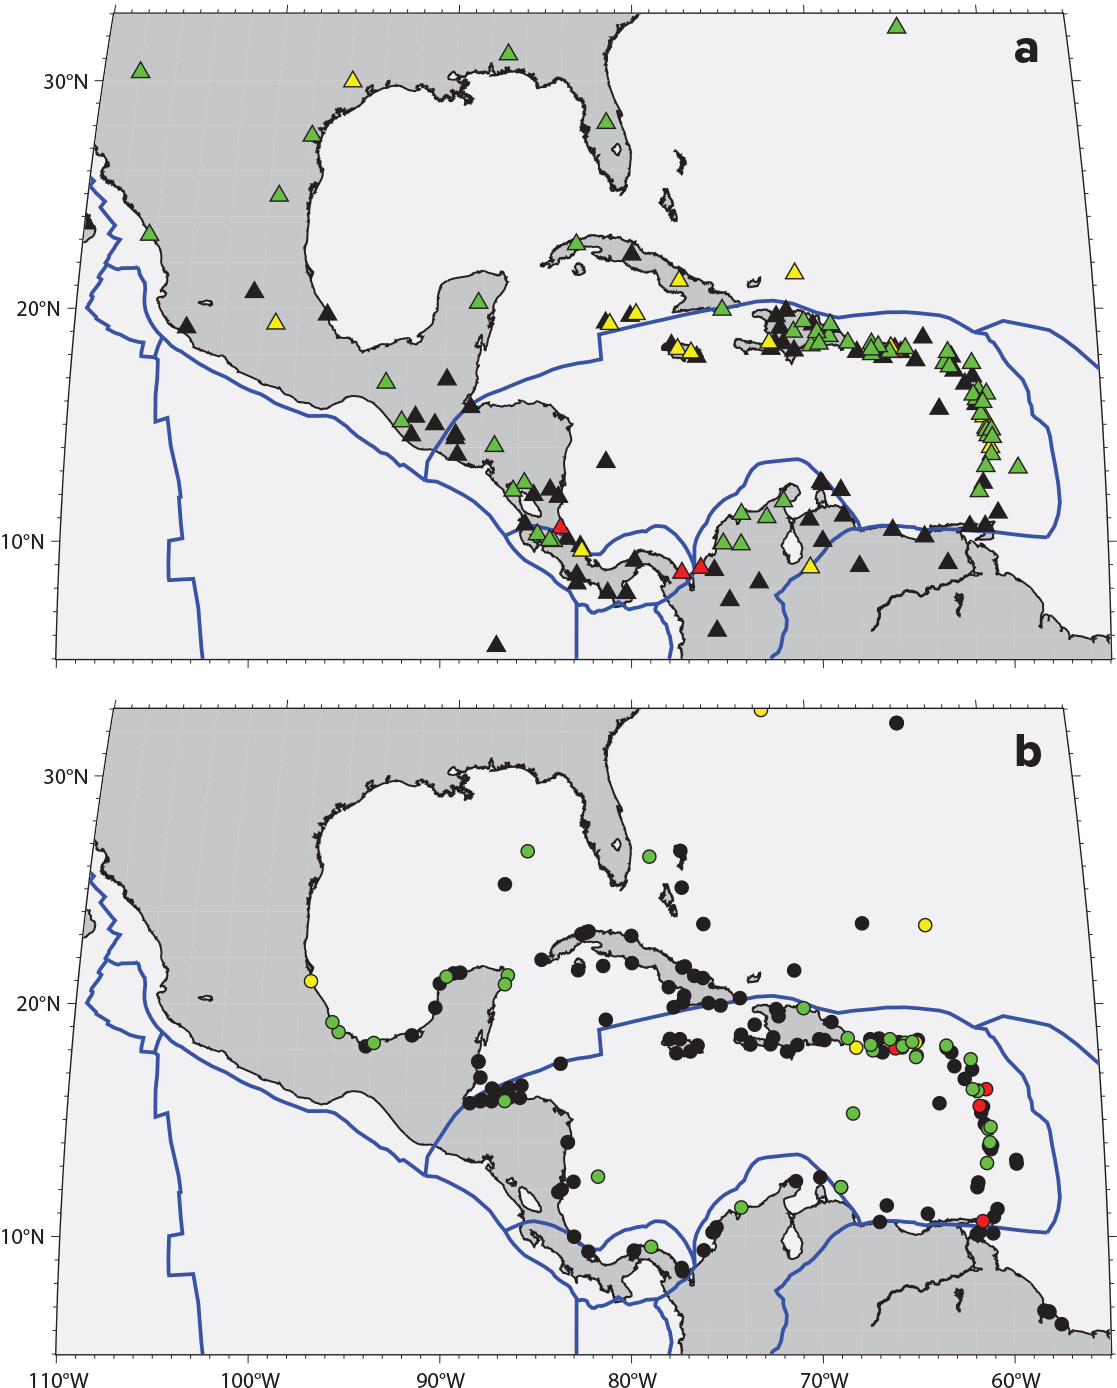
Other regional and international partners lost numerous pieces of equipment and data transmission capabilities due to wind and water damage. In addition, the COVID-19 pandemic has degraded performance, as all fieldwork to repair and maintain stations came to a halt, which resulted in long-term data drops. Today, station visits are beginning to occur as COVID travel restrictions are lifted throughout the region. Critically, based on the experience from the recent hurricanes, many instrumentation sites were not only repaired but also hardened to improve data continuity during future meteorological events. Although field technicians have repaired many stations and reinstalled others to contribute data to early warning and research, there are still seismic and sea level data gaps (Figure 6).
|
|
Tsunami Early Warning
Collecting and distributing near-real-time data from long-term seafloor deployments will increase the accuracy of earthquake parameters, such as a quake’s location, the fault on which it occurred, and how large and energetic it was. Seismic waves generated by earthquakes, storms, and other environmental processes travel through all parts of Earth, and their recordings inform scientists about both the shallow and deep parts of our planet. Tying existing technologies to new ones, such as wave gliders and satellite and submarine cable data communications, provides a means for developing global long-term ocean observatories whose sustained observations will help to build coastal resilience to natural hazards. However, tsunami monitoring and early warning systems currently vary by country.
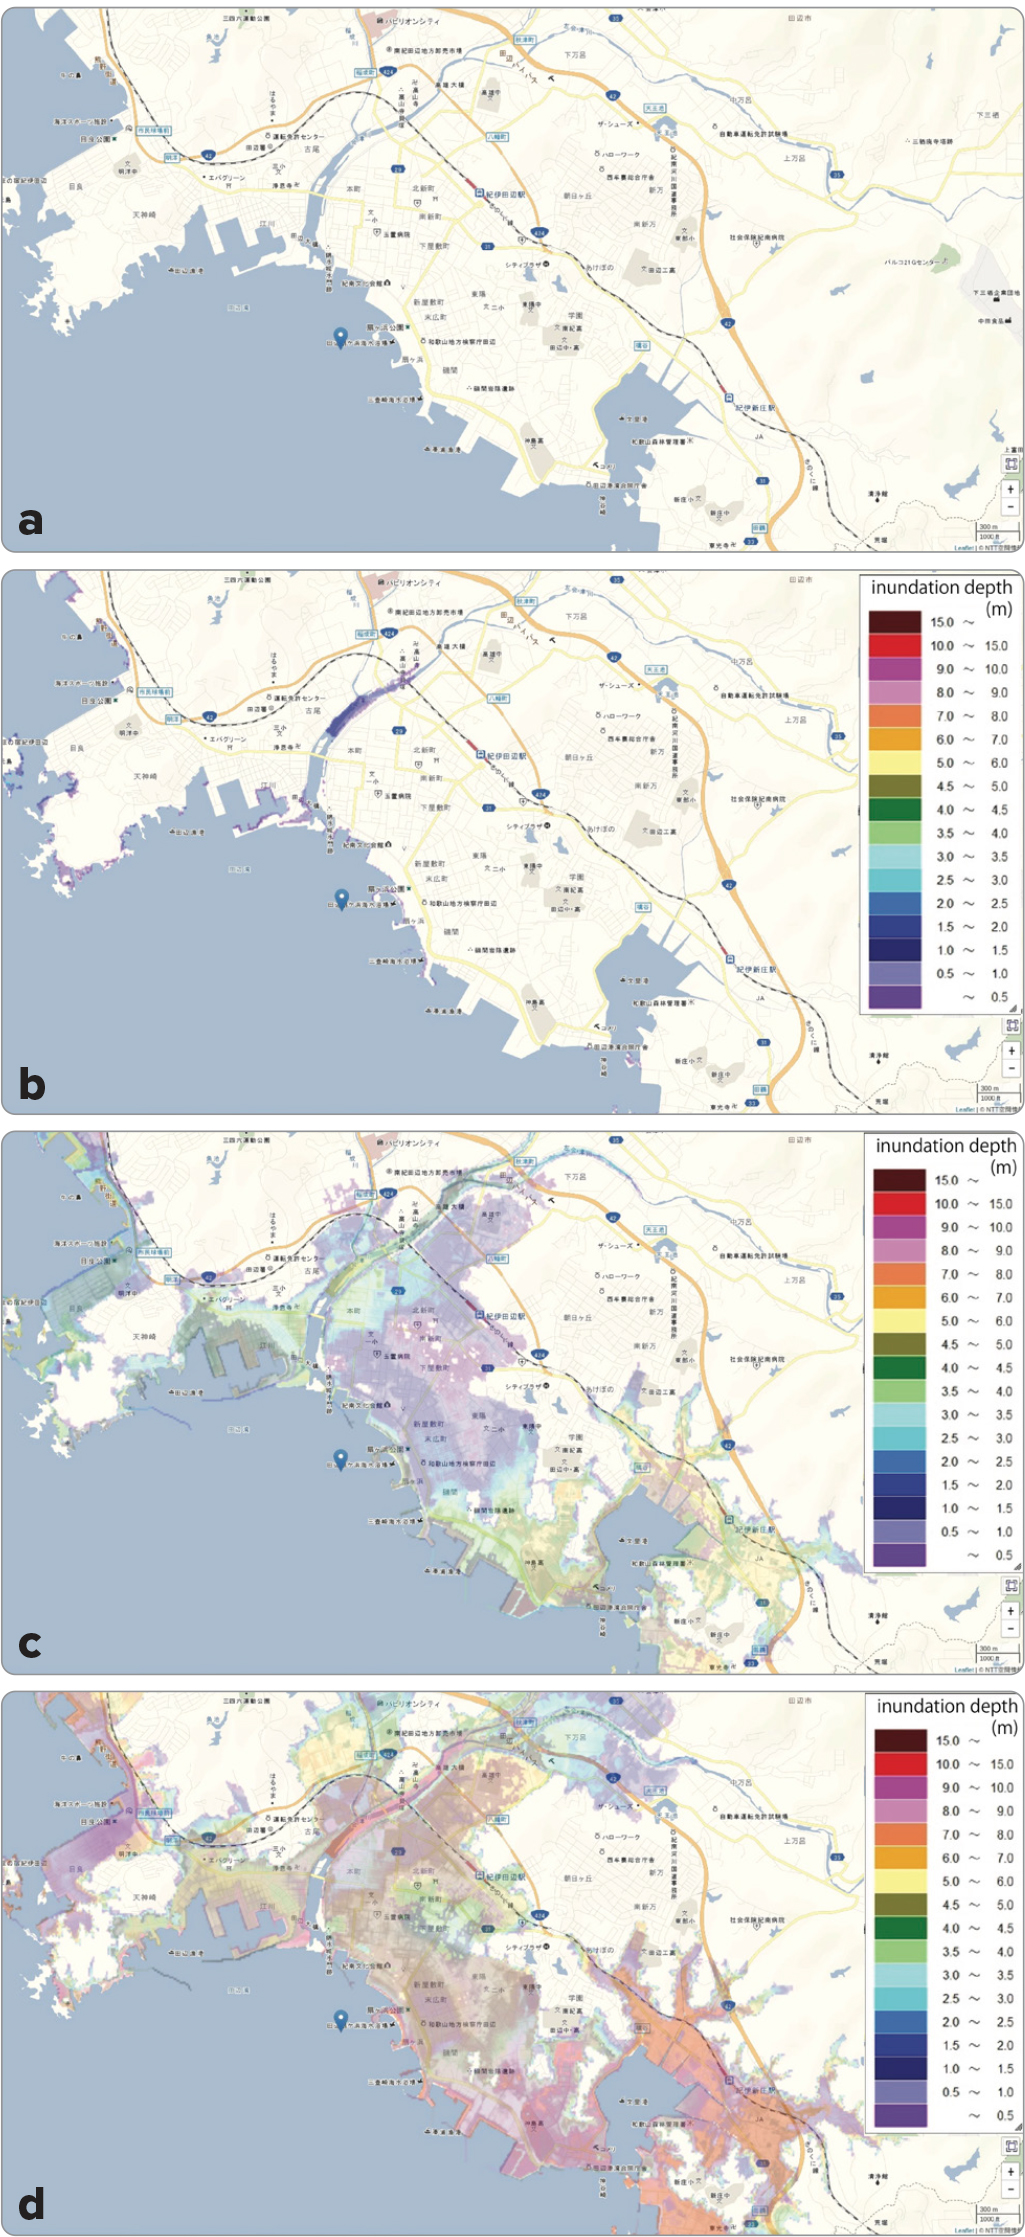
Japan’s 2011 M9 Tōhoku-Oki earthquake and tsunami devastated eastern Japan and led to rapid advancements in technology and tsunami early warnings. Prior to 2011, the Japan Meteorological Agency issued tsunami warnings based primarily on earthquake observations; this sometimes led to underestimation of other parameters, such as tsunami height (Japan Meteorological Agency, 2013). For the Nankai Trough, JAMSTEC and NIED constructed a database of simulated tsunami waveforms that are based on tide gauge and inundation height data for more than 1,500 tsunami scenarios. When a tsunami occurs, the early warning system compares observed tsunami waveforms with those in the database, extracts the appropriate inundation height information, and immediately issues a warning. Several local governments along the Nankai Trough (Figure 7) already operate similar systems. Although the tsunami inundation early warning system is important post-earthquake, information about current plate coupling (how two tectonic plates interact) and fault slip behavior collected continuously by seafloor geodetic instruments and transmitted to shore in real time is essential to prepare for future earthquake and tsunami hazards. For this purpose, the Japanese government disseminates pre-earthquake advisories when unusual fault slip is observed along the Nankai Trough.
|
|
In Canada, ONC integrates inundation forecasting into planning efforts to improve awareness of earthquake and tsunami risks as part of its tsunami hazards observing programs, including the development of a regional earthquake early warning system for southwest British Columbia (Schlesinger et al., 2021). ONC’s real-time observations of earthquake shaking and tsunami wave heights support official tsunami alerts from the US National Tsunami Warning Center. In addition, ONC has worked collaboratively since 2016 with at-risk coastal communities, including Port Alberni, Tofino, Prince Rupert, and Semiahmoo First Nation, to improve understanding of the impacts that a large tsunami could have on their unique coastlines, communities, and infrastructures.
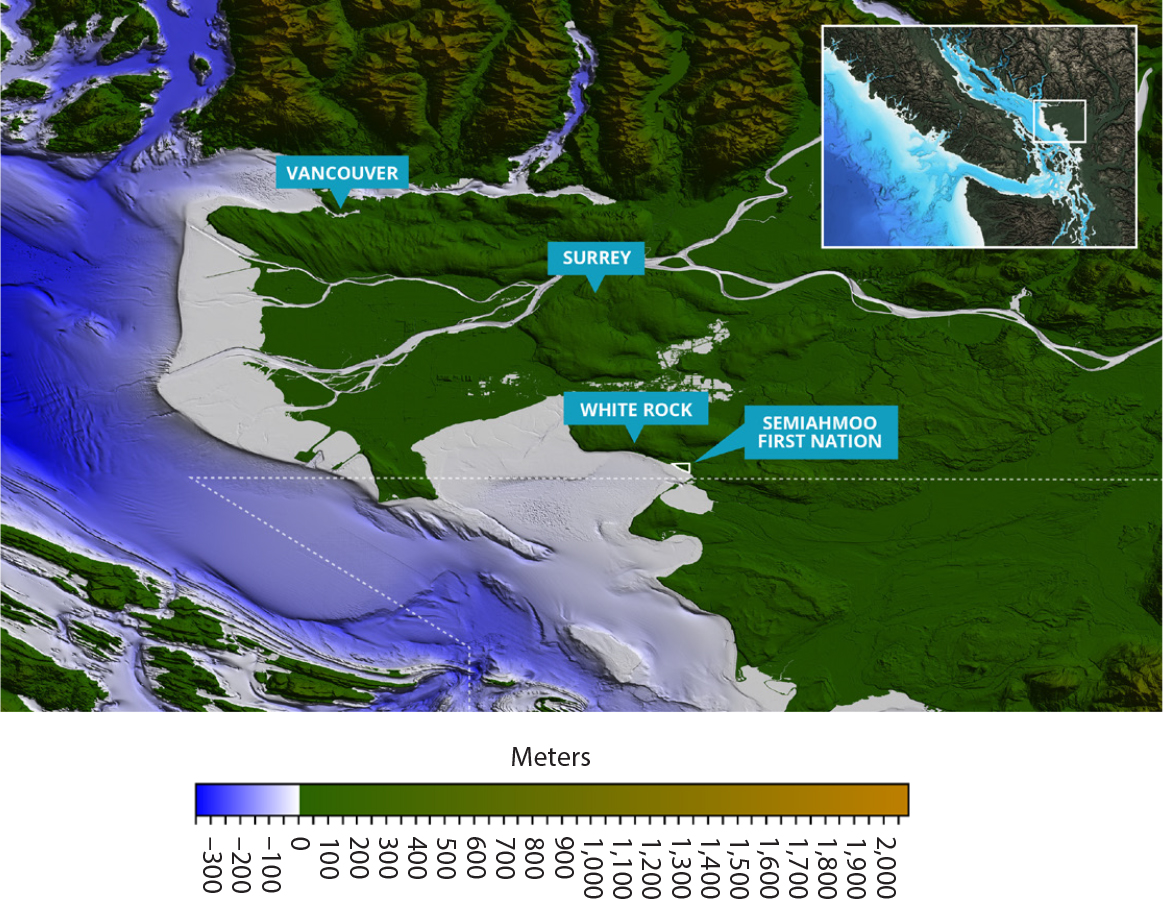
The simulations also incorporate some amount of sea level rise, making the forecast relevant for decades to come. These simulations are essential tools in tsunami forecasting and water level inundation modeling, and contribute to tsunami preparedness, response, resilience, and recovery. Achieving accurate simulations requires high-resolution digital elevation models (DEMs). In 2019, ONC collaborated with the Semiahmoo First Nation, as well as national and international partners, to develop the first high-resolution DEM for British Columbia’s lower mainland (Figure 8). This cross-border model between Canada and the United States integrates 40 distinct sources of land, river, and sea elevation and bathymetric data over an area of ~7,500 km2 to reveal the complex geographic features that can influence the behavior of tsunamis and currents as they move toward and impact the densely populated Salish Sea coastline.
|
|
Many island nations, such as those in the Caribbean, are located where tsunamis can reach shores within minutes of an earthquake, volcanic eruption, or submarine landslide. Over the past 500 years, 83 confirmed tsunamis have affected Caribbean countries, causing more than 4,500 deaths (https://www.ncei.noaa.gov/). Hundreds of thousands of people are threatened along the Caribbean coastlines, including an estimated 500,000 daily beach visitors from North America and Europe, many of whom are not aware of the tsunami and earthquake threat in the region. UNESCO has led the establishment of a tsunami early warning system for the Caribbean over the past two decades. Efforts include facilitating real-time data sharing; developing standards of practice and protocols; implementing Tsunami Ready (https://www.tsunamiready.org), the IOC-UNESCO international performance-based community recognition program on tsunami preparedness; and organizing the annual regional Tsunami Exercise (CARIBE WAVE; https://www.tsunamizone.org/caribewave/).
Earthquake and Tsunami Alerting Strategies and Barriers
In 2015, the United Nations released the Sendai Framework for Disaster Risk Reduction, which includes a goal to lower the global average number of disaster-related deaths from 2020 to 2030 compared to 2005 to 2015, noting that to meet this goal, monitoring and warning systems are required (United Nations Office for Disaster Risk Reduction, 2015). In Japan, Canada, and the Caribbean, earthquake and tsunami detection and early warning systems depend on ocean bottom infrastructure coupled with near-real-time acoustic and satellite data transmission. A complementary requirement is that various audiences be acutely aware of what to do if they receive a warning and/or that they know the natural signs of an impending tsunami (e.g., von Hillebrandt-Andrade, 2013).
However, barriers remain in terms of access to alerts. For instance, warning systems tend to rely on mobile or smartphone technologies to deliver alerts, a privilege available only to those who can afford these technologies. Further inequities exist for communities who may struggle to understand the alerts they receive due to language comprehension, and for those with access and functional needs. Also, seasonal tourists who travel to these hazard vulnerable regions may not be aware of the risk and/or may not understand the local language. Given the many potential barriers, warning systems require messages that utilize universal design best practices, a diversity of alerting channels and modalities, and message languages (e.g., McBride et al., 2021). Further, we acknowledge the potential for an earthquake- or tsunami-related disaster may be compounded by other life-altering events, such as hurricanes and pandemics, which can reduce capabilities for operating and maintaining existing networks.
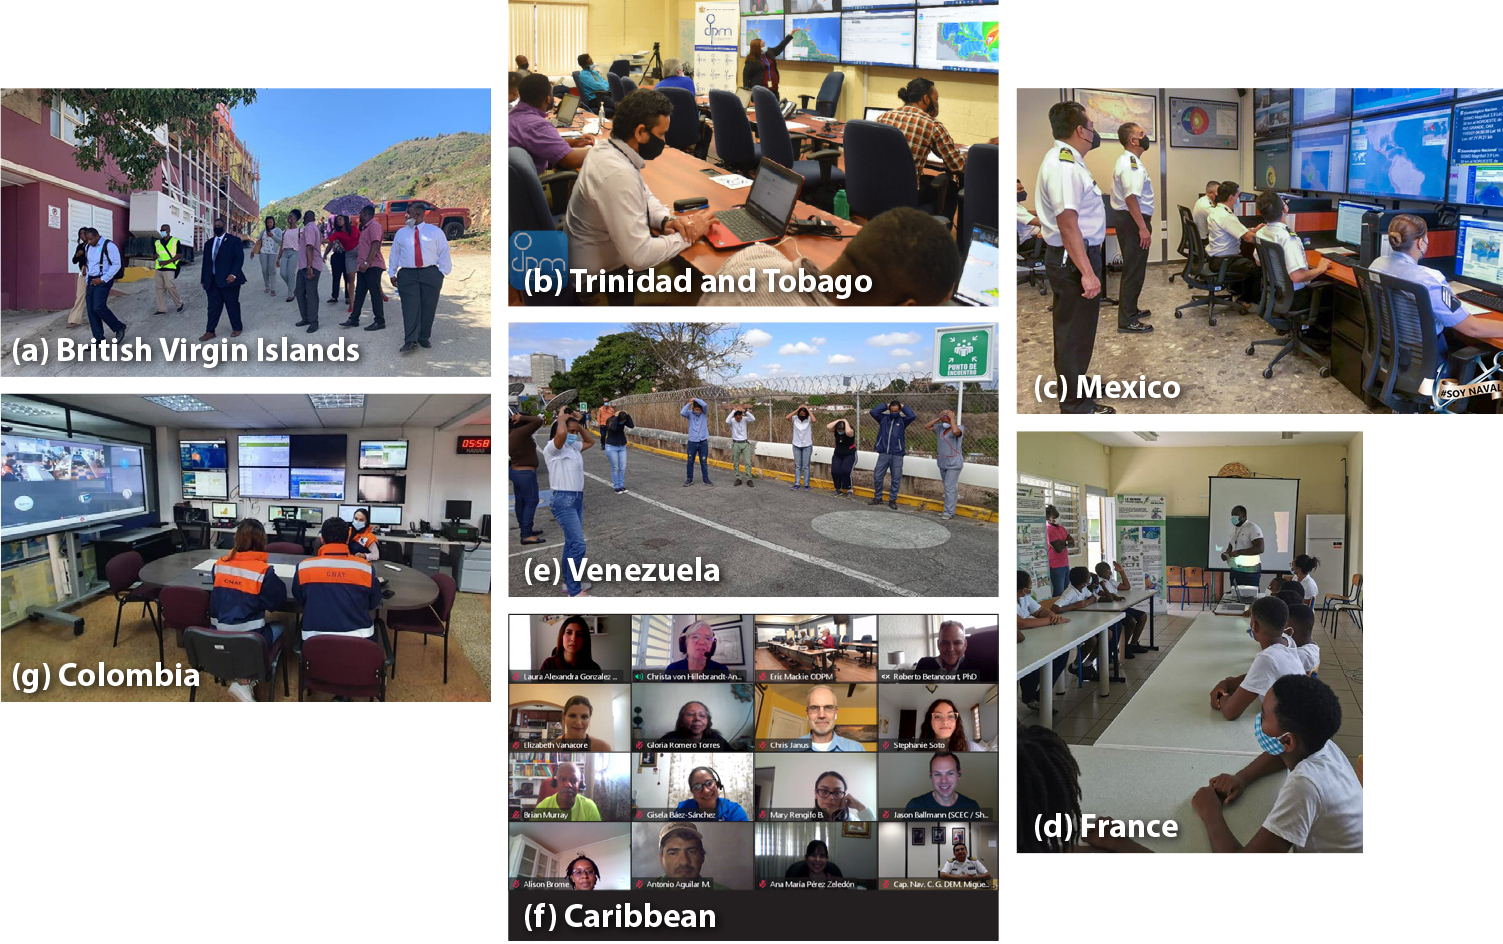
If people do not know what to do when a warning is issued, the value and purpose of earthquake monitoring and tsunami early warning systems are in question. Thus, we must ask: how do people understand the warnings and alerts provided to them, and do they know the best protective actions to take? McCaughey et al. (2017) note that social influence, for example, people watching others use cars to evacuate and then mirroring that behavior rather than using vertical evacuation buildings (structures built for coastal residents to escape tsunamis) was a major factor during a tsunami warning issued for the 2012 M8.6 Indian Ocean earthquake in Banda Aceh, Indonesia. Sutton et al. (2018) write that effective tsunami warning messages include more text (360 characters) that delivers information about the location of impact, threat-associated risks, and recommended protective actions. Earthquake- and tsunami-related drills and exercises, such as the international Great ShakeOut (https://www.shakeout.org/), TsunamiZone (https://www.tsunamizone.org), and IOC-UNESCO Wave Exercises, provide opportunities to communicate with and educate various audiences about their hazards (Figure 9). For the Caribbean and adjacent regions, IOC-UNESCO’s annual CARIBE WAVE involves 48 countries and territories extending from Bermuda to Brazil. Hundreds of thousands of people have participated since 2011 when the first exercise was held. The infrequent nature of earthquakes and tsunamis means that preparedness competes with other aspects of everyday life, but these drills offer regular opportunities to practice preparedness and evaluate the effectiveness of drills for specific countries and organizations (McBride et al., 2019).
|
|
Global risk reduction from earthquakes and tsunamis requires alert systems that address inequities in every part of the system, including data acquisition, alert delivery, and education and social science strategies, so people know what to do in the event of a disaster. Recognizing the need to reduce the time and uncertainty in the first tsunami alerts and increase the readiness of coastal communities, IOC-UNESCO approved the Global Ocean Decade Tsunami Programme as an action of the UN Decade of Ocean Science for Sustainable Development (2021–2030). The program proposes to expand existing observational systems to ensure all TWCs and Service Providers have the tools they need to effectively warn coastal and maritime communities and that all communities at risk from tsunamis are prepared and resilient.
These case studies argue for a global, cooperative approach to hazard monitoring, including ocean observing systems. For example, the United States conducted a short-term deployment of ocean bottom seismometers as part of the Cascadia Initiative from 2011 to 2015 (e.g., Toomey et al., 2014; Sumy et al., 2015) and installed a long-term cabled observatory with the Ocean Observatories Initiative offshore the CSZ, just to name a couple of monitoring efforts. However, the ShakeAlert earthquake early warning system for the west coast of the United States has not yet fully incorporated seafloor-based measurements into its workflow for the CSZ.
In addition, the regional cabled arrays in Japan (DONET and S-net) and Canada (NEPTUNE and VENUS) tend to be located near the countries’ coastlines where the ends of the cables are coupled with landing stations for power and data transmission purposes, which restricts their global utility in the open ocean. To combat the issues around power and data connectivity, the Joint Task Force on Science Monitoring And Reliable Telecommunications (SMART) is working to integrate environmental sensors for ocean bottom temperature, pressure, and seismic acceleration into submarine telecommunications cables (e.g., Howe et al., 2019). The increased number of globally distributed stations will provide valuable earthquake data that will lead to more reliable and accurate tsunami warning systems, as well as provide information that will greatly enhance details of three-dimensional global structure from Earth’s outer surface all the way to its inner core.
ACKNOWLEDGMENTS