Full Text
Dissolved oxygen (DO) is essential for the survival of most aquatic organisms. Hypoxia, defined as a DO concentration of less than 2 mg L–1, is a significant issue for ecosystems in estuaries and coastal waters and is one of the top themes of the United Nations Decade of Ocean Science for Sustainable Development (2021–2030). An area off the Yangtze River Estuary (YRE), China, annually develops one of the world ocean’s largest hypoxic areas. Observations collected by ship since 1999, and by long-term sensors since 2009, show that DO concentration in this region has been both declining and greatly fluctuating.
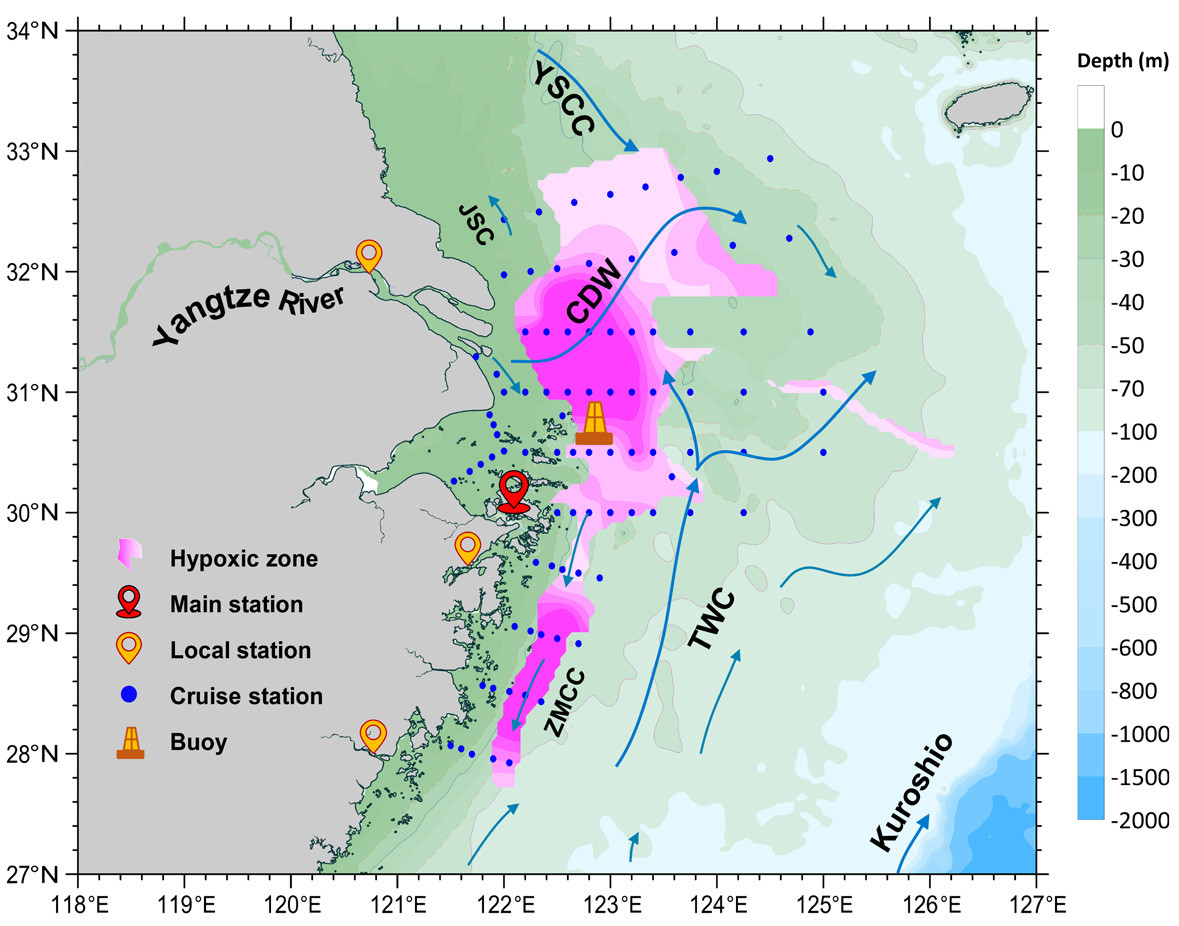
The best marine fishing grounds in China are located in the YRE. Prior to 2009, no continuous observations of hypoxia were collected off the YRE because fishing trawls routinely tear up instruments placed on and above the seafloor. Since 2009, we have experimented with placing sensors in a trawl-resistant bottom mount (TRBM) designed to work in this region of heavy sedimentation and energetic tides, along with a buoy to monitor hypoxia structure and processes. In 2019, our hypoxia observatory was upgraded to an integrated marine field station of the Ministry of Natural Resources in China, the Observation and Research Station of Yangtze River Delta Marine Ecosystems (MORSE; Figure 1), in which numerical modeling based on the Regional Ocean Modeling Systems (ROMS) coupled with the Carbon, Silicate, and Nitrogen Ecosystem (CoSiNE) model is integrated into the observation network.
|
|
TRBM
To enable collection of long-term observations, we modified DeepWater Buoyancy AL200 TRBMs for use in the YRE region (Figure 2). First, we moved the acoustic releases and sensors to the upper half of the buoyant pod to reduce the risk of sediment burial, although that slightly weakens the anti-trawling performance. Second, we added a time-release function to the acoustic releases to improve the chance of recovery if the TRBM is buried. Third, we designed a barb device that springs out of the buoyant pod after release, increasing the chance of the TRBM being dragged out of sediment by a fishing trawler should it become buried, thus reducing the probability of loss.
|
|
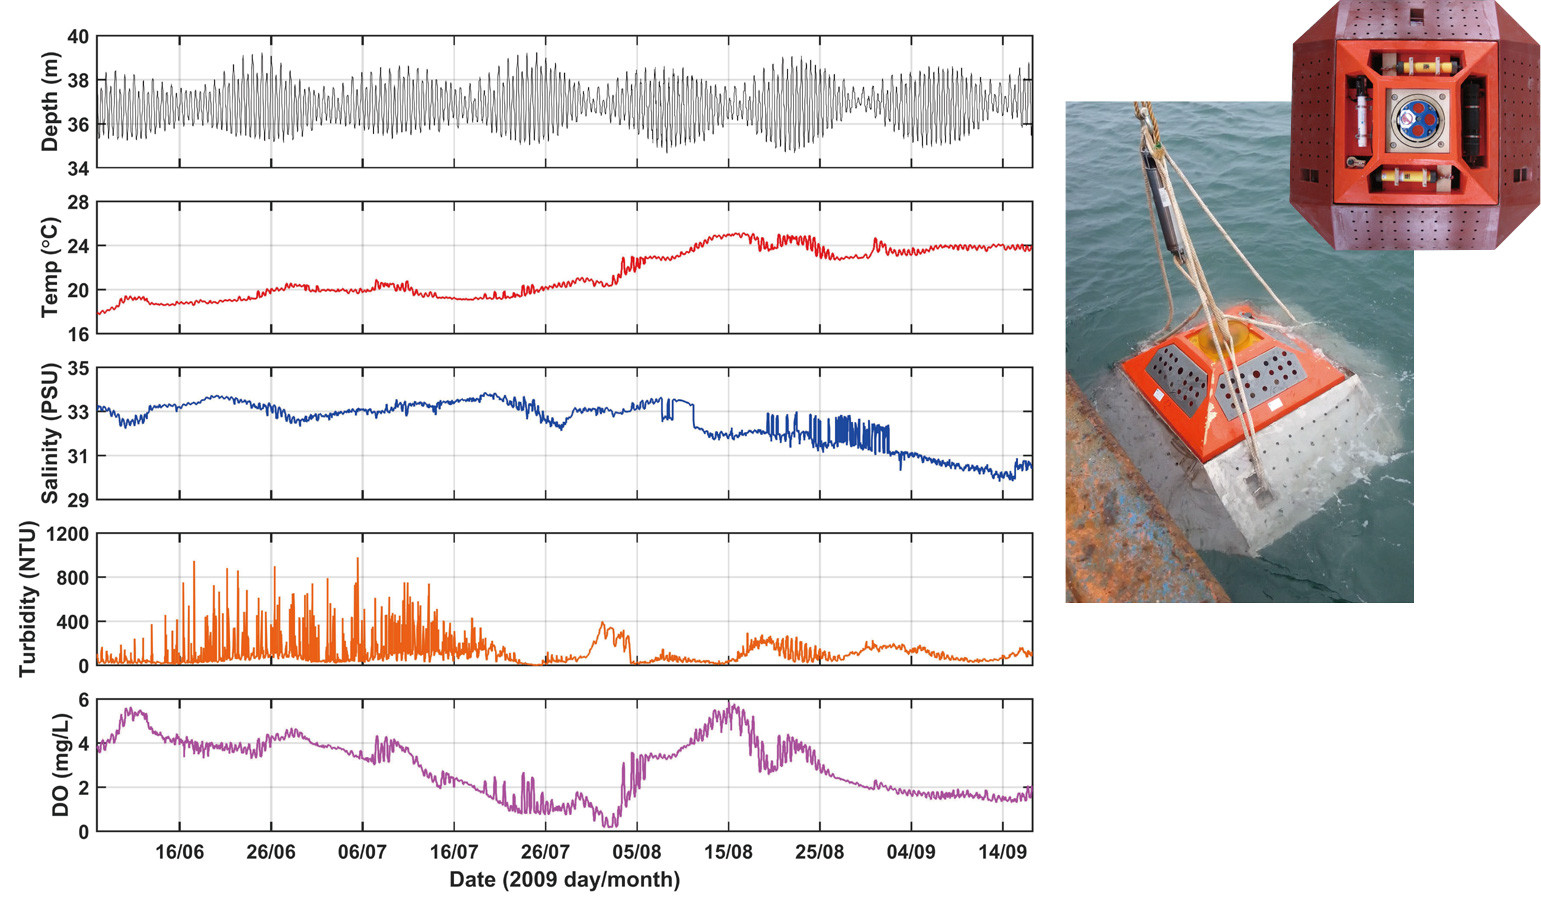
Since 2009, our TRBM has been deployed more than 20 times to acquire continuous DO, temperature, salinity, turbidity, and depth information in the hypoxic area off the YRE. From the 104-day time series data for bottom DO collected by the TRBM in 2009, summer formation, maintenance, and disappearance of hypoxia off the YRE is evident for the first time (Figure 2; Ni et al., 2016). We found this hypoxia to be severe, sometimes close to anoxic conditions, during summer. The turbidity data suggest that hypoxic conditions were more likely to appear or were enhanced after passage of a typhoon.
Buoy
Ocean stratification and high biological productivity are essential factors for hypoxia formation. Hypoxia generally occurs at the sea bottom, while the pycnocline and photosynthesis are located in the upper ocean. To understand the mechanism of hypoxia formation, we developed a real-time buoy system to observe the entire water column.
A surface buoy, moored to the seafloor, supports instruments that monitor temperature, salinity, DO, turbidity, chlorophyll a, nutrients, and current in four layers: the surface layer and three layers within the pycnocline (Figure 3). A TRBM acquires the same data types at the seafloor. Coupled inductive and acoustic communication technologies are used to transmit the underwater data to the surface buoy, and then the surface buoy data logger sends all the data to the shore station via satellite and cellphone.
|
|
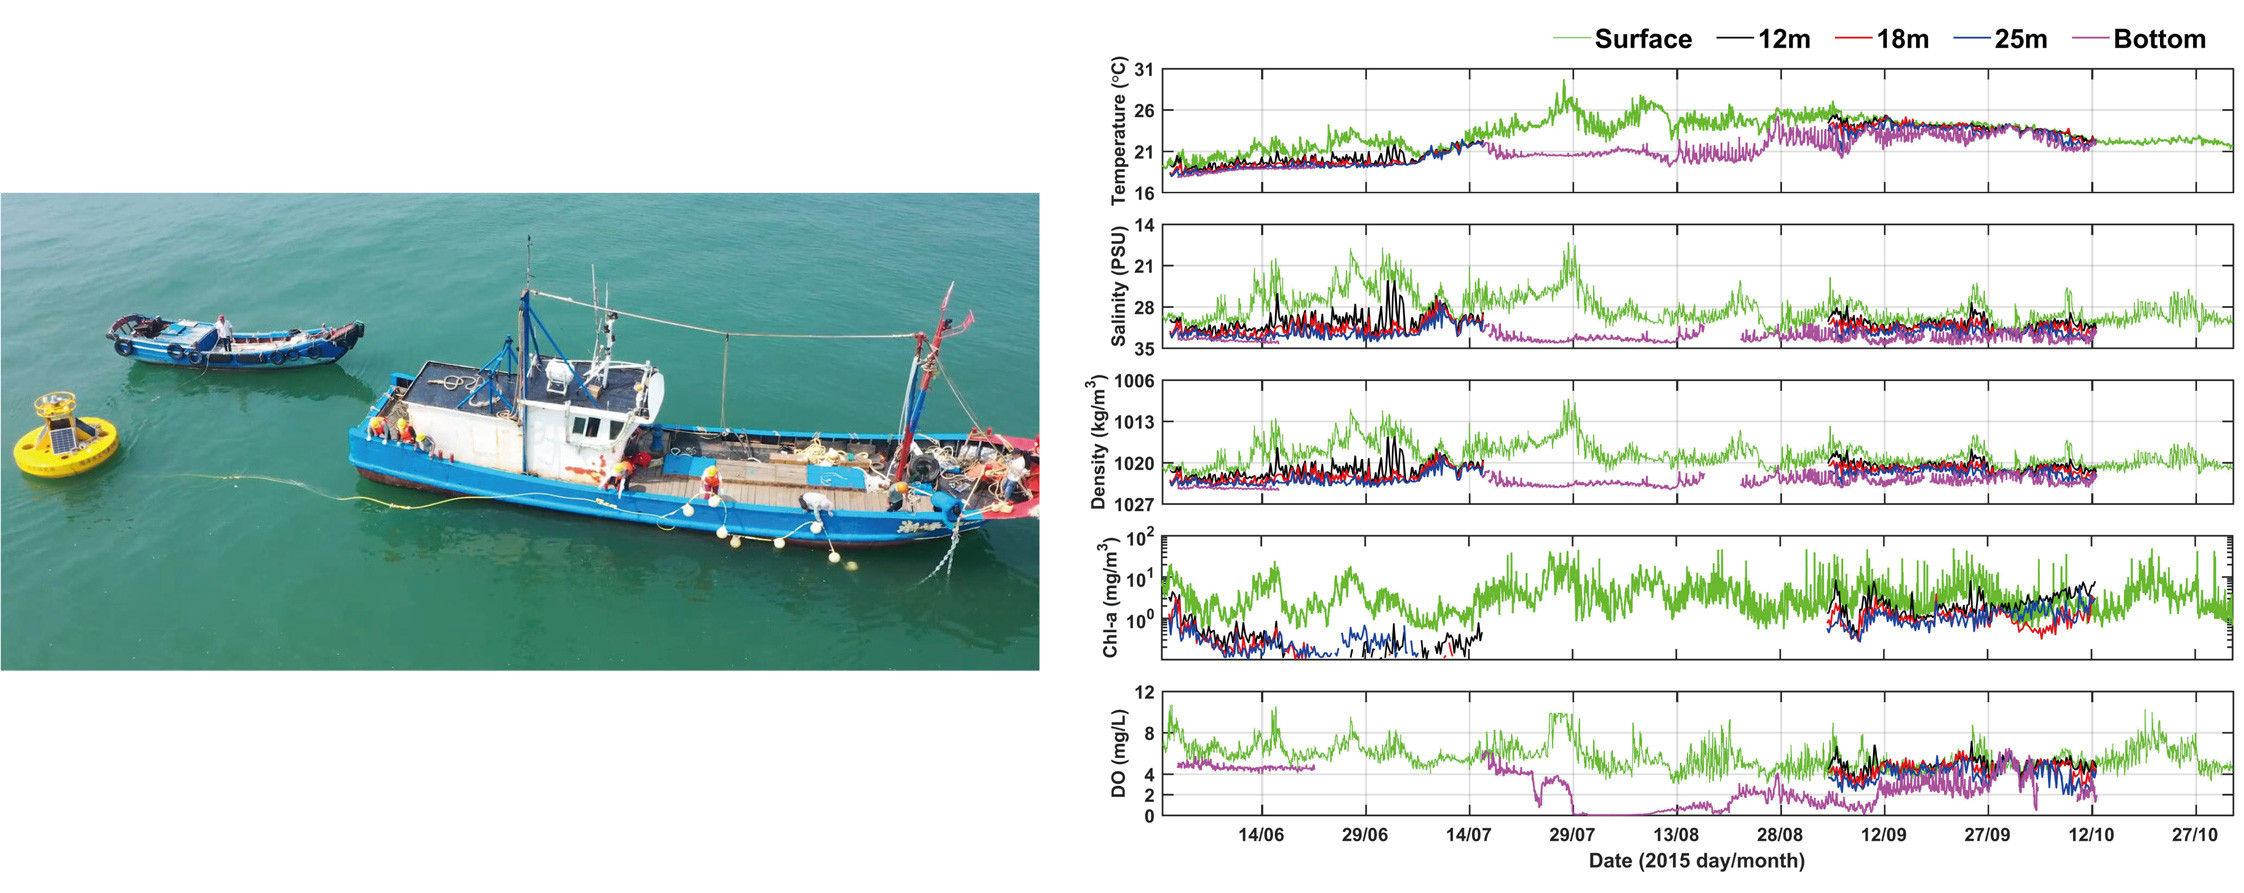
Our buoy system has monitored hypoxia in the YRE area for more than 12 successive summers. Sensors in the TRBM have provided information while hypoxic conditions were developing, while they were sustained, and while they were dispersing. The data collected by the buoy sensors provided information about the thickness of the hypoxic layer. After nutrient sensors were added to the surface buoy in 2013, the steps toward hypoxia formation in the YRE were revealed, from eutrophication to algal blooms to hypoxia.
Hypoxia Simulation and Prediction
Due to complex circulation and mixing, DO off the YRE exhibits a highly variable, three-dimensional structure, which may not be well resolved by data from the one deployed buoy system combined with ship survey data collected in summer and/or fall (blue dots in Figure 1). A physical-biogeochemical model was run by customizing ROMS and coupling it with CoSiNE (Zhou et al., 2017). We used MORSE data (including time-series data) to improve parameterization of both physical and biological processes. Since 2020, the model has contributed to the National Marine Environmental Forecasting Center of China’s experimental forecasts (up to 120 hours) for nutrients, DO, chlorophyll a, currents, salinity, and temperature off the YRE.
Outlook
Although usually a seasonal phenomenon at the seabed, coastal hypoxia is characterized by variability at multiple temporal and spatial scales. Physical-biogeochemical models need additional observational data to support hypoxia prediction and operational application off the YRE. New observing methods soon to be implemented include a benthic chamber and uncrewed survey vessels that will measure oxygen consumption in the sediment and automatically survey the entire hypoxic area within one or two days.