Introduction
Near-inertial waves (NIWs) are internal waves with frequencies close to the inertial frequency f = 2Ω sin Θ, where Ω is Earth’s angular velocity and Θ is latitude. They are widely acknowledged to dominate internal wave kinetic energy and shear spectra in the ocean (Alford and Whitmont, 2007; Silverthorne and Toole, 2009). Due to their strong vertical shear, NIWs can facilitate shear instabilities and vertical mixing (see Alford et al., 2016). It is thought that energy transported to the deep by downward-propagating NIWs contributes substantially to supplying the energy required for maintaining the abyssal stratification and the meridional overturning circulation (Wunsch and Ferrari, 2004).
In the mid and high latitudes, NIWs are primarily driven by the passage of atmospheric fronts, while at the low latitudes tropical cyclones can contribute significantly to their generation (e.g., Sanford et al., 2011; Johnston et al., 2021; Brizuela et al., 2023b). Atmospheric fronts in the mid-latitudes are associated with storms hundreds of kilometers in length, in contrast to the smaller-scale structures of tropical cyclones. The different scale winds imply that NIWs generated by tropical cyclones propagate more rapidly than NIWs driven by mid-latitude storms, because NIWs with smaller lateral scales have faster group velocities (Gill, 1984). Having said this, other factors besides the spatial footprint of the winds affect the lateral scales of NIWs. In particular, the interaction of NIWs with mesoscales eddies can significantly modify the structures of NIWs and enhance their propagation through a process known as ζ-refraction (Asselin and Young, 2020).
The enhancement of NIW propagation by eddies has been well documented for NIWs in the mid-latitudes (see Thomas et al., 2024, in this issue for a discussion) but this is less true for NIWs driven by tropical cyclones. There are a few notable exceptions to this in the literature. Johnston et al. (2021) observed the enhancement of NIW propagation out of a cyclonic filament associated with the cold wake that was formed by a tropical cyclone that produced the NIWs themselves. In contrast, Essink et al. (2022) saw evidence of elevated propagation of tropical-cyclone-driven NIWs in a pre-existing mesoscale eddy field associated with the Kuroshio. In this article, we report another observational example from the Philippine Sea of NIWs that were excited by a typhoon and radiated into an anticyclone.
The observations were made as part of the ARCTERX (Island Arc Turbulent Eddy Regional Exchange) Departmental Research Initiative (DRI) funded by the US Office of Naval Research (ONR). The overarching goals of the ARCTERX DRI are to characterize the strength and properties of the turbulent cascade of kinetic energy in the Philippine Sea and to understand the processes that control energy transfers across scales and their seasonal variability. The Philippine Sea is an ideal location for studying energy cascades because it has a strong mesoscale eddy field with a pronounced seasonal cycle in eddy kinetic energy that appears to be influenced by mechanisms that transfer energy between mesoscale eddies and smaller-scale process (Qiu et al., 2014). One such mechanism is NIW-eddy interactions (Polzin, 2010; Xie and Vanneste, 2015; Jing et al., 2018; Rocha et al., 2018; Cusack et al., 2020; Barkan et al., 2024). Under certain conditions, NIWs can extract energy from mesoscale eddies, and it has been speculated that they could play a significant role in the kinetic energy budget of the global circulation (Xie and Vanneste, 2015). In fact, in the Philippine Sea, the time of year when eddy kinetic energy decreases coincides with the typhoon season, suggesting that NIW-eddy interactions might play a role in the seasonal demise of mesoscale eddies. In this article, we study NIW-eddy interactions in the Philippine Sea using observations from the ARCTERX field campaign conducted in late spring 2023 along with an idealized numerical simulation. Our focus is on characterizing the structure and evolution of NIWs observed within an anticyclonic system and assessing their impact on mesoscale kinetic energy during this late-spring period.
Field Experiment and the Target Eddy
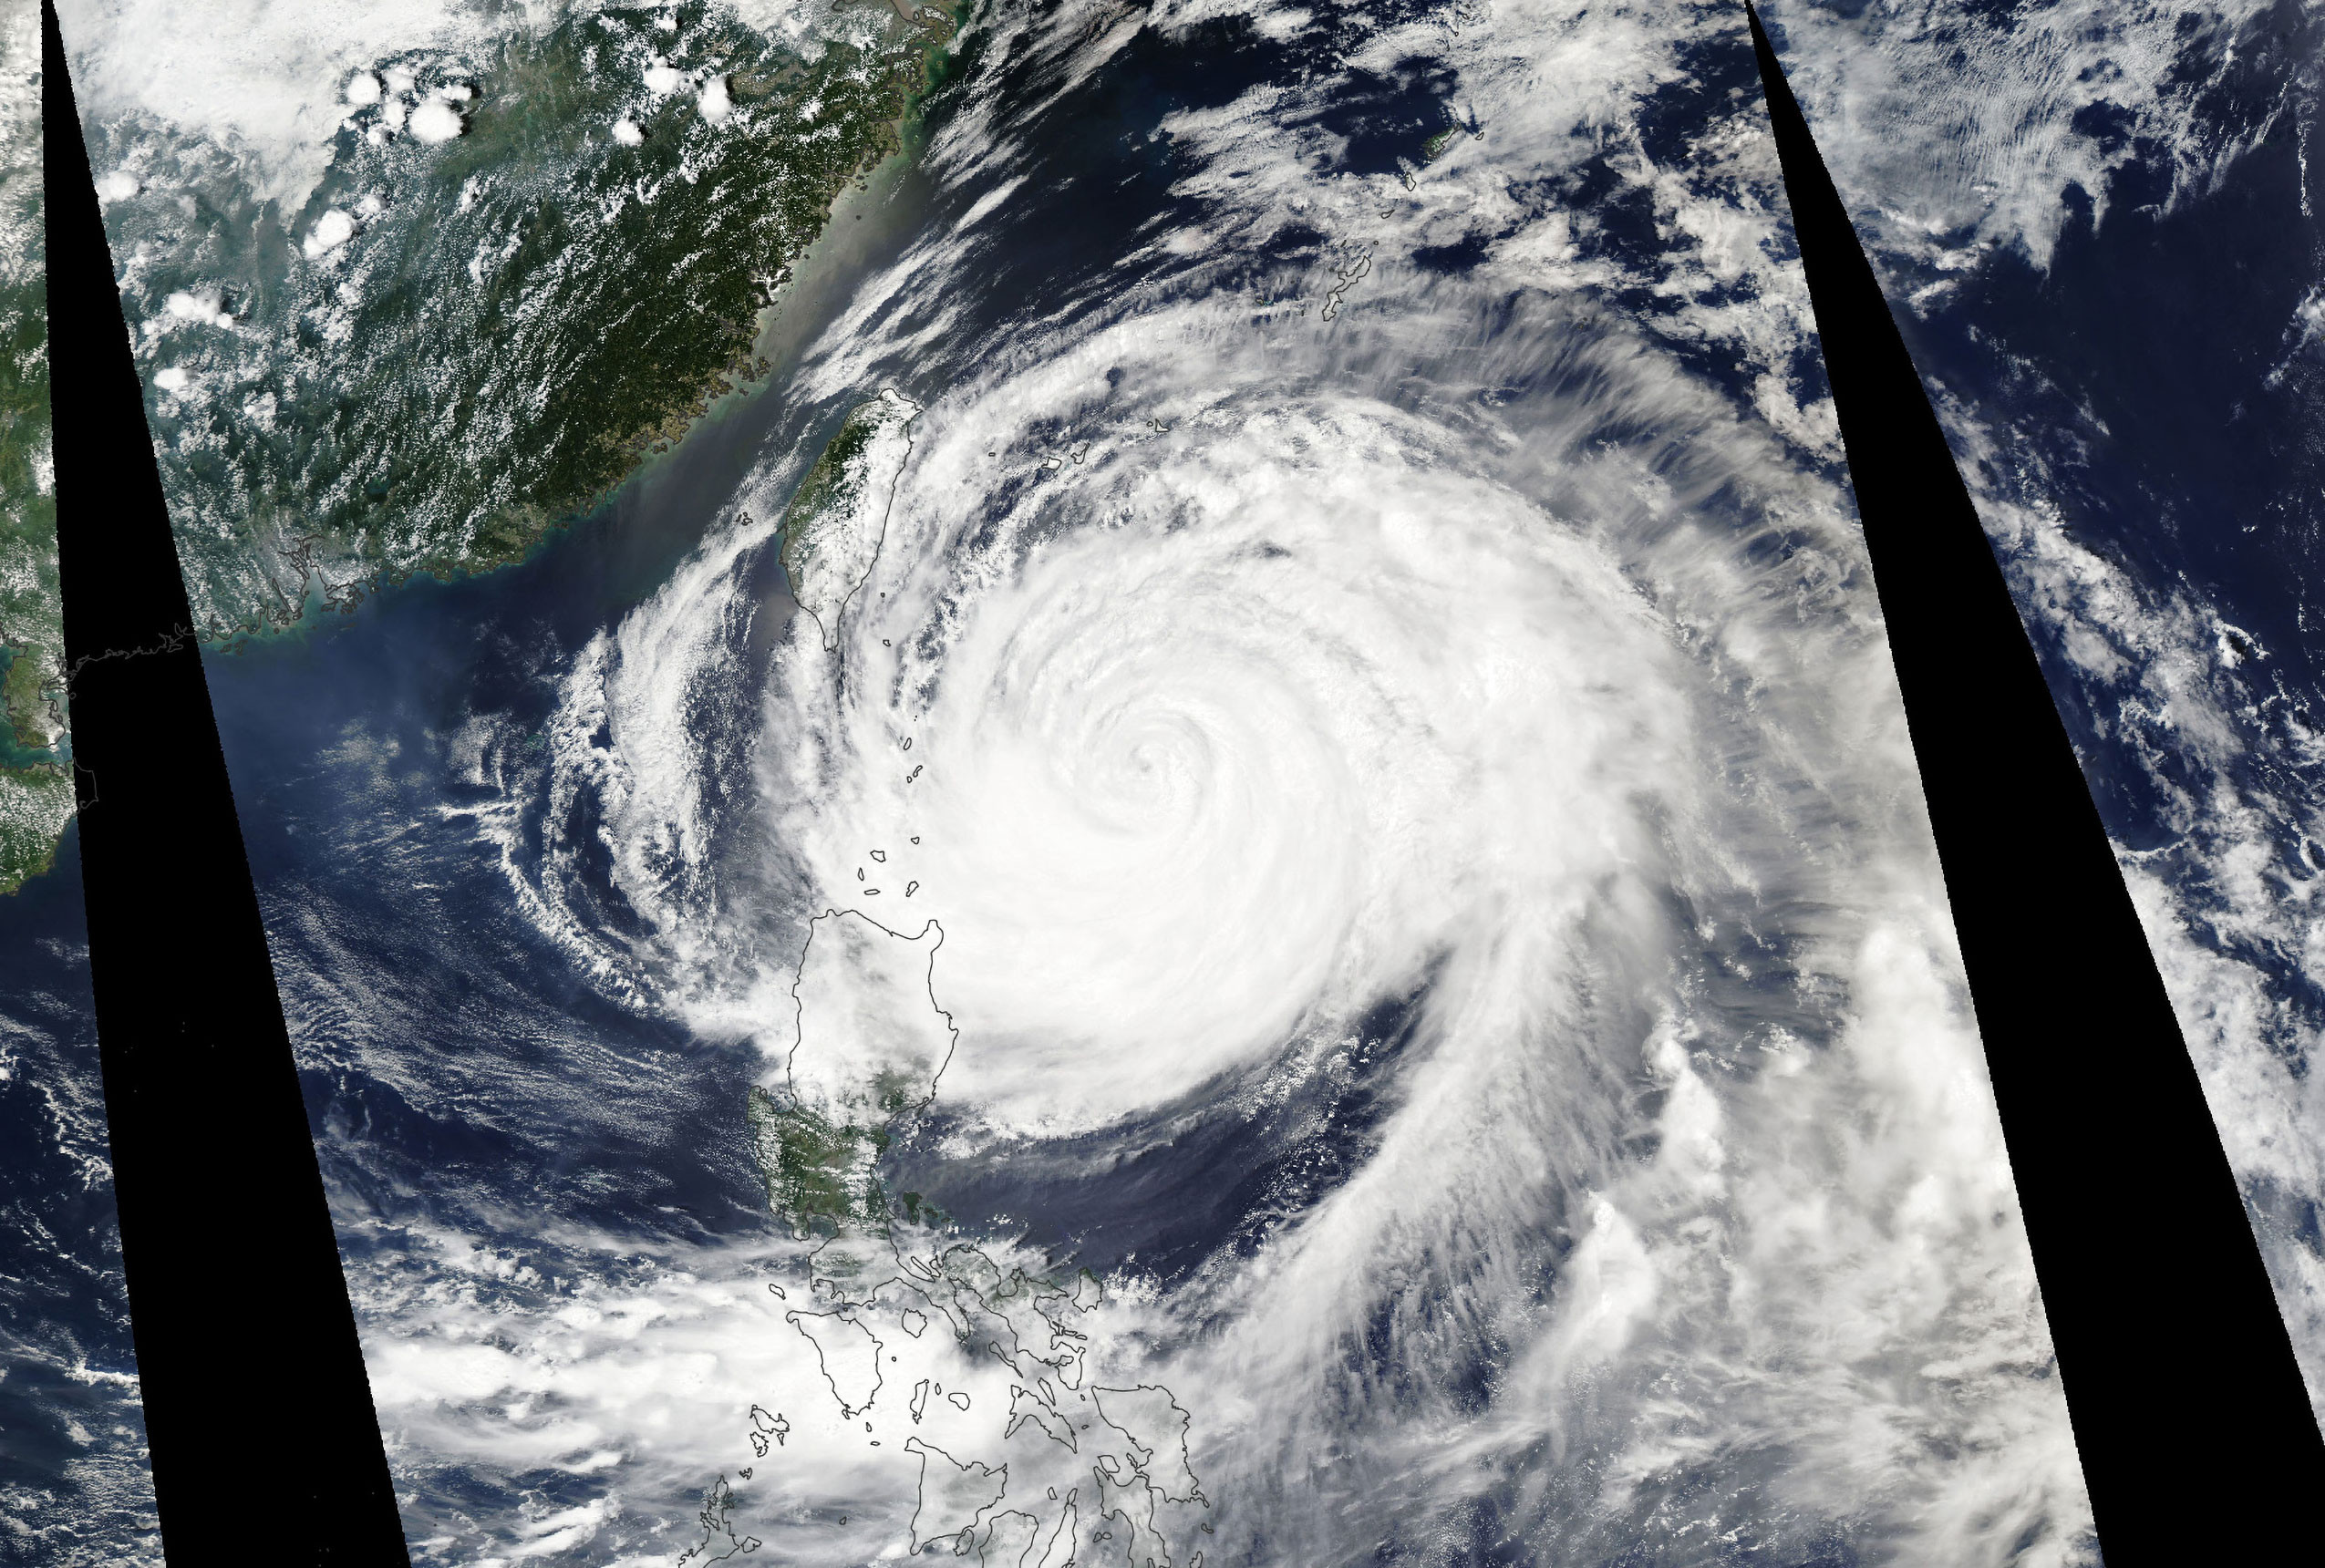
In May–June 2023, a collaborative field campaign, spanning multiple institutions and supported by ONR, was conducted aboard R/V Thomas G. Thompson to investigate the processes that drive energy transfers across scales in the dynamic environment of the Philippine Sea. Observations were collected from an array of instruments, including both autonomous and non-autonomous (shipboard) profiling instruments, as well as surface drifters. The expedition focused on sampling an anticyclonic eddy with a radius of approximately 150 km that was hit by Super Typhoon Mawar. The typhoon originated from an area of low pressure around 5°N and 149°E that developed into a tropical depression on May 20 (Wada, 2023). It intensified significantly, reaching category 5 and accelerating in the region near the target eddy (see the full typhoon track in online supplementary Figure S1). On May 26, Super Typhoon Mawar headed in a west-northwest direction, skirting about 300 km to the south of the targeted eddy. At this point, it reached its peak translational speed of 8.7 m s–1 before shifting northward after May 28 (Figure 1a). This characterizes it as a fast-moving typhoon, with an ocean response dominated by NIWs due to the relationship between its speed and the local group velocity of the first baroclinic mode (Geisler, 1970; Nilsson, 1995; Brizuela et al., 2023b)
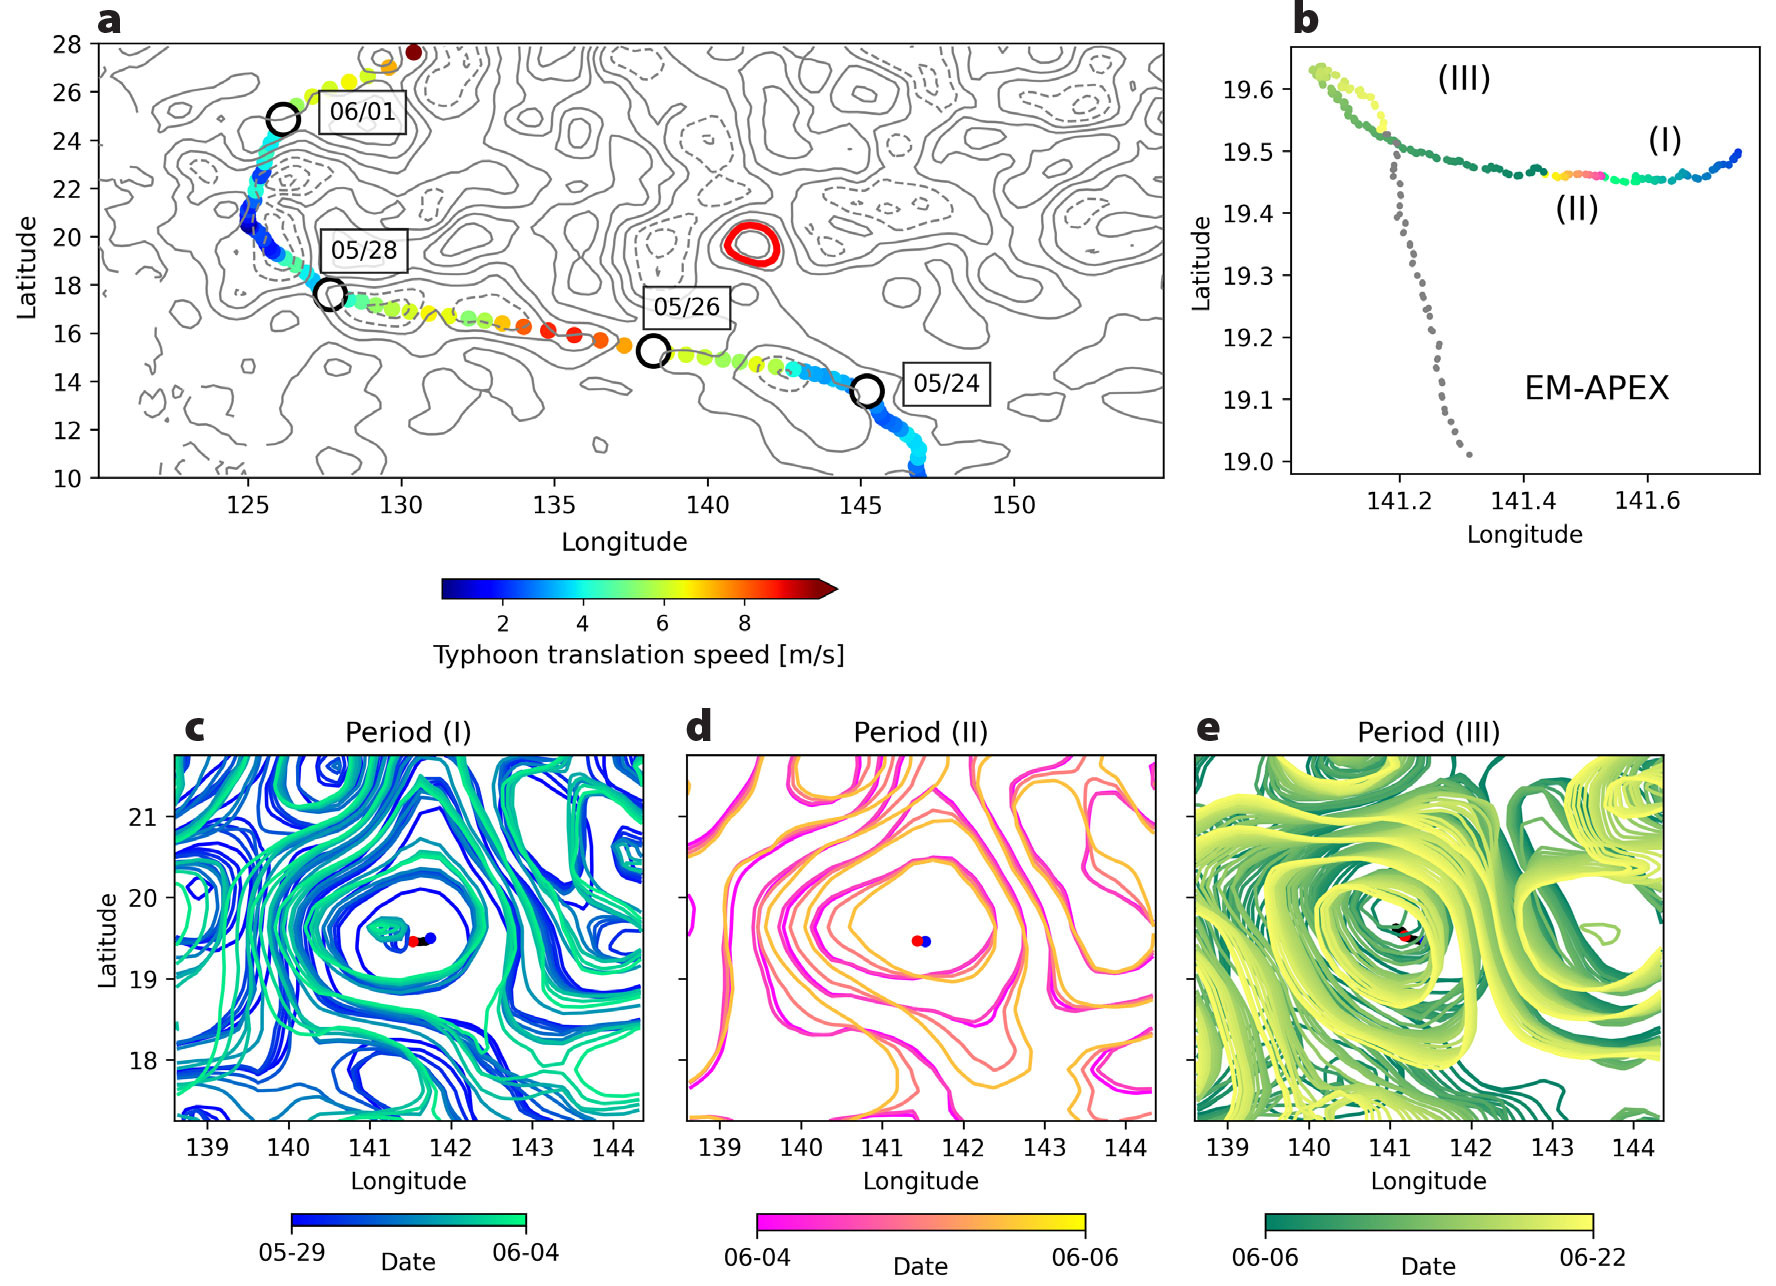
FIGURE 1. Overview of sea surface height (SSH) anomaly evolution during the passage of a fast-moving typhoon. (a) Contour map of the SSH anomaly for June 2, 2023, with solid (dashed) contours representing positive (negative) SSH anomaly values, and a bold red contour highlighting the location of the analyzed eddy. Colored dots indicate the typhoon track (Gahtan et al., 2024), with color representing its translation speed. The dates for selected points along the typhoon track are also shown. (b) EM-APEX float trajectory deployed at the center of the analyzed eddy on May 29, 2023. Portions of the trajectory are color-coded to correspond with the SSH time evolution depicted in panels (c, Period I), (d, Period II), and (e, Period III). Gray dots represent the trajectory segments after June 22. (c–e) Time series of SSH contours highlighting the evolution of the surface eddy structure during the indicated periods. The blue-black-red dots in the central portion of the eddy indicate the initial, final, and intermediate locations of the EM-APEX float for each period. > High res figure
|
The passage of a typhoon near the ARCTERX target eddy presented a prime opportunity to examine the interaction between a mesoscale eddy and storm-induced inertial oscillations, leading to the generation of near-inertial waves (NIWs). This event also allowed us to observe a downward-propagating NIW within an anticyclonic mesoscale eddy.
Eddy Sampling
Here, we provide an initial overview of these observations to contextualize the observed phenomena and establish the initial condition for an idealized model simulation (see later section on Idealized Simulation of Observed Anticyclone Forced by Reanalysis Winds).
Initial sampling focused on characterizing the large-scale temperature, salinity, and velocity structures of the eddy. Continuous sampling of the upper ~250 m of the water column between its southern and northern boundaries using an RBR Concerto CTD revealed shallowing isopycnals toward the eddy’s periphery. Subsequent west-to-east sampling utilized a Rockland Scientific VMP250IR equipped with a JFE Advantech Co. (JAC) CTD, two FP07 micro-temperature sensors, and two velocity shear probes recording at 512 Hz. The rate of turbulent kinetic energy dissipation, ε, was calculated from observed velocity shear variance as  , where ν is the viscosity of seawater. Shear profiles were split into 1,024-point windows, and integrated variance was computed by spectral integration over the inertial subrange after removing coherent instrument vibrations (Goodman et al., 2006; Lueck, 2016). After conducting continuous profiling across the anticyclonic eddy from south to north and from west to east, we collected a CTD and Niskin bottle transect across the eddy while deploying drifters, profiling floats, and gliders. For this study, we will focus on data from the EM-APEX float (Figure 2e; Sanford et al., 2007), a vertically profiling float that measures profiles of CTD and horizontal water velocity from motional induction (Sanford, 1971; Szuts, 2012). In addition to the first VMP section mentioned, we conducted several additional profiling sections while transiting through the anticyclonic eddy. This study focuses on the analysis of just one section (Figure 2a,c).
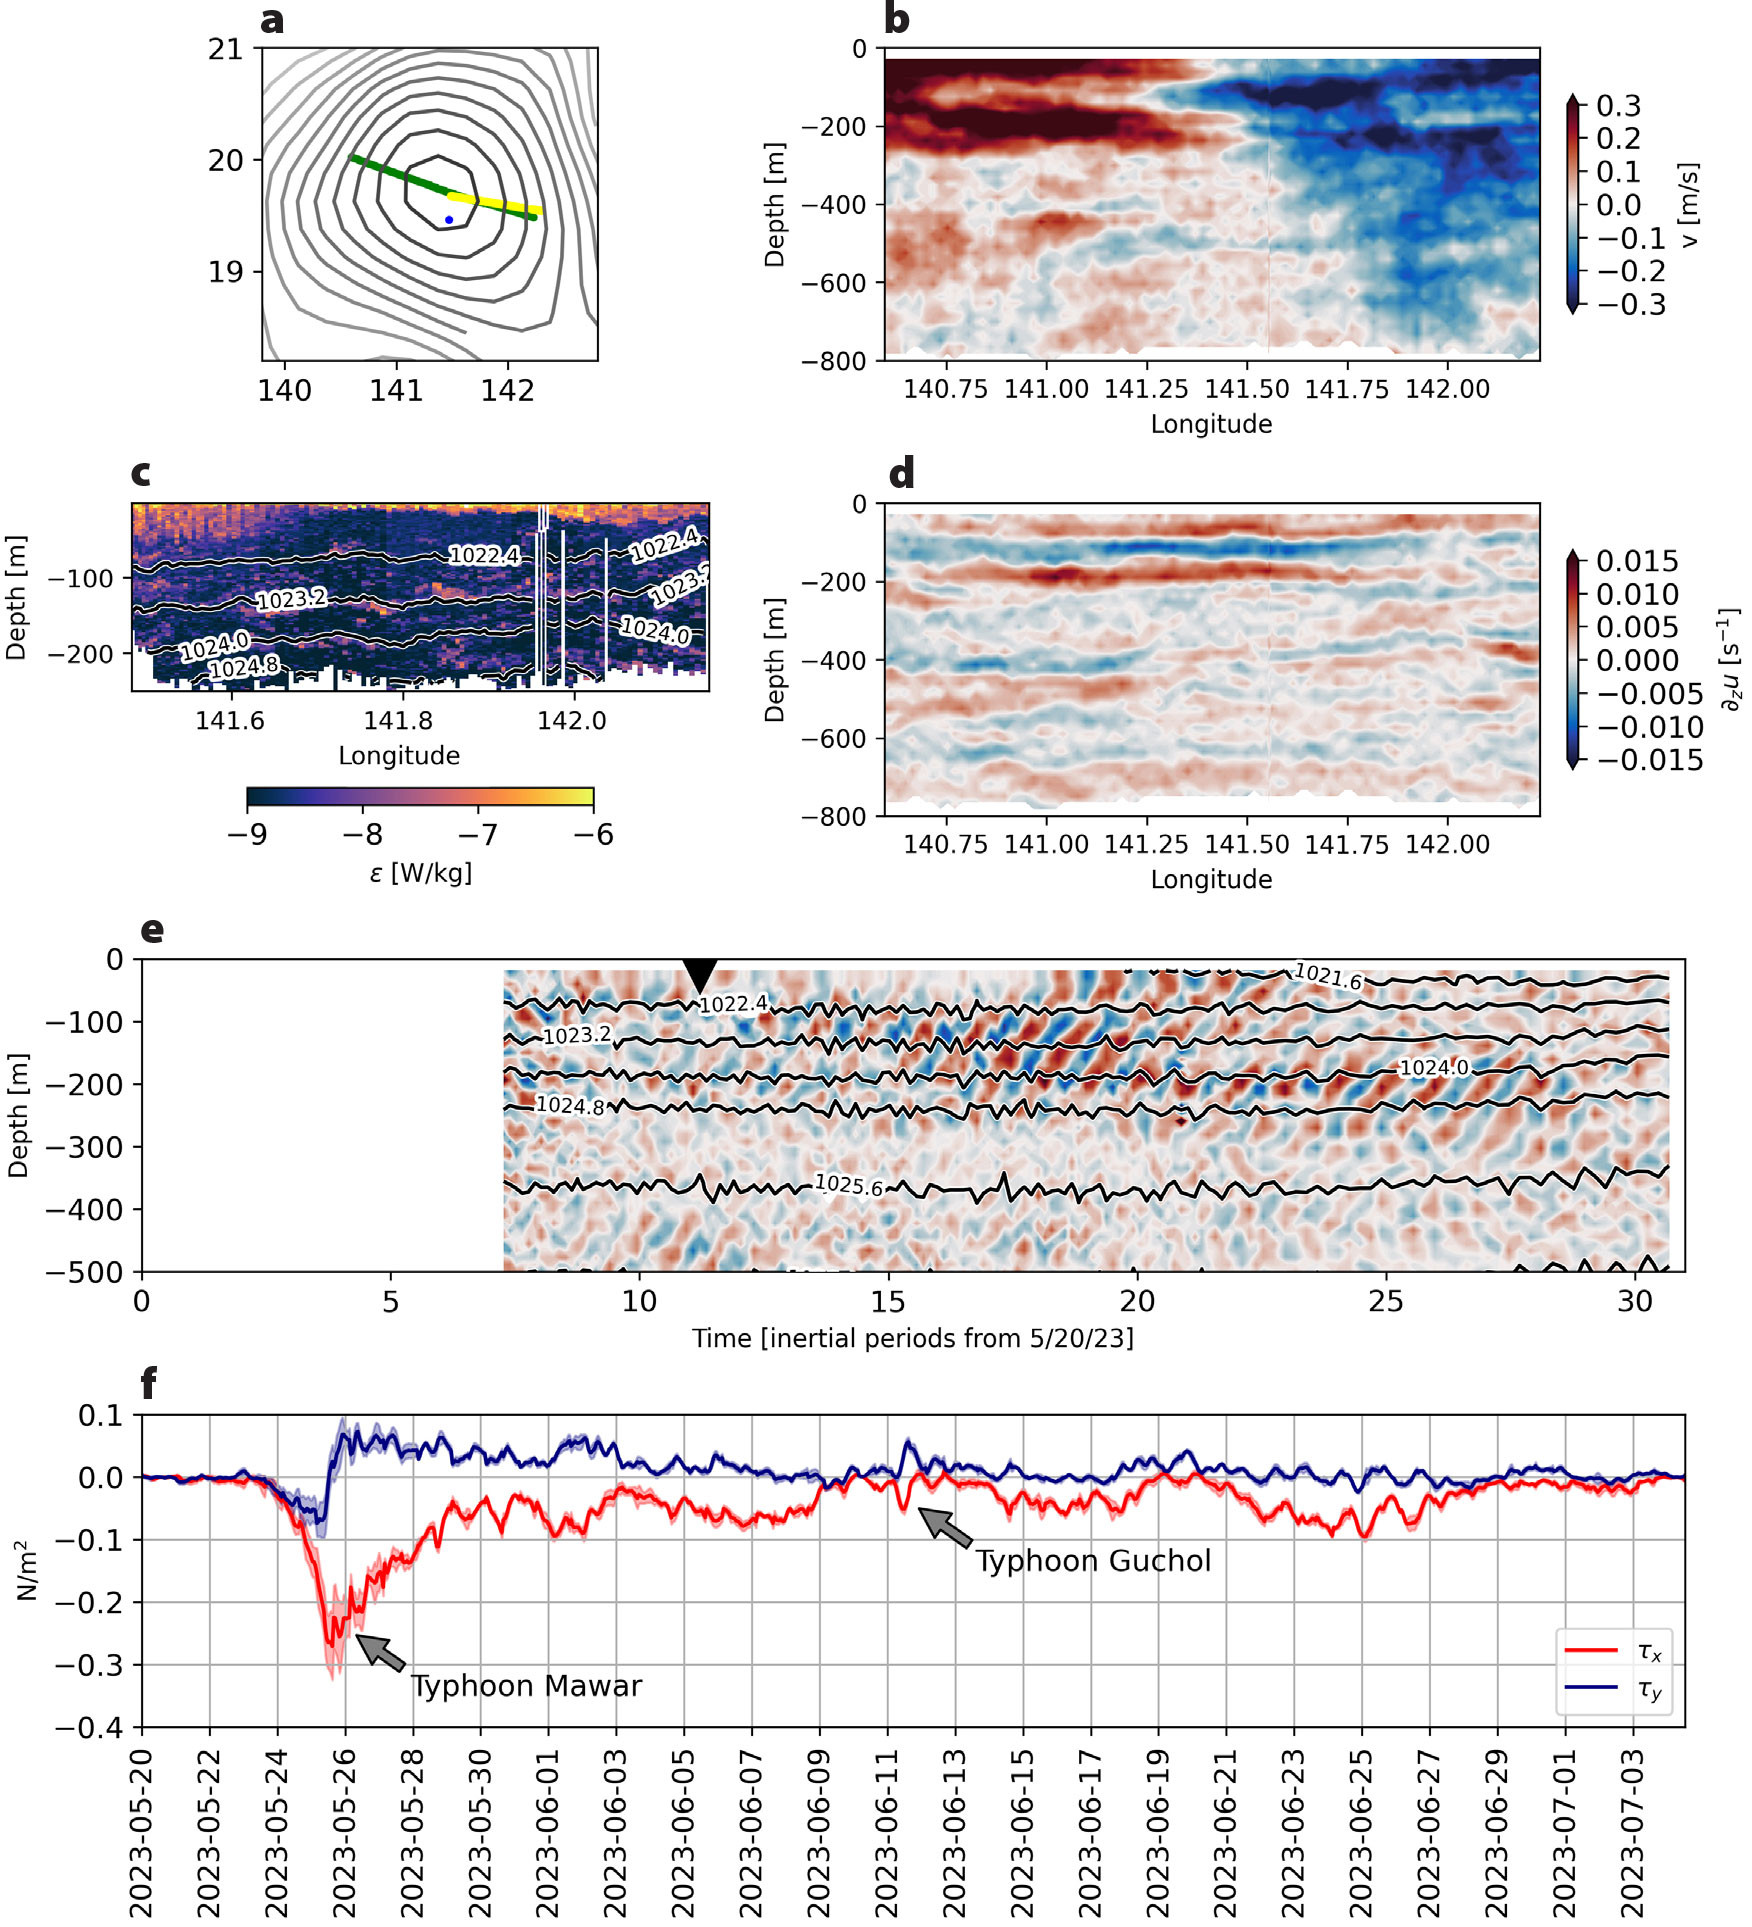
FIGURE 2. (a) Mean SSH contours on June 6, 2023, during the acoustic Doppler current profiler (ADCP) section crossing the eddy center (green track). The blue dot marks the EM-APEX float location on the same day, while the yellow line shows the VMP section from June 7. (b) The zonal velocity measured by the ADCP. (c) Turbulent energy dissipation (ε) with isopycnal contours. (d) Vertical shear calculated from panel (b)’s velocity data. (e) A time series in inertial periods of vertical shear of the zonal velocity component from the EM-APEX float, starting on May 20, 2023, with black contours representing isopycnals and an inverted triangle marking the ADCP section date. (f) The zonal (red) and meridional (blue) wind stress components, with shaded areas representing standard deviations. Arrows indicate the two typhoons passing near the eddy. > High res figure
|
A total of seven CTD stations were conducted along the east-west axis of the eddy using the ship’s rosette, which was equipped with a Sea-Bird Scientific SBE911 CTD. This CTD section was used to calculate the initial conditions for the idealized model and the stratification used in an analysis of vertical modes, which are discussed in the next two sections, respectively. At each station, multiple casts (1,000 m depth) were performed to collect water samples (not discussed) and one deep profile (4,600 m) was performed to characterize the temperature and salinity structure throughout the water column. Two stations were made outside the eddy—one to the east and the other to the west of the anticyclonic eddy—to characterize the surrounding water properties. Throughout the campaign, we used two vessel-mounted acoustic Doppler current profilers (VM-ADCP Teledyne RDI Ocean Surveyor 75 kHz and Workhorse 300 kHz) that provided velocity measurements through the upper 900 m.
Evolution of the Mesoscale Eddy
The identification and evolution of the anticyclonic eddy in both space and time were examined using satellite sea surface height (SSH) data, from which we derived estimates for the geostrophic velocity (ug, vg). Eddy detection was performed by a combination of SSH, geostrophic relative vorticity (ζg = ∂xvg − ∂yug), and the Okubo-Weiss parameter

where sn = ∂xug− ∂yvg and ss = ∂xvg + ∂yug represent the normal and shear components of strain, respectively.
The center of the anticyclonic eddy was identified by the maximum values of SSH and anticyclonic geostrophic relative vorticity, approximately 0.2 m and O(−10−5)s−1, respectively. The extent of the eddy was defined by the location where the Okubo-Weiss parameter was equal to −1 × 10⁻¹⁰ s−2, which encompasses regions where vorticity dominates over strain, and in locations where the vorticity was negative. Numerous eddies of both cyclonic and anticyclonic polarity, also characterized by W < −1 × 10⁻¹⁰ s−2, are observed surrounding the anticyclonic eddy (Figure 1). The vorticity and strain of these surrounding eddies impede the westward propagation of the anticyclonic eddy through the β effect, resulting in more complex dynamics than those described by a simple β drift. This spatial complexity is further amplified by the influence of the fast-moving typhoon. From consecutive SSH fields, we assessed the horizontal displacement of the target eddy and tracked the relative position of the float’s trajectory, which was launched at the eddy’s center (Figure 1b–e). Initially, after the launch of the EM-APEX float, the eddy propagated northwestward (Figure 1c), then shifted eastward (Figure 1d), and then moved southwestward (Figure 1e). Similar to the target eddy, neighboring features followed this displacement pattern. In contrast, the float’s trajectory did not exhibit the same pattern but rather escaped from the eddy’s center weeks after its launch. In contrast, the float’s trajectory did not exhibit the same pattern, but rather escaped from the eddy’s center weeks after its launch.
Observational Evidence of NIW Trapping in the Anticyclone
Here, we focus on the observational evidence of trapped NIWs within the targeted eddy and examine their potential role in generating turbulence. In traversing the eddy through its center and profiling the velocity field with a VM-ADCP (Figure 2a–d), we observed the signatures of a baroclinic anticyclone and strong vertical shear layers in the upper 300 m of the water column. The vertical shear was strongest in the center of the eddy, suggestive of a trapped NIW interacting with the mesoscale eddy. The depth range of higher vertical shear coincides with a layer of enhanced turbulent dissipation along the 1,023.2 kg m–3 isopycnal (Figure 2c), which suggests the NIWs might drive turbulence (see Thomas and Zhai, 2022). Velocity profiling from the ship did not cover a complete wave cycle. However, an EM-APEX float deployed near the center of the anticyclonic eddy (Figure 1c–e) provided data over multiple inertial periods, revealing a clear signal of a downward-propagating NIW packet with upward-propagating phase. This packet appears to be confined between 100 m and 300 m, coinciding with the maximum vertical shear measured by the ADCP (Figure 2d,e). The frequency of the NIWs is slightly sub-inertial, consistent with NIW trapping in an anticyclone. For example, at z = −100 m, only ~9.5 wave cycles are spanned between 10 and 20 inertial periods in the shear time series (Figure 2e), indicating a wave period that exceeds an inertial period.
The EM-APEX float was deployed on May 30, five days after the strongest wind pulse over the anticyclonic eddy triggered by Typhoon Mawar, represented here using a wind stress product from ECMWF reanalysis (Figure 2e,f; Hersbach et al., 2020). Subsequently, a downward-propagating NIW packet was identified through the observation of vertical shear layers exhibiting an upward phase velocity within the depth range of 100–300 m. The NIW temporal shear enhancement in this depth range is consistent with the hypothesis of NIW trapping by the anticyclonic eddy, and potential NIW breaking generating turbulence (Figure 2c). On June 14 (~17 inertial periods after May 20, 2023), a second wind-driven NIW packet was observed within the upper 100 m, characterized by vertical shear in the wave signal, as recorded in the time series data collected by the EM-APEX float (Figure 2e). This subsequent NIW packet is likely associated with the passage of a consecutive typhoon (Typhoon Guchol) through the region around June 12 (Figure 2f), which altered the wind field over the eddy location (see Figure S2). The generation of this second wave packet is briefly discussed in others sections of this article. However, due to the advection of the EM-APEX float to the outer periphery of the anticyclonic eddy (see Figure 1), the final stages of the second NIW packet were not fully sampled.
Wind-Driven Inertial Motions: Slab Mixed-Layer Model
We used a slab mixed layer to quantify the role of the local winds over the anticyclonic eddy in generating inertial motions without considering effects of the background flow. The model solves the following equations:
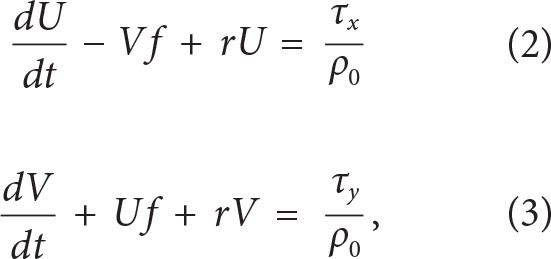
where U and V are the zonal and meridional components of the volume transport of the wind-driven flow in the boundary layer, r is a Rayleigh damping coefficient with a typical value of r = 0.1f (Plueddemann and Farrar, 2006), ρo = 1,000 kg m−3 is a reference density, and τx and τy are the zonal and meridional components of the wind stress (Figure 2f).
The slab mixed-layer model predicts that the strongest transport is associated with the passage of Typhoon Mawar and has contributions from both Ekman flow and inertial oscillations (Figure 3). The rate of kinetic energy input to inertial motions (i.e., the wind work)

where zmld, the climatological mixed-layer depth for the late spring in the Philippine Sea from the de Boyer Montégut climatology (de Boyer Montégut et al., 2004), is also maximal at this time (Figure 3). In addition, the wind stress driven by the passage of Typhoon Guchol on June 12 (~16 inertial periods, see Figure 2f) generates a second inertial wave packet but with weaker wind work (~16 inertial periods, Figure 3). Despite the large difference in intensity of the wind stress driven by the two consecutive typhoons, the clockwise-rotary, time-varying winds of Typhoon Guchol are effective at generating strong inertial oscillations. The findings from the slab mixed-layer model utilized in this study further support the hypothesis that the NIWs in the targeted mesoscale eddy were driven by the passage of typhoons. Specifically, the reanalysis winds integrated into this simplified model corroborate that the observed NIWs are linked to atmospheric events, such as these typhoons. Additionally, the negative relative vorticity of the mesoscale eddy prompts the question of whether the wave signal observed in our dataset is linked to a trapped NIW driven by the winds. To address this question, we conducted an idealized numerical experiment configured with a single anticyclone modeled after the observed eddy and forced by the reanalysis winds used in the slab-mixed-layer.

FIGURE 3. Results from a slab mixed-layer model. Time series in terms of inertial periods, starting from May 20, 2023, showing wind work (black), zonal transport (red), and meridional transport (blue) in the mixed layer, computed using a slab mixed-layer model. Shaded areas represent the standard deviations. Wind work represents the energy input from surface wind stress driving horizontal currents within the mixed layer. > High res figure
|
Idealized Simulation of an Observed Anticyclone Forced by Reanalysis Winds
Model Setup
The simulation used in this study is performed with the CROCO (Coastal and Regional Ocean Community) model (https://www.croco-ocean.org; Jullien et al., 2019). This model solves the primitive equations in terrain-following coordinates in the vertical and Cartesian coordinates in the horizontal, with a time-splitting method between the fast barotropic mode and the slow baroclinic modes. The simulation is initialized with an idealized flow consisting of a three-dimensional axisymmetric, stationary, and geostrophically balanced mesoscale eddy, mimicking the characteristics of the anticyclonic eddy on an f-plane (Θ = 19.5°N; Figure 4a).
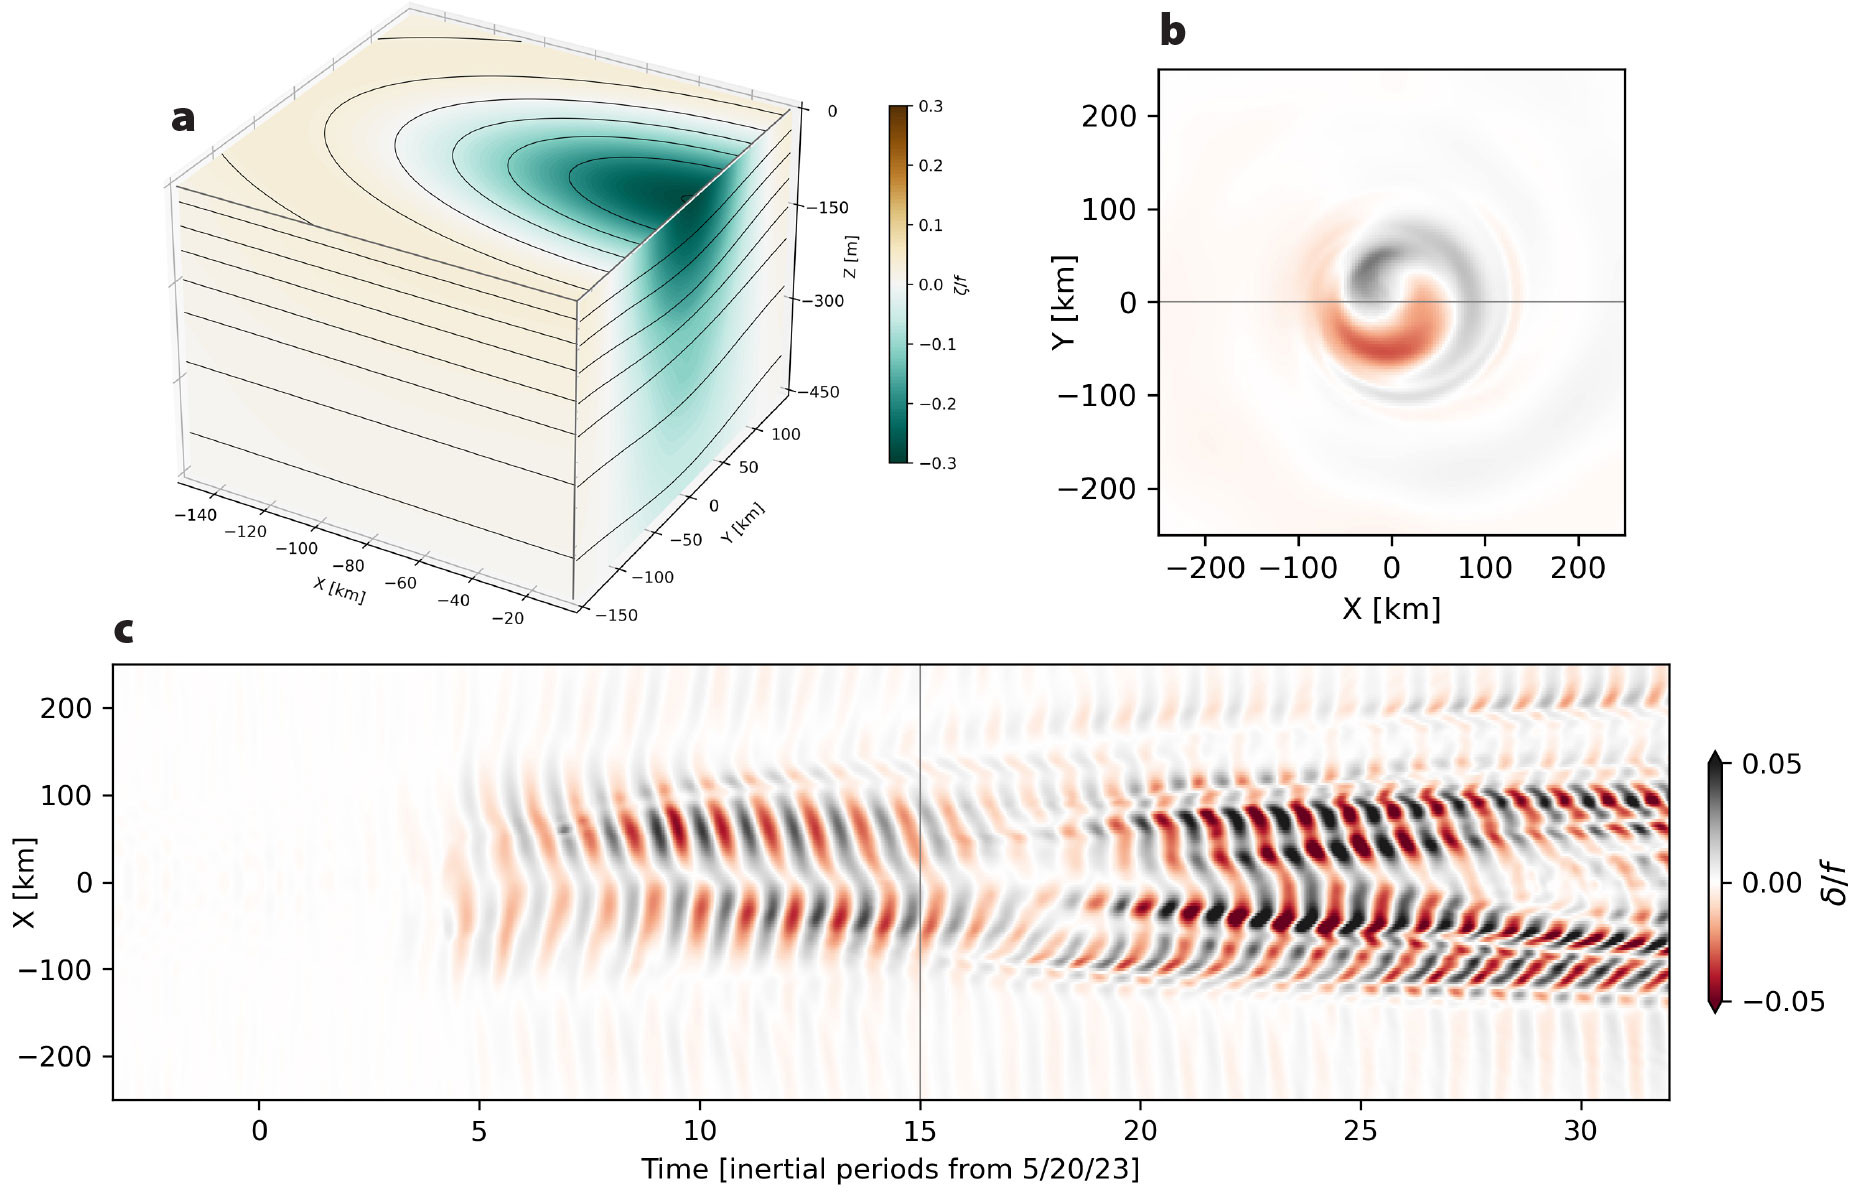
FIGURE 4. (a) The Rossby number (color) and the density field (contours) of the idealized, axisymmetric, geostrophically balanced version of the observed eddy used for the initial condition. The panel shows a cross section to emphasize the distribution of these quantities within the center of the eddy. (b) A snapshot of the divergence (δ) at the base of the mixed layer, scaled by planetary vorticity (f). The black horizontal line indicates the area (east-west) of the eddy shown in panel (c). (c) A Hovmöller diagram of the divergence scaled by planetary vorticity along the east-west axis of the eddy (see panel b). The black vertical line represents the time when the snapshot in panel (b) was taken. > High res figure
|
The eddy’s vertical and horizontal structures are based on density profiles from the shipboard CTD transect across the anticyclonic eddy. We calculate a reference density profile as the lateral average of density from profiles outside the eddy (ρref). From this we infer a lateral density anomaly (ρ'), and then fit a Gaussian function (Equation 6) to ρ' to represent an eddy similar to the anticyclonic eddy. At the mixed-layer depth, the lateral variation of ρ' is not well described by a Gaussian function. Instead, we fitted the data to a quadratic function specific to this depth. Assuming that the lower density anomaly delineates the lateral extent of the eddy, we estimated the eddy’s radius (R) by taking half the distance between the zero crossings of the quadratic function that accurately describes the lateral variation of ρ' at the base of the mixed layer. Utilizing the derived radius and the depth-dependent density amplitude (A(z))

we model the density field using a Gaussian

for all depths.
This process ensures that the minimum lateral density anomaly, ρ'min, in the center of the baroclinic anticyclone determines the amplitude of the Gaussian at each depth. The result is an axisymmetric eddy with a lateral density gradient and stratification representative of the observed eddy.
The sea level anomaly (η) is then estimated assuming that there are no lateral variations of dynamic pressure Φ

at the bottom of the numerical domain (g is the acceleration due to gravity).
We then mapped ρ and η to the model grid (500 × 500) with a horizontal spacing of 3 km and a vertical spacing ranging from 1.2 m to 590 m (40 vertical layers) that is enhanced near the surface. The initial velocity field was calculated using the geostrophic balance. The resulting velocity and density fields are representative of the observed mesoscale eddy and yield realistic stratification and vorticity fields (Figure 4a).
We implemented double-periodic boundary conditions in the horizontal and used the K-Profile Parameterization (KPP) scheme (Large et al., 1994) for vertical mixing. For surface forcing, we applied a spatially homogeneous wind stress field derived from ECMWF reanalysis winds, averaged over the anticyclonic eddy region (Figure 2f). During a 25-day spin-up period, the wind stress was set to zero. The resolution of the reanalysis winds tends to underestimate wind strength, which affects the representation of convective systems around intense events like typhoons. The lack of spatial variability in winds, in particular the lack of wind-stress curl, implies that the wind forcing is ineffective at generating available potential energy on the scales of the anticyclone. Other forcings, including surface heat flux, freshwater flux, and solar radiation, were set to zero to isolate the role of wind forcing in generating NIWs and their interaction with the mesoscale eddy. These assumptions allow us to exclude the sea surface temperature-wind feedbacks induced by atmospheric layer mixing and focus solely on the dynamics of wind-driven NIWs.
Development of Small Lateral Scales in the NIW Field
The winds generate both sub-inertial currents (i.e., Ekman flow) and inertial motions. The former result in a sub-inertial translation of the eddy (see supplementary Movie S1). Additionally, the convergence and divergence of inertial motions at the base of the mixed layer, constrained by the eddy’s extension (Figure 4b,c), initiate the propagation of NIWs. The resulting wave packets lack azimuthal symmetry and typically propagate in the azimuthal (clockwise) direction. Successive wave packets interact, narrowing divergent filaments embedded within the eddy’s interior (see supplementary Movie S2).
The wind event induced a precessional motion, altering all components of the vorticity vector and resulting in a tilted eddy (e.g., Stern, 1965). For example, the vertical component of the vorticity developed a complex pattern characterized by intense horizontal gradients and rolled-up vorticity strips (see Movie S1). Additionally, divergence develops along the extension of the eddy at the base of the mixed layer, triggering the propagation of NIWs. The evolution of the divergence results in a complex spiraling pattern (Figure 4b,c; see Movie S2). Divergence at the base of mixed layer associated with inertial motions is referred to as “inertial pumping” (Gill, 1984). This phenomenon results in vertical velocities that shift isopycnals within the thermocline, creating pressure anomalies that, when correlated with the vertical velocity, generate a vertical energy flux that enables downward propagation and radiation of near-inertial energy into the ocean interior (Thomas and Zhai, 2022).
To efficiently transmit energy into the ocean interior, inertial motions must develop smaller lateral scales and flow divergence; hence, their lateral wavelengths must shrink. This phenomenon can be caused by a process known as ζ-refraction (Asselin and Young, 2020). Background vorticity (ζb = ∂xvb − ∂yub) modifies the effective inertial frequency  at which inertial motions oscillate (Kunze, 1985). Consequently, lateral variations in ζb can lead to a dephasing in inertial oscillations and generate smaller lateral scales in the wave field, wave refraction, and downward propagation.
We evaluate the reduction of the NIW wavelength, quantified using the evolution of NIW phase (e.g., Thomas et al., 2020). We decompose the flow (u, v, w) = (ub, vb, wb) + (uw, vw, ww) and density ρ = ρb + ρw into background (·b) and wave (·w) components by applying a fourth-order Butterworth filter with a cutoff of 4.5 inertial periods (2π/f). Then we computed the wave phase ϕw by taking a mixed layer depth-average  of the wave component of velocity and calculating its direction
  following Thomas et al. (2020). After the strongest winds of Typhoon Mawar, the mixed-layer wave velocity has a similar phase and amplitude across the eddy (Figure 5a,b). Subsequently, the velocity, and consequently the wave phase, begins to evolve at different rates across the eddy (Figure 5b). Fitting a line to the time series of the wave phase at the center of the eddy (where the vorticity is lowest), yields a rate of 0.95f, while at the rim of the eddy it is 0.99f. The sub-inertial frequency of 0.95f in the center of the simulated anticyclone is similar to what was inferred from the observed shear measured by the EM-APEX float (e.g., Figure 2e). While in the absence of a background current inertial oscillations oscillate at f, in a current with vertical vorticity the inertial frequency is shifted following feff, which is consistent with this behavior. The dephasing of the wave at the two locations becomes clear after a few inertial periods and results in an increase in wavenumber Kh (decrease in wavelength λ), quantified as
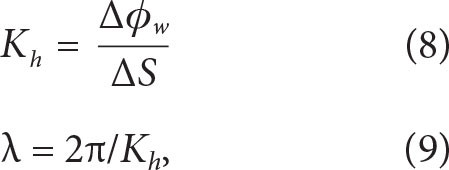
where ∆ϕw is the difference in phase between the two locations in the eddy and ∆S is the distance in between the two locations. Initially, λ is larger than 1,000 km. Then, after three inertial periods, it has dropped to ~100 km, a scale that is less than the diameter of the eddy (Figure 5c).
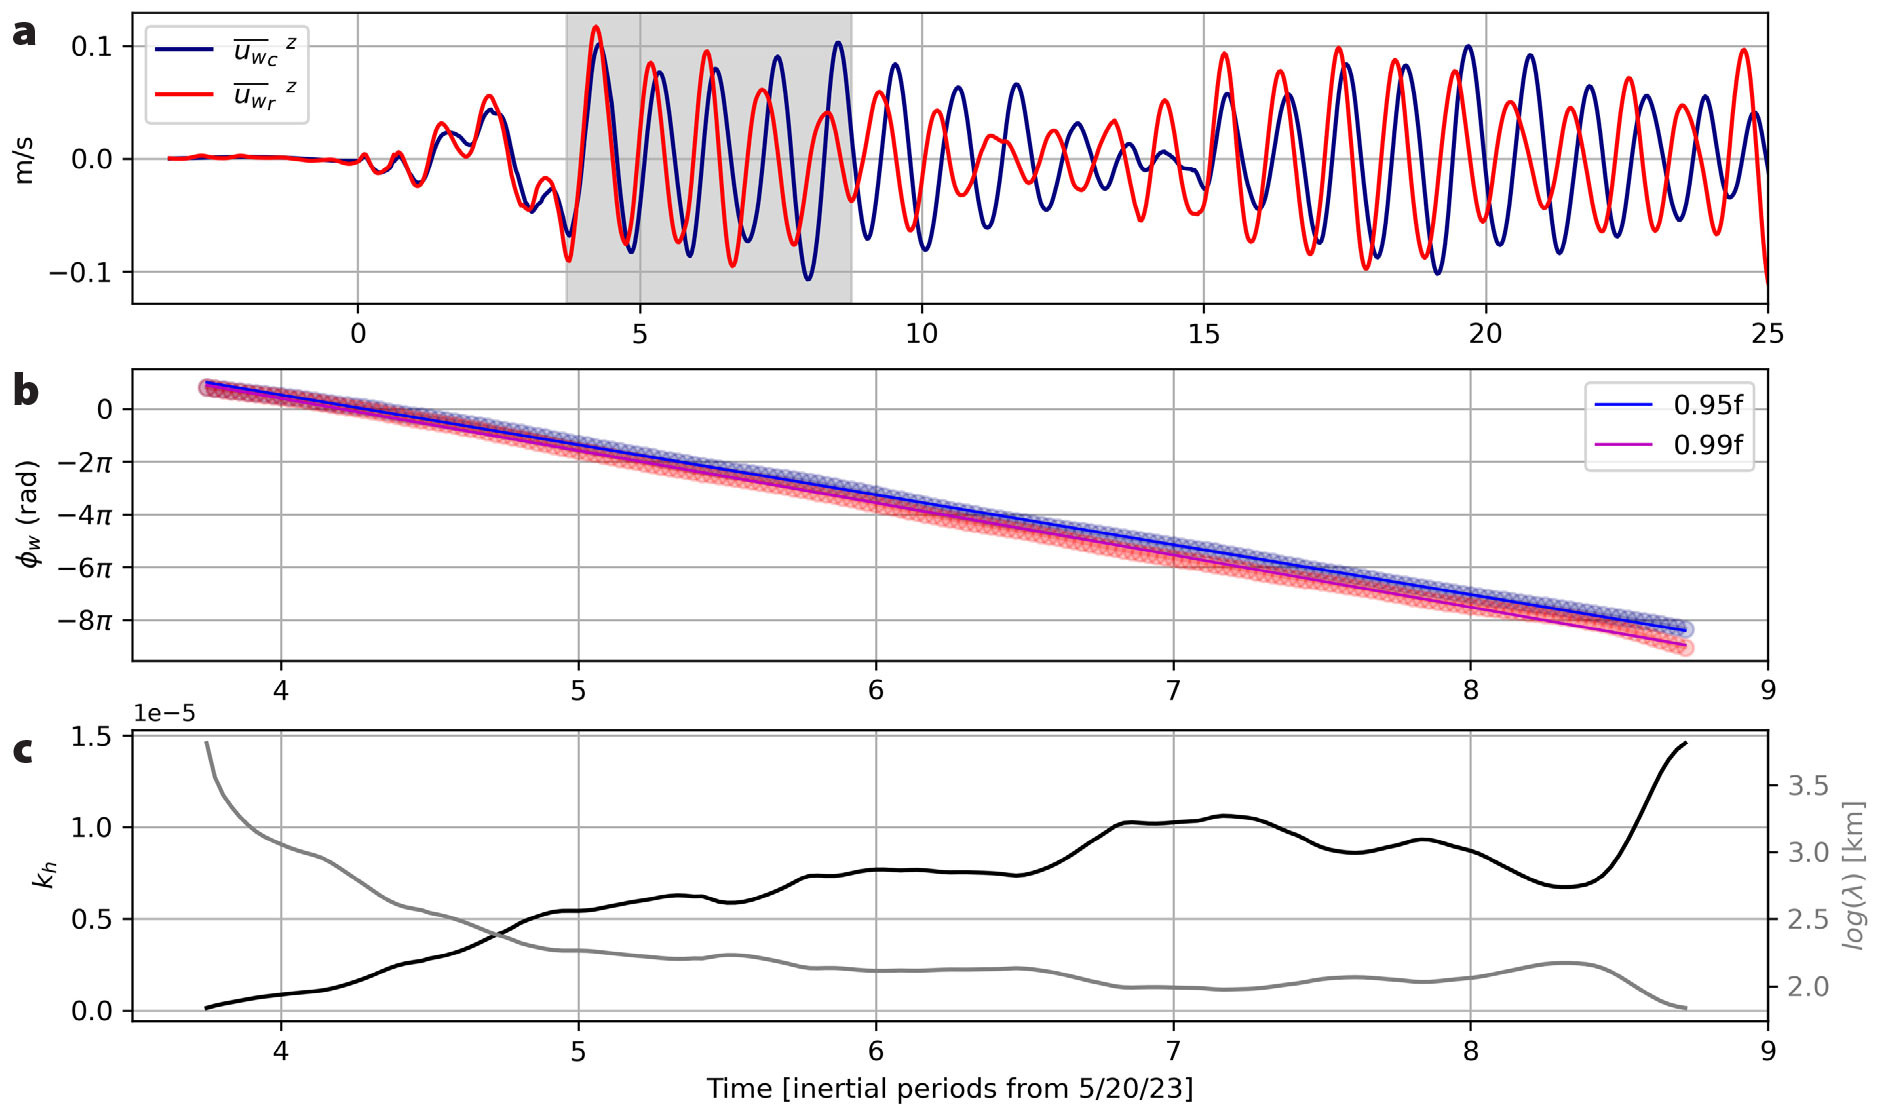
FIGURE 5. (a) The temporal variation of the simulated inertial motion component integrated over the mixed layer  at the center (blue) and rim (red) of the eddy. The gray hatched area highlights the onset of phase differences between the inertial motion across the eddy due to ζ-refraction. (b) Quantification of the phase differences using the angle of the inertial motion velocities at the center (blue) and rim (red) of the eddy. The gray hatched area highlights the onset of phase differences between the inertial motion across the eddy due to ζ-refraction. (b) Quantification of the phase differences using the angle of the inertial motion velocities  , which decreases over time at slightly different rates. Fitting a line to this angle (solid lines) yields frequencies of 0.95f and 0.99f at the center and rim of the eddy, respectively. (c) The evolution of the wavenumber and wavelength evaluated using the difference in wave phase between the two target locations during this period. > High res figure , which decreases over time at slightly different rates. Fitting a line to this angle (solid lines) yields frequencies of 0.95f and 0.99f at the center and rim of the eddy, respectively. (c) The evolution of the wavenumber and wavelength evaluated using the difference in wave phase between the two target locations during this period. > High res figure
|
Trapping of the NIW in the Anticyclone
In the previous section, we showed how the idealized model simulates the reduction in NIW lateral scale induced by the vorticity field, which is necessary for downward propagation. Here we show how the model can capture the observed wave phase and group velocity, thus building confidence that it can be used to elucidate the physics of the observed NIW trapping in the eddy.
Our simulation, even with its high degree of idealism, successfully reproduced the observed NIW vertical phase speed, as illustrated in Figure 6a. The model qualitatively captured the temporal evolution and vertical structure of the vertical shear measured by the EM-APEX float at the beginning of the record, while the float remained near the eddy center (approximately until June 23, corresponding to about 23 inertial periods in the simulation). Both observations and the simulation revealed the downward propagation of two NIW packets with similar shear layers with upward-propagating wave phase. The EM-APEX observations did not capture the surface signature of the first packet because the float was deployed after this phase. However, the subsequent subsurface shear enhancement is visible in the observations and simulations. The subsurface enhancement associated with the first NIW packet occurs after June 6 (approximately 11 inertial periods) at a depth of 100 m, while the second packet begins at the surface on June 14 (approximately 17 inertial periods) (Figures 2 and 6). Discrepancies between the observed and simulated shear seen in Figure 6a could be attributed to the different frames of reference (i.e., a fixed Eularian frame at the eddy center for the simulation and a quasi-Lagrangian frame for the float). Furthermore, the advection of the EM-APEX float out of the eddy following a turn in its trajectory (Figure 2c) could also contribute to the differences. However, during the period when the float remained within the eddy’s center, when its observed velocities displayed a distinct and intense signal of a trapped NIW, the simulation demonstrated strong agreement. These findings suggest that the NIWs are locally generated by winds and subsequently trapped by the mesoscale eddy, thereby channeling inertial energy toward the interior ocean. As the NIW propagates toward the core of the eddy and approaches the depth where its frequency equals feff, it can become trapped in a critical layer due to an increase in the effective Coriolis frequency with depth (Kunze et al., 1995), as observed in the simulation between 50 and 300 m (e.g., Figure 6d). This entrapment could potentially cause the waves to break, generating turbulence.
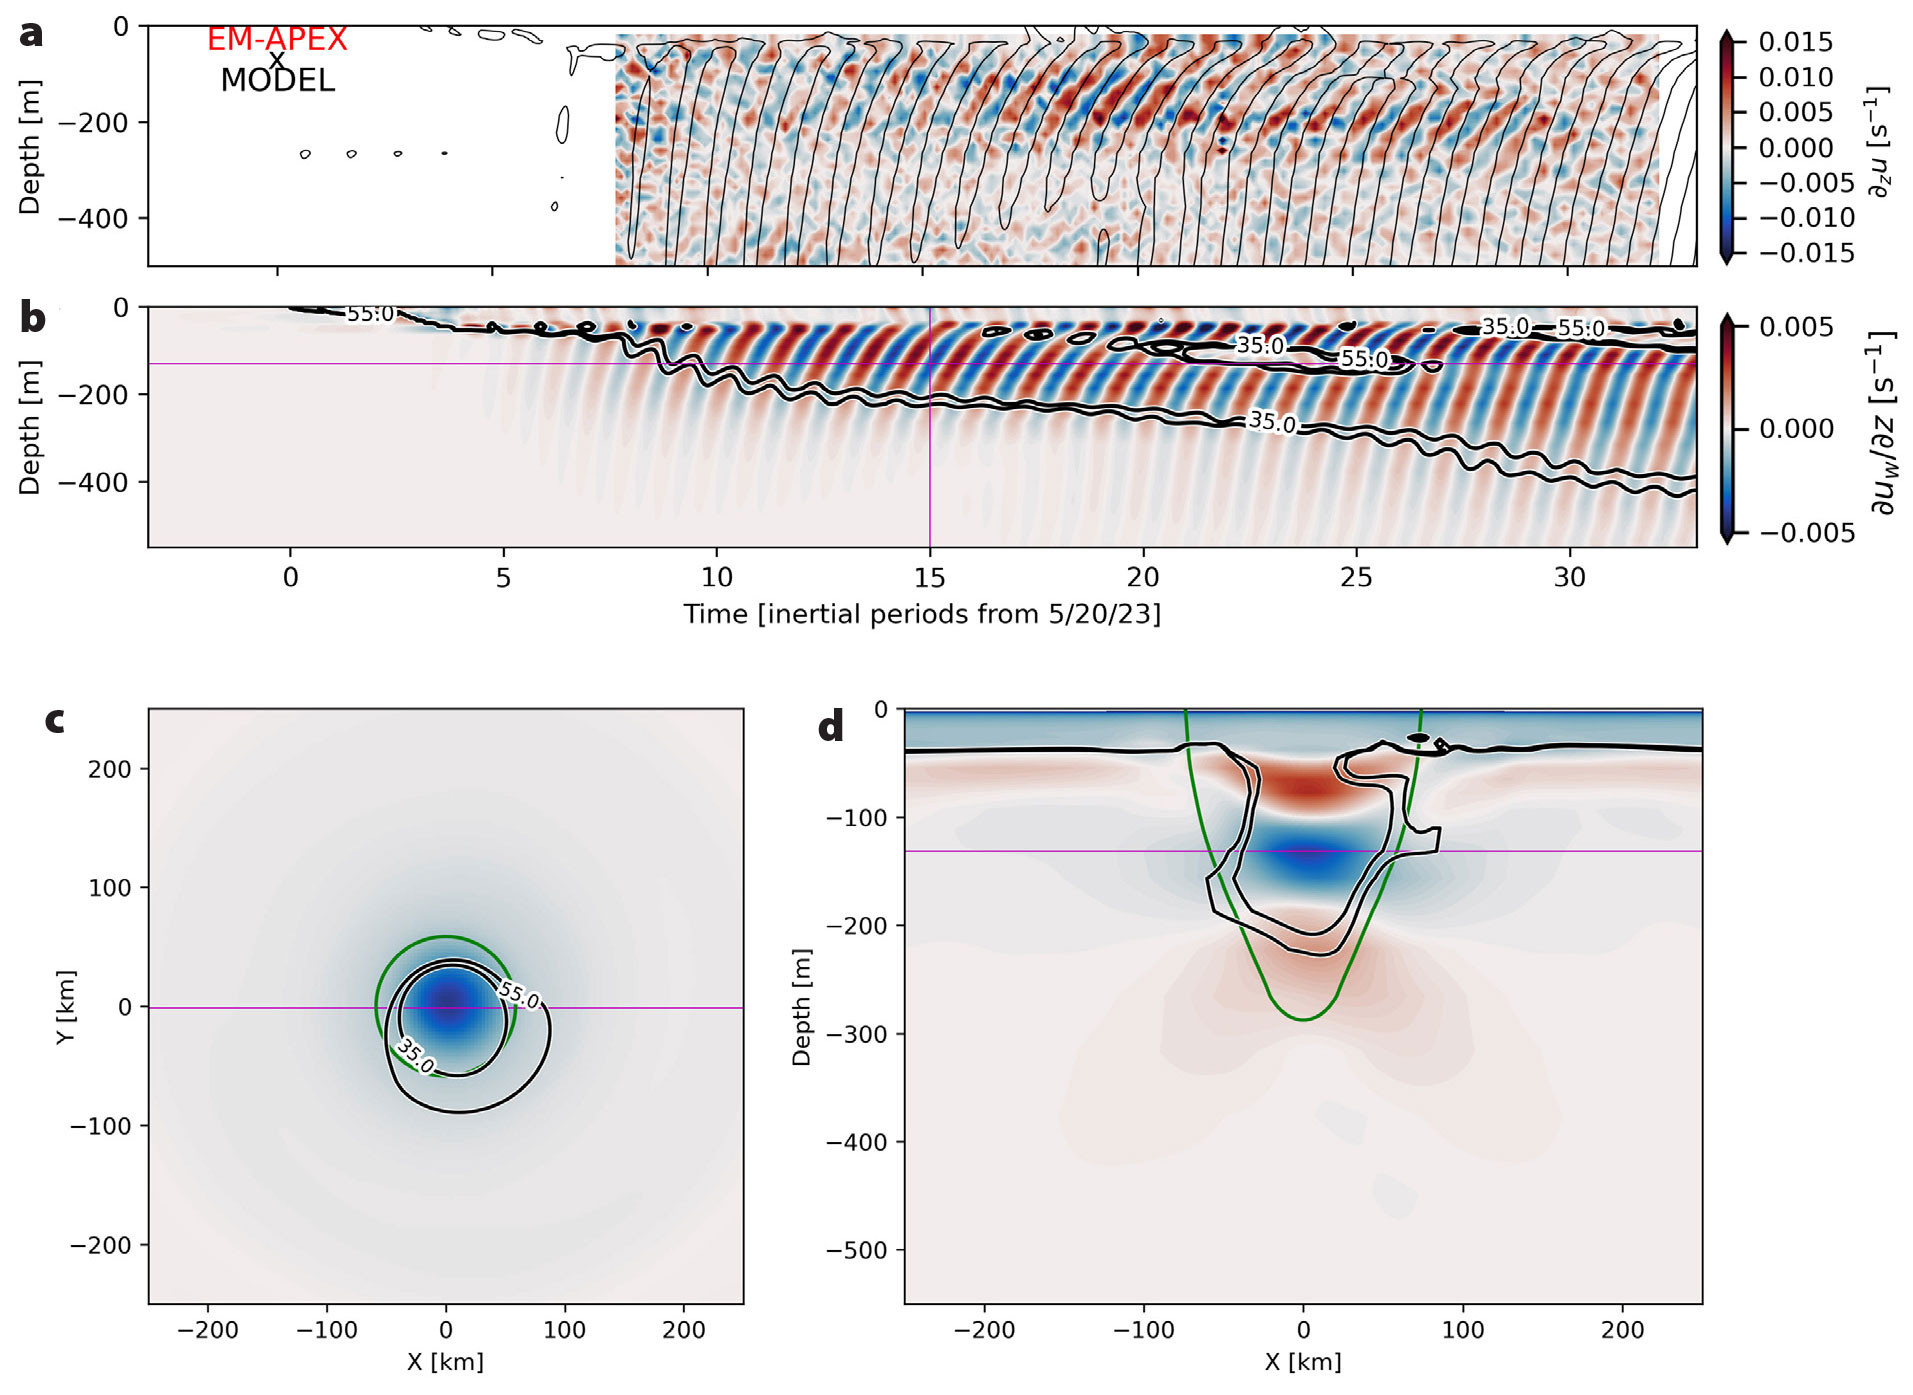
FIGURE 6. All panels depict vertical shear in different formats: Hovmöller diagrams, horizontal or vertical sections. (a) A Hovmöller diagram of the measured vertical shear (color) from the EM-APEX float (see Figure 2e), overlaid with contours of simulated vertical shear, illustrating phase propagation similarity between the observed and simulated shear layers. (b) The simulated vertical shear at the eddy center (color) as a Hovmöller diagram, with contours of Richardson number (Ri = 35 and Ri = 55). The magenta line marks the depth and time of the snapshots in panels (c) and (d). (c) A horizontal section at z = –131 m of the simulated vertical shear at t = 15 inertial periods, with black contours showing Ri, and the green contour indicating where feff = 0.95f. The magenta line denotes the location of the vertical section in panel (d). (d) The vertical shear along a cross section through the eddy center, as indicated by the magenta line in panel (c), with contours of Ri and the green line marking feff = 0.95f. > High res figure
|
Shear instabilities are a likely source of turbulence that might explain the observed patchy dissipation field (Figure 2c). In theory, shear instability occurs when the Richardson number, Ri, the ratio of the buoyancy frequency to shear, squared, drops below a quarter (Miles, 1961). While our simulations show that the NIWs drive an increase in vertical shear within the eddy interior, their strength is insufficient to lower Ri below a quarter (Figure S3). More specifically, Ri is larger than 10 in the core of the eddy, where anticyclonic vorticity and vertical shear are maximized within the intrathermocline region (~130 m; Figure 6). Thus, the NIWs in the simulations cannot directly explain the layers of enhanced turbulence that were observed. This could be because the model lacks sufficient vertical resolution to fully capture the physics of NIW trapping in critical layers. In addition, the model is not forced by tides. The western Pacific is a region of intense internal tides (Rainville et al., 2013), and wave-wave interactions between NIWs and the tides and between the internal tides themselves might explain the observed layers of enhanced dissipation. However, this physics is missing in the model because our aim is to isolate the effect of wind-driven NIWs so we have excluded the internal tides.
Eddy-Wave Energy Exchange
Disentangling energy exchanges associated with wave-eddy interactions is challenging. Here, we provide a first glimpse of such interactions by analyzing the kinetic energy of the balanced flow

and NIWs

and the kinetic energy conversion (KEC) between these two pools of energy. KEC is given by the sum of horizontal (HSP) and vertical (VSP) shear production terms
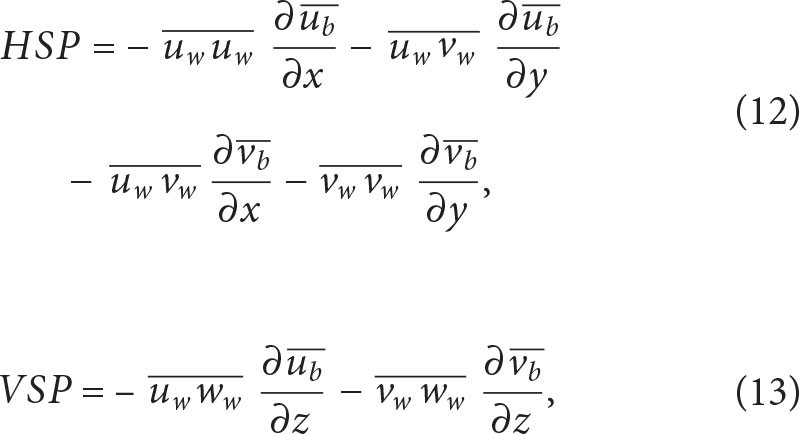
where the overbar represents a rolling time-average with a window of 4.5 inertial periods, the same used in the flow decomposition. The sum of these components shows the energy conversion toward wave kinetic energy when KEC > 0, and toward balanced kinetic energy, KEC < 0.
Based on the flow decomposition detailed in the above section on Development of Small Lateral Scales in the NIW field, the kinetic energy of the simulated eddy (KEb) is influenced by the passage of simulated atmospheric systems. However, this disturbance is confined to the mixed layer and thus represents a sub-inertial, Ekman response. The temporal variation of KEb in the interior ocean is minimally affected. This finding indicates that the energy budget of the axisymmetric balanced eddy imposed in the idealized simulation is only weakly impacted by local wind disturbances through an Ekman response (Figure S4). Figure 7 illustrates the temporal and depth dependence of the NIW-eddy interaction by showing the KEC laterally integrated across the numerical domain. It is dominated by vertical shear production, which is at least an order of magnitude larger than horizontal shear production (Figure S5). The positive sign of the laterally integrated KEC at depth indicates that the eddy loses kinetic energy to the wave beneath the mixed layer (Figure 7a).
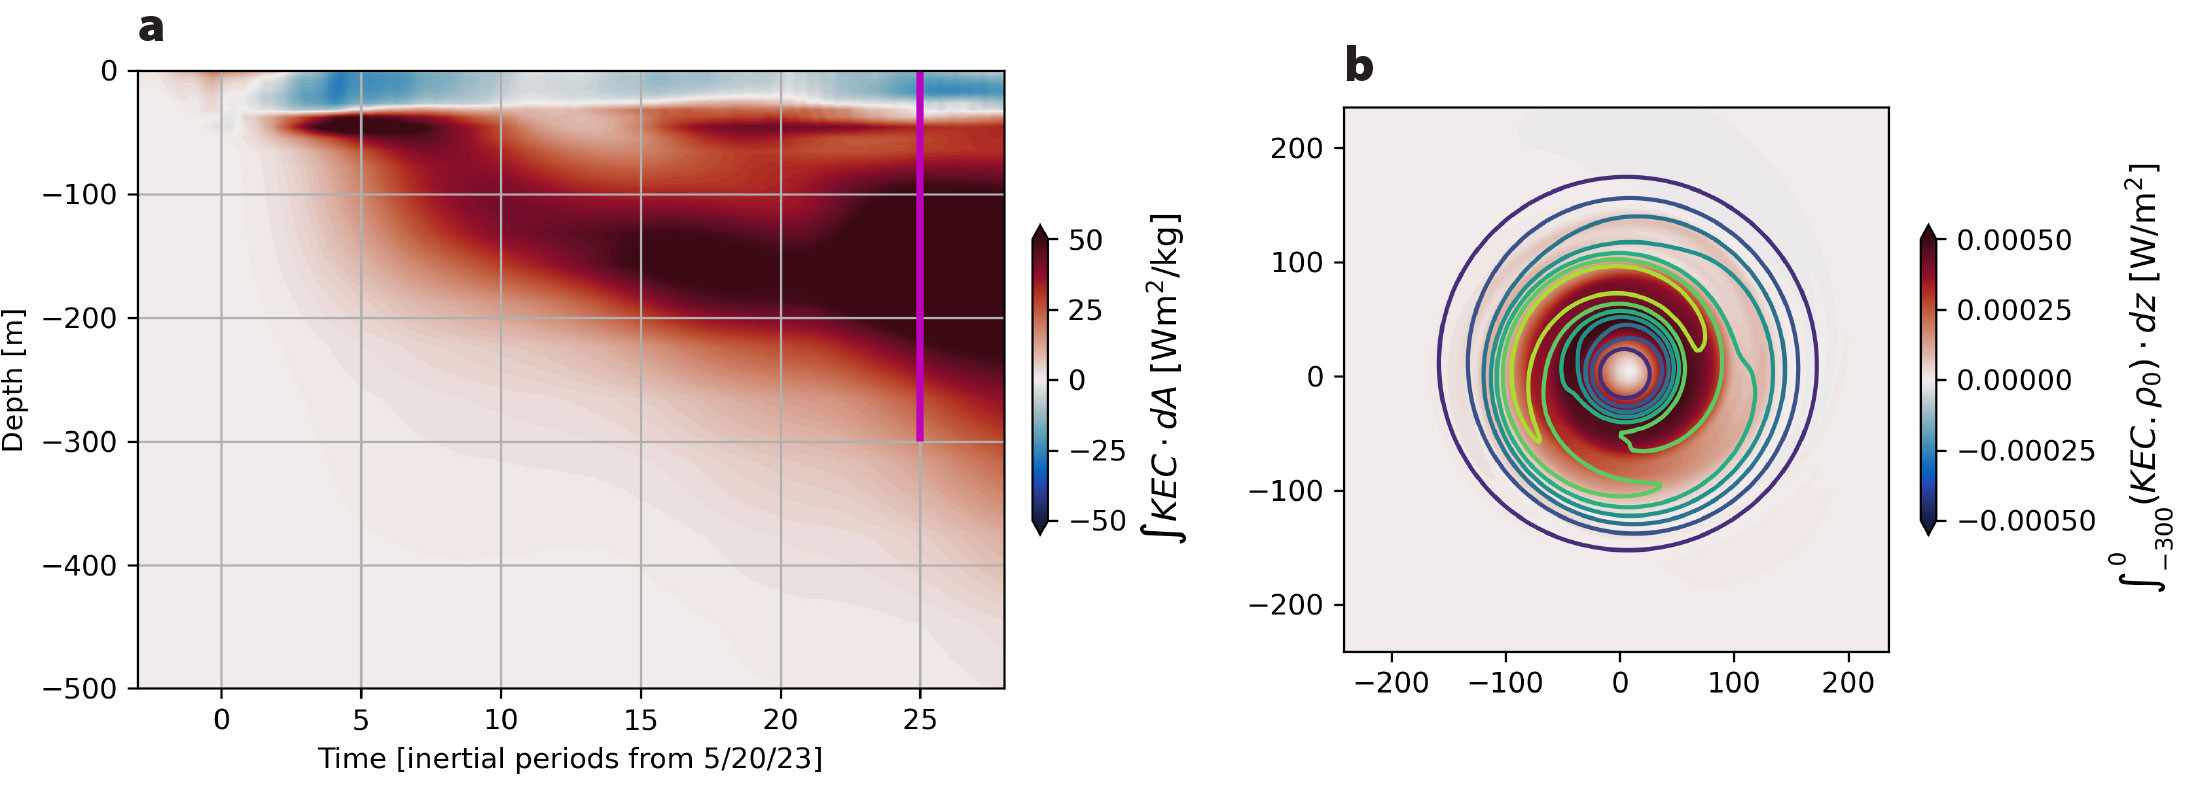
FIGURE 7. (a) Lateral integration of kinetic energy conversion (HSP + VSP), where blue shading indicates the conversion of near-inertial kinetic energy to balanced kinetic energy, and red shading shows the reverse process. (b) Depth-integrated kinetic energy conversion over the upper 300 m, with the same color scheme as panel (a). Contours represent the squared vertical shear (∂ub/∂z)2 + (∂vb/∂z)2, with yellow contours highlighting areas of maximum shear. > High res figure
|
Integrating the KEC with depth over the upper 300 m where it is strongest (and multiplying by the reference density ρo to put it in units of W m−2) reveals that the KEC is most intense at the edges of the anticyclone where its vertical shear is largest, consistent with the dominance of VSP over HSP in wave-driven energy exchange (Figure 7b). The maximum value of the depth-integrated KEC is less than 0.5 mW m−2. To put this value in perspective, the release of available potential energy that fuels mesoscale eddies integrated over the global ocean is of order 1 TW (Wunsch and Ferrari, 2004) that, when divided by the area of the ocean, corresponds to 3 mW m−2. This suggests that the extraction of mesoscale eddy kinetic energy by typhoon-induced NIWs is relatively weak and is likely of secondary importance to the kinetic energy budget of eddies in the Philippine Sea. While NIW-eddy energy exchanges are generally weak, some caveats are warranted. Specifically, the eddy used in our simulation is circular and strain-free, which may reduce its effectiveness in facilitating wave-mean flow energy exchange.
Assessing the Influence of Vorticity on the NIWs in the Anticyclone
It is clear from both the observations and the numerical simulation that the vorticity of the observed mesoscale eddy modifies the properties of the NIWs driven by Typhoon Mawar. However, this was not necessarily a given because not all mesoscale eddies strongly affect the structure and propagation of NIWs. Other factors besides vorticity, namely stratification and the vertical structure of the waves, influence the degree to which eddies modify NIWs. For example, Thomas et al. (2024, in this issue) showed that eddies in the eastern North Pacific are less likely to influence the behavior of NIWs than vortices in the North Atlantic because of the higher stratification and larger vertical scales of the NIWs in the eastern North Pacific. The degree to which NIWs are affected by a mesoscale eddy can be assessed by decomposing the NIW velocity field into vertical modes, and calculating the dispersivity, a non-dimensional parameter defined as

where cn is the horizontal phase speed of the nth vertical mode, and ψeddy measures the strength of the geostrophic stream function of the eddy in question (for a derivation of this result, see Thomas et al., 2024, in this issue). Specifically, vertical modes with dispersivities that are less than one (greater than one) are strongly (weakly) affected by the vorticity of an eddy. Vertical modes were calculated using a stratification profile based on a deep CTD cast taken near the anticyclonic eddy during the ARCTERX field campaign (Figure 8a,b). We subsequently applied the modal decomposition method to a velocity profile from our idealized simulation (Figure 8c) to estimate the wave phase speed (Figure 8d) and dispersivity (Figure 8e) for each vertical mode shortly after the wind pulse from Typhoon Mawar, as NIWs began to propagate. The resulting phase speeds of the modes (cn, Figure 8d) and a scaling for the geostrophic stream function ψeddy = (g/f)ηmax (where ηmax is a scaling for the SSH anomaly in the anticyclonic eddy) were used to estimate the dispersivity. Modes with mode number greater than three have dispersivities below one, indicating that these modes should be significantly affected by the vorticity of the anticyclonic eddy (Figure 8e). Typhoon Mawar injected a considerable amount of energy into these higher modes, as assessed by decomposing an NIW velocity profile from the idealized simulation evaluated shortly after the passage of the typhoon into vertical modes (Figure 8c). Namely, the decomposition reveals that modes with a mode number even as high as 10 contain a significant fraction of energy (e.g., Figure 8d). The implication is that modes that are affected by the vorticity of the anticyclone we observed in the Philippine Sea explain a large amount of the variance in the NIW field; thus, it is not surprising that the NIWs that we measured were clearly modified by the eddy. This is in contrast to NIWs in the eastern North Pacific that are dominated by low modes that do not “feel” the vorticity. Instead, the NIWs observed here in the Philippine Sea are more similar to the high-mode NIWs observed in the North Atlantic that are strongly shaped by ζ-refraction (e.g., Thomas et al., 2024, in this issue).
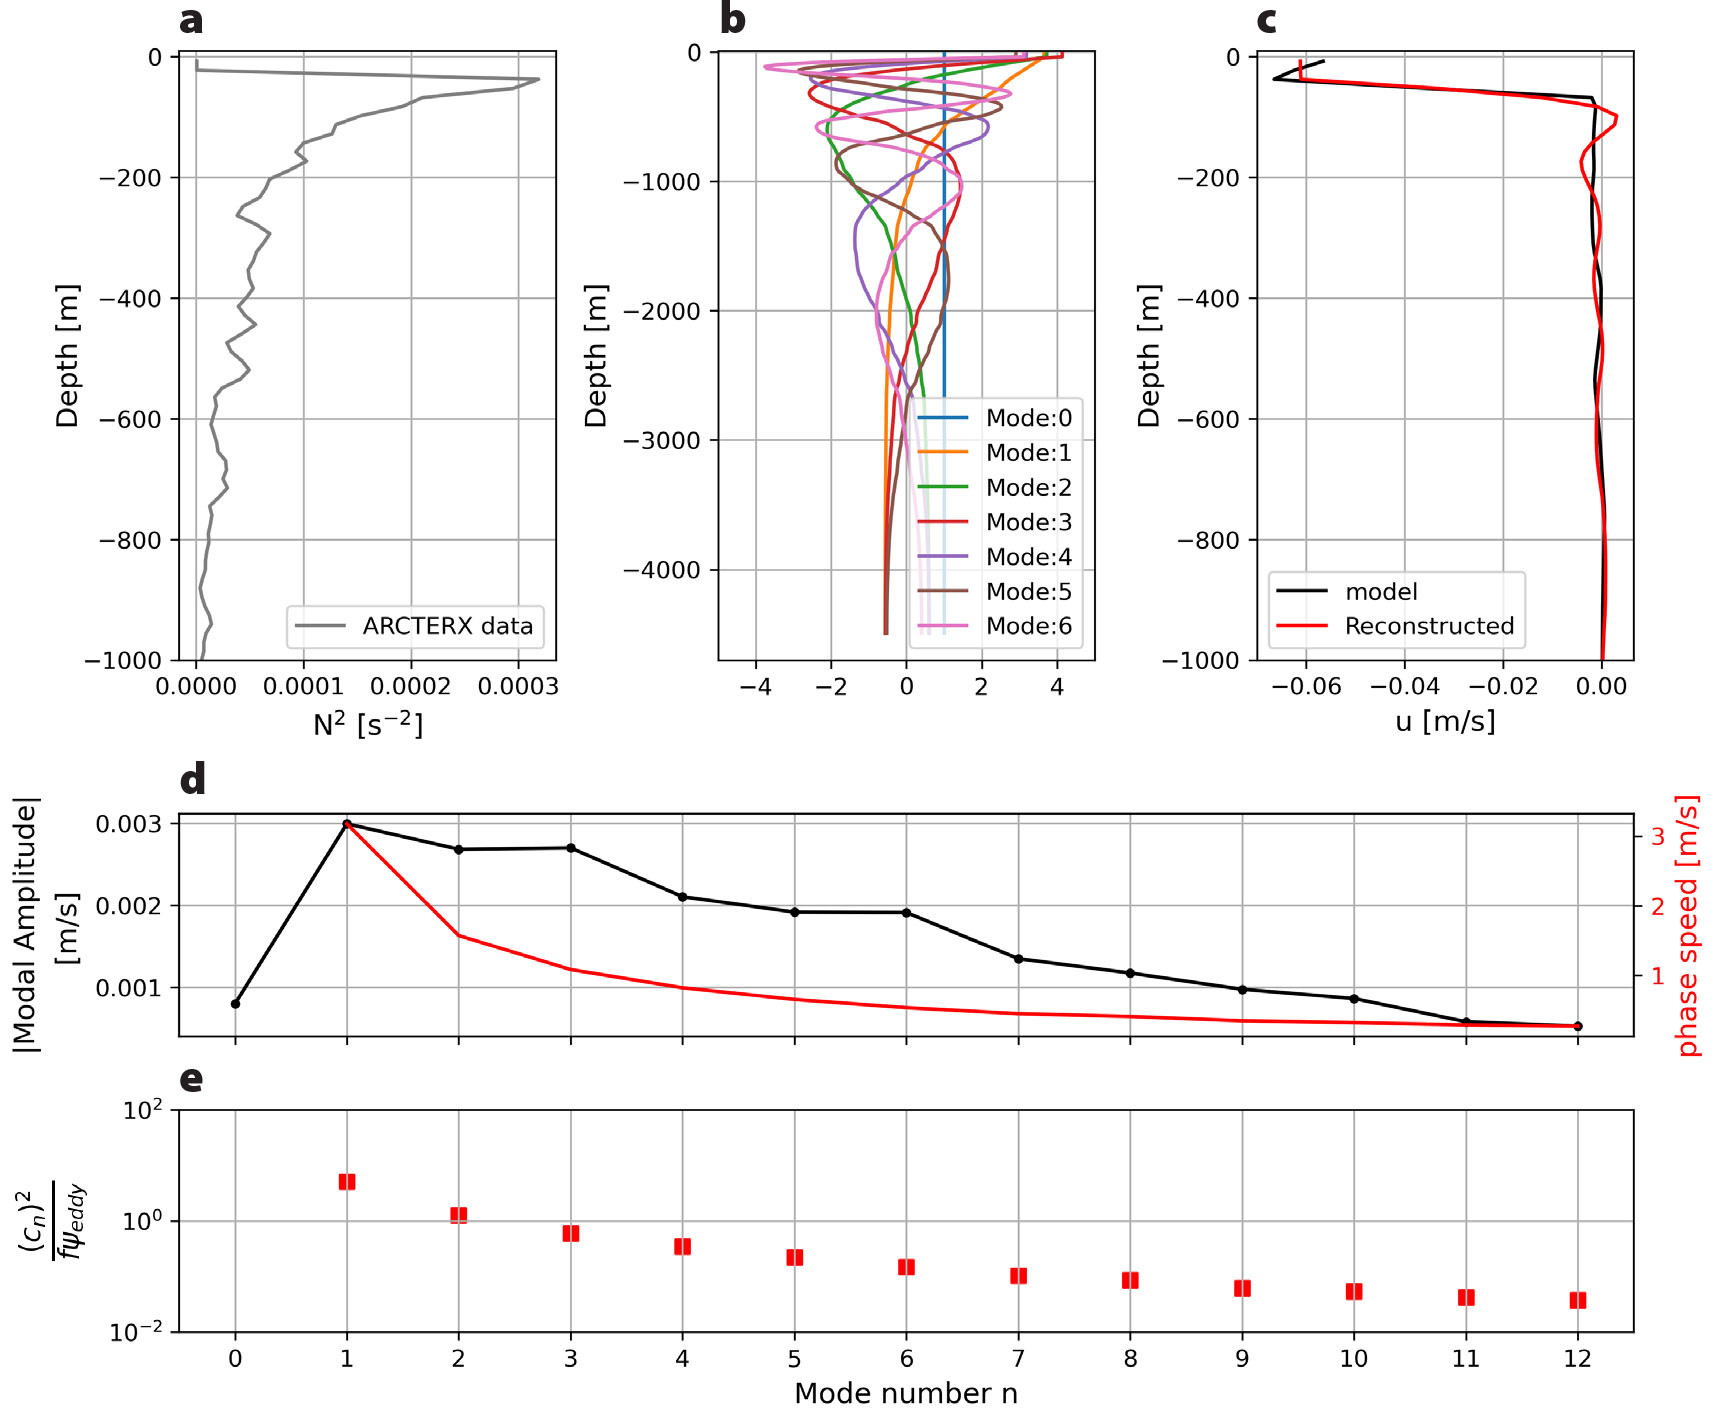
FIGURE 8. (a) Stratification profile calculated from a deep oceanographic station near the region of the analyzed vortex. (b) The first seven vertical modes calculated based on the stratification profile shown in panel (a). (c) Simulated near-inertial velocity component (black) extracted shortly after the typhoon passage, and the velocity profile reconstructed by the superposition of vertical modes (red). (d) Amplitude of the nth vertical modes (black) and their respective horizontal phase velocities. (e) The non-dimensional number  that measures the relative strength of NIW dispersion to ζ-refraction for each mode evaluated for the NIWs and eddy observed during the ARCTERX field campaign. Modes where that measures the relative strength of NIW dispersion to ζ-refraction for each mode evaluated for the NIWs and eddy observed during the ARCTERX field campaign. Modes where  are more strongly affected by vorticity and are more trapped in the anticyclonic eddy. > High res figure are more strongly affected by vorticity and are more trapped in the anticyclonic eddy. > High res figure
|
Discussion and Final Remarks
The ARCTERX field campaign occurred in late spring 2023 in the Philippine Sea, a period characterized by maximum mesoscale kinetic energy and minimal submesoscale activity due to the shallow mixed layers (Qiu et al., 2014). Typhoon Mawar, the first typhoon of 2023, reached Category 5 intensity as it approached the ARCTERX target mesoscale anticyclone (Figure 1). It traveled as a fast-moving system, with a translational speed exceeding the local group velocity (Utyphoon/cg > 1), indicating an oscillatory ocean response (Geisler, 1970; Nilsson, 1995; Brizuela et al., 2023b).
An array of instruments was deployed within this eddy a few days after the typhoon’s passage. An EM-APEX float placed at the eddy’s center revealed strong vertical shear oscillating at a slightly sub-inertial frequency with upward phase propagation (Figure 2e). A transect of vertical shear across the anticyclone suggested that the shear was most intense in the center of the eddy (Figure 2d). These observations are consistent with a downward-propagating NIW trapped in the anticyclone following dynamics in line with the theory of ζ-refraction (Asselin and Young, 2020).
Using hydrography from the ARCTERX field campaign, we constructed an idealized, axially symmetric, geostrophically balanced version of the observed eddy (Figure 4a) in order to form the initial condition for a numerical simulation used to study the NIWs generated by Typhoon Mawar and their interactions with the anticyclone. We forced the idealized model with reanalysis winds (Figure 2f) to capture a spatially smoothed version of the typhoons’ winds. However, the winds used in the simulation were spatially uniform, unlike the observations. The lack of wind-stress curl prevents the winds forcing the model from directly modifying the available potential energy on the scales of the anticyclone. Having said this, the main objective of the simulation was to study the dynamics of the NIWs generated by the passage of the typhoon, not the direct modification of the balanced eddy by the winds. The length scale of atmospheric systems in the region are typically much larger and faster than the ARCTERX eddy (e.g., Wada, 2023), suggesting that spatially uniform winds should be able to capture the key physics of the observed NIWs. Indeed, our idealized simulation was able to qualitatively reproduce the generation, downward propagation, and amplification of NIWs trapped in the anticyclonic eddy seen the observations (Figure 6a,b).
The ARCTERX initiative aims to unravel the annual variation in mesoscale eddy kinetic energy in the Philippine Sea, which peaks in late spring and has a minimum at the beginning of the year when submesoscale instabilities tend to strengthen in the subtropics (Qiu et al., 2014). While the increasing mesoscale eddy kinetic energy has been associated with an inverse energy cascade due to submesoscale baroclinic instabilities in the mixed layer, the mesoscale eddy kinetic energy decay is not well understood. In addition to this seasonal variation in the oceanic flow, this region is regularly affected by typhoons, which are most frequently observed during late summer and fall (D’Asaro et al., 2011) when the kinetic energy of mesoscale eddies decays. Storms such as tropical cyclones and typhoons trigger NIWs that interact with mesoscale eddies and affect ocean mixing (e.g., D’Asaro, 1985; Essink et al., 2022). However, the net effect NIWs have on the energetics of mesoscale eddies is not yet well known. The theory of Xie and Vanneste (2015) predicts that NIWs extract energy from the balanced flow and suggests that this mechanism could significantly remove kinetic energy from mesoscale motions, helping to close the global kinetic energy budget of the circulation. Given the importance of understanding mesoscale energy decay, we present a simplified version of the problem that isolates the impact of strong, episodic atmospheric systems, such as typhoons, on a quasi-realistic mesoscale eddy. Although we used an idealized eddy, we preserved the key features of a typical eddy in the Philippine Sea during typhoon season.
Our numerical simulation of an axisymmetric, geostrophically balanced eddy suggests, however, that the exchange of kinetic energy between such an idealized mesoscale eddy and NIWs is weak (see Figure S5 and Figure 7). This implies that other mechanisms are likely responsible for the observed seasonal decline in mesoscale eddy kinetic energy during the latter half of the year in the Philippine Sea. NIW-eddy energy exchanges appear weak, potentially due to the circular, strain-free structure of the simulated eddy, which may limit wave-mean flow interactions. Additionally, the seasonal drop in mesoscale EKE during typhoon season may result from reduced inverse cascade contributions from submesoscale instabilities, allowing other dissipative processes, like internal tide-eddy interactions, to dominate. A central finding of this study is our ability to capture and explain the primary dynamics of NIWs using a straightforward, idealized simulation driven by spatially uniform winds. The successful reproduction of the NIWs’ vertical structure, phase relationships, and vertical propagation within the anticyclone (Figure 6) provides evidence of this.
It is clear from the observations and our idealized simulation that typhoon-induced NIWs enhance the vertical shear in the thermocline. Microstructure measurements show that turbulent dissipation can be elevated in these regions of enhanced shear (Figure 2c). While the NIW shear in the idealized simulations is not strong enough to significantly enhance mixing, it does follow a pattern of amplification with depth, consistent with the observations that are suggestive of NIW trapping in a critical layer (Figure 6a,b). That said, the processes absent in this idealized simulation, such as internal tides and their interaction with NIWs, may contribute to enhanced mixing in the thermocline. Mixing associated with tropical-cyclone-driven NIWs has been posited to play an important role in fluxing heat into the thermocline, where it can be transported to higher latitudes by the circulation and affect climate, as described by Brizuela et al. (2023a), who saw compelling evidence of this process in the Philippine Sea after passage of typhoons. As we highlight in this article, the interaction of typhoon-induced NIWs with anticyclones enhances the downward-propagation of NIWs into the thermocline (Figure 5) and can generate conditions favorable for wave breaking and mixing. This suggests that mesoscale eddies in the western Pacific could play an important role in heating the thermocline by funneling NIW energy out of the mixed layer and into the thermocline.
Acknowledgments
We are grateful to the captain and crew of R/V Thomas G. Thompson, who made the collection of the ARCTERX observations possible. We thank the reviewers and editor for their insights, which strengthened this work. This work was supported by ONR grants N00014-21-1-2886 (LNT and CZL), N00014-21-1-2792 (JMC, KFC, and RKS), and N00014-21-1-2434 (ZBS).

