Full Text
Tsunamis pose a threat to coastal communities. Flooding from tsunami-generated waves can cause extensive damage to infrastructure, and in some cases may even lead to loss of human life. Sea level rise due to climate change is expected to exacerbate the risk of flooding hazards. In British Columbia (BC), coastal communities are particularly vulnerable to tsunamis because of their proximity to the Alaska-Aleutian and Cascadia subduction zones.
To mitigate risks, it is imperative to understand how tsunami events could impact coastal communities. One method for understanding tsunami hazards is to generate inundation and risk models to determine areas that will be impacted by flooding. These tsunami models require a continuous bathymetric and topographic Earth surface model to determine tsunami behavior and flood patterns. This article focuses on the creation of three-dimensional digital elevation models (DEMs) of Earth’s surface to support tsunami modeling, inundation mapping, and risk assessment.
Methodology
Multiple nested DEM grids of varying scales and resolutions are necessary to accurately model tsunami behavior. Generating these seamless bathymetric-topographic DEMs requires collecting, compiling, converting, processing, and integrating large volumes of data.
First, topographic (elevation) data and bathymetric (depth) data are acquired from numerous sources at varying levels of processing. Some source data are obtained in raw formats with virtually no previous processing or quality control, while other data sets may be provided already appropriately classified and quality checked.
Once data have been collected, it is necessary to evaluate the vertical and horizontal datums, the coordinate systems, data type, data resolution, and level of previous processing. Each data set then needs to be converted to a consistent vertical and horizontal datum with coordinates represented in decimal degrees. If lidar data are available, the topographic and bathymetric data need to be classified and only the bare-earth points retained because bare-earth surfaces are required to create DEMs suitable for tsunami modeling (NTHMP, 2010).
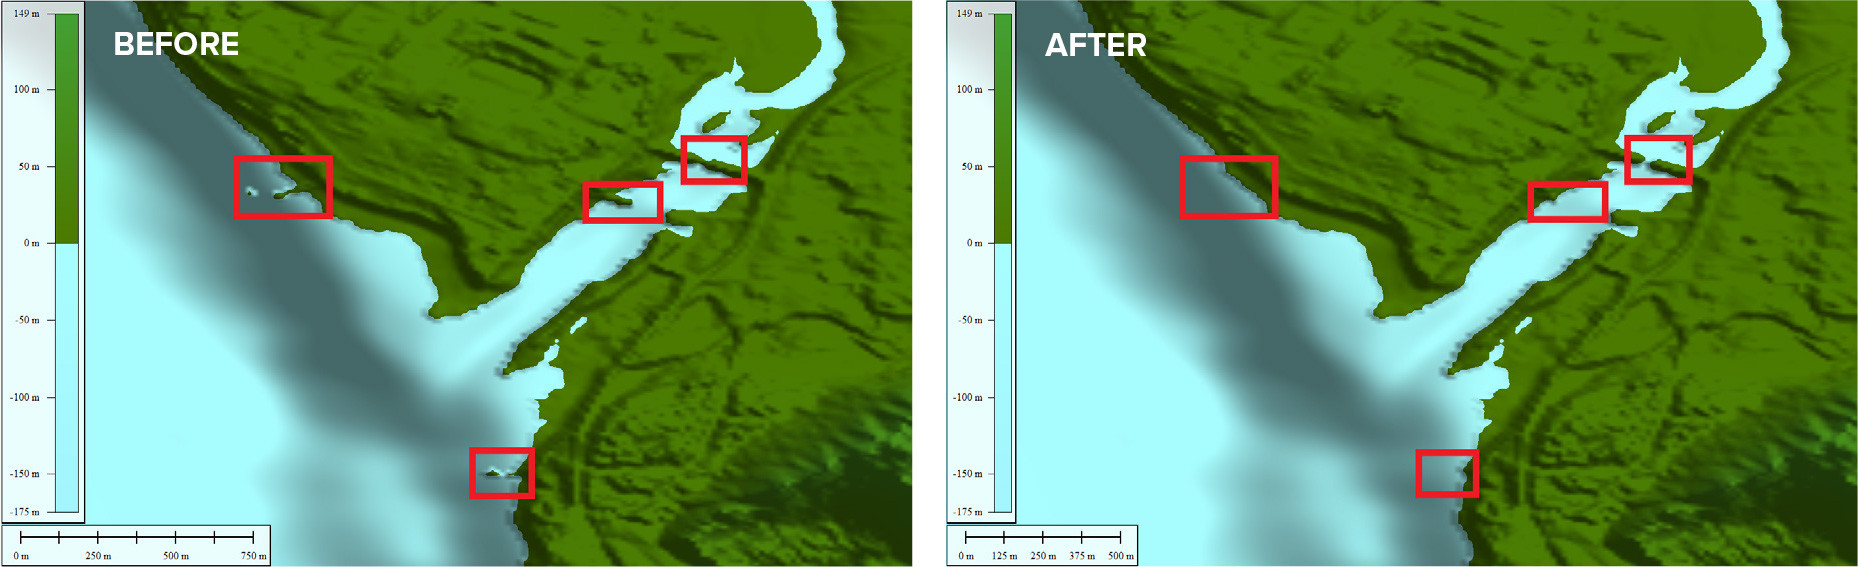
Data sources are checked for potential errors. For example, in certain cases, the lidar files contained docks, bridges, buildings, water features, and vegetation erroneously classified as bare-earth. Because these structures would impact tsunami wave propagation in the model, they need to be removed before being integrated into the DEM (Figure 1).
|
|
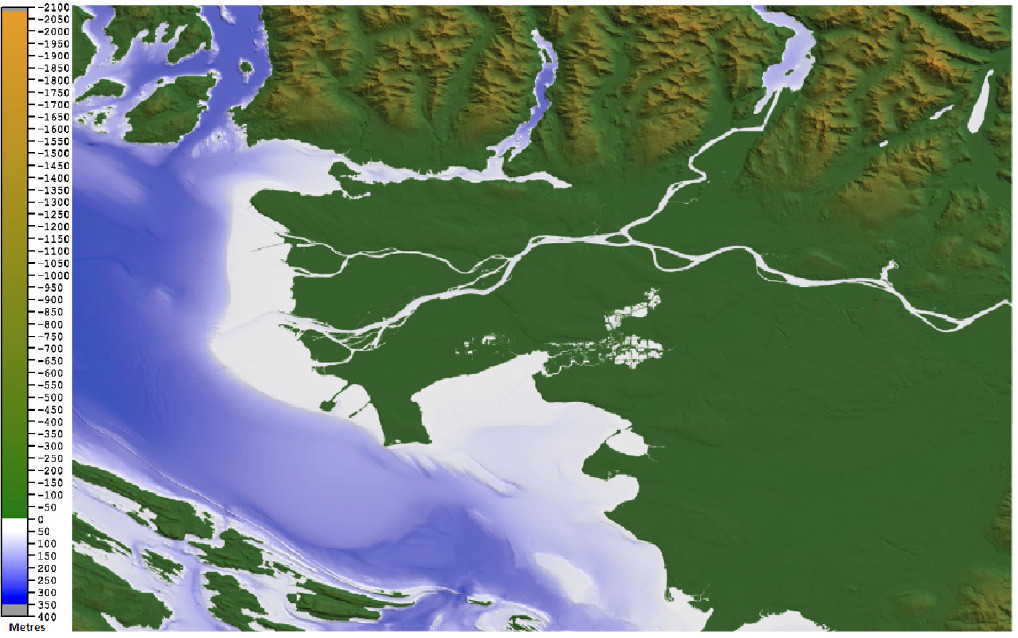
After data sources have been checked and processed into consistent formats, the final step before integration is to convert each file into a format where each point has a longitude, latitude, and elevation/depth. After several additional data preparation steps, a weighting structure is applied to the data sets that gives the highest priority to higher resolution and more reliable input to ensure these data have the most influence in the grid cell values of the resulting DEM. Finally, MB-Grid, a software tool, is used to create a DEM with a specified resolution and bounding box coordinates. Figure 2 shows a completed high-resolution DEM for a large area of the lower mainland in southwest BC.
|
|
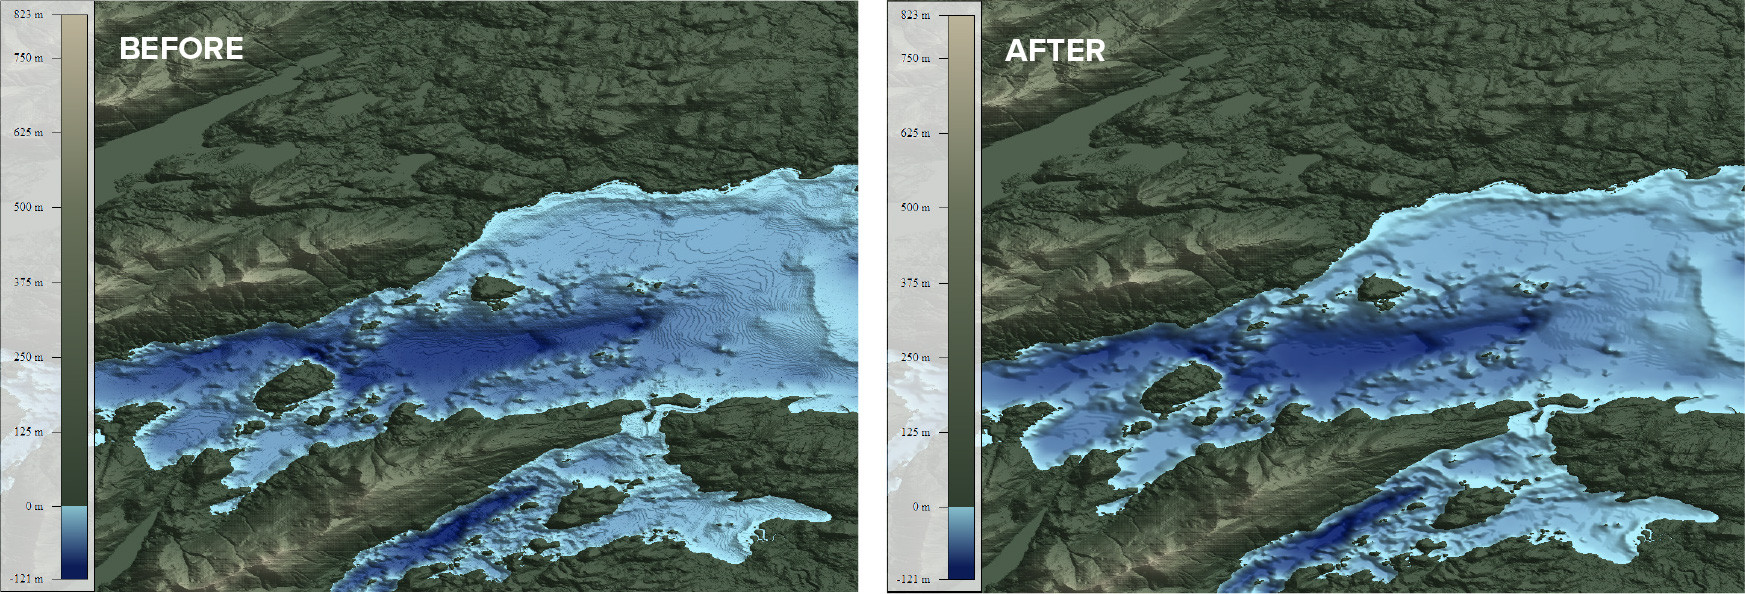
Integrating the differing data sources, especially in remote coastal areas lacking high-resolution data, can lead to abrupt transitions in the DEM at the boundaries of the data sets. This may cause instability and unphysical waves during the tsunami modeling process. This effect can be reduced by applying a Gaussian blur smoothing algorithm to the bathymetry portions of the DEM (Figure 3).
|
|
Model Assessment
A number of methods are used to evaluate the accuracy of the final DEM models. Comparisons with satellite imagery, ground control points, and established map and nautical chart contours are some of the main tools used to assess the models. When a model deviates significantly from reality, the source data are examined, and any remaining outliers are removed. DEM grids are then re-run until a suitable surface is achieved.
It should be noted that while DEMs are extremely useful for studies of Earth’s surface, they are only a representation of reality, and caution should be taken when using DEMs outside of their intended purpose. DEMs generated using this method contain data from numerous sources of varying reliability and can result in areas with significant interpolation due to sparse high-resolution data in remote areas. Furthermore, these DEMs cover very large swaths of Earth’s surface, and it is impossible to ground truth the entire modeled area. It is also possible that outliers have not been identified and remain in the model. However, with that said, the highest-quality products possible are assured through internal expertise and training through NOAA and its National Centers for Environmental Information, as well as review from internal and external partners and collaborators.
Conclusion
Developing bathymetric-topographic DEMs is a time-consuming and complex process that involves preparing numerous large volume data sets from various sources and integrating them into a seamless product. This process is significantly more challenging for remote areas because data can be sparse. However, with detailed analysis, a high-quality product can be created that reasonably reflects reality and can significantly aid in improving coastal community safety.
Ocean Networks Canada has contributed DEMs to a number of projects in support of coastal community emergency preparedness, including for communities in Haida Gwaii, for northwest Vancouver Island (Kouhi et al., 2022), and through a cross-border collaborative effort as part of the Canadian Safety and Security Program for the lower mainland of southwestern British Columbia. Ocean Networks Canada looks forward to fostering collaborations and supporting future emergency preparedness efforts.