Introduction
Managers of coastal and marine resources need the most current information on changing marine life and environmental conditions. They are responsible for protecting the public and natural resources and are required to meet national, state, and local regulatory and reporting requirements. Biological and biodiversity information is required in US legislation, such as the Magnuson-Stevens Act, the Marine Mammal Protection Act, the National Marine Sanctuaries Act, the Endangered Species Act, the Coordinated Ocean Observations and Research Act of 2020, and in many other statutes from international to state and local levels (Hildreth, 2008; Bax et al., 2019). Ecosystem observations are the cornerstones of marine conservation, management, science research, and education programs. Healthy marine ecosystems form the basis of the livelihood and well-being of numerous communities and industries globally (Estes et al., 2021). Yet biological and ecosystem level observations are often difficult to access, are costly, and are presented in multiple different formats.
A new paradigm, in which data from multiple groups for multiple purposes are shared and are more rapidly available, is emerging with efforts such as the US Marine Biodiversity Observation Network (MBON). Improved delivery of ecosystem assessment information is facilitating Ecosystem Status Reports (ESRs) of the Integrated Ecosystem Assessment (IEA) Program (Harvey et al., 2020; Monaco et al., 2021) and Condition Reports of the National Oceanic and Atmospheric Administration (NOAA) Office of National Marine Sanctuaries. Here, we focus on examples of progress for the California Current Large Marine Ecosystem (CCLME) and Monterey Bay National Marine Sanctuary (MBNMS). Several MBON initiatives integrate existing efforts, advance new modes of observing, and create a scalable framework for addressing regulatory directives. To realize the vision of integrated observing for biology and biodiversity, the MBON program seeks to be integrative and to build new partnerships, many of which are developed around in-kind contributions and the mutual support required to develop common best practices for solving problems through standardized observation methods and applications.
Best practices adopted by MBON contributors are allowing the integration of several forms of data into a common infrastructure. Interoperable data facilitates the development of assessments for National Marine Sanctuaries, California marine protected areas (MPAs), oil and gas development proposals, and proposed wind energy farms. Challenges to delivering this information efficiently include the time required to quality control observations and bringing data into comparable formats. In many cases, format requirements for analytics are not followed by observers, delaying analyses and delivery of information to resource managers.
Within the Central and Northern California region, MBON includes regional partners such as the Central and Northern California Ocean Observing System (CeNCOOS), national partners including the Integrated Ocean Observing System (IOOS), and global partners such as the Group on Earth Observations Biodiversity Observation Network (GEO BON) and the Global Ocean Observing System (GOOS). Individuals from around the world are sharing their data and experiences to reuse and add value to biology and biodiversity information. Here, we describe existing and maturing “building blocks” for improved coordination of the wealth of data collected by these efforts.
Regional Introduction and MBON Project Background
The California Current Large Marine Ecosystem ranges from Baja California to the northern tip of Vancouver Island and encompasses diverse and dynamic oceanic and coastal habitats. It is strongly influenced by seasonal upwelling that supports high primary productivity and fish abundance from the coast to areas far offshore over the deep ocean (e.g., Chavez et al., 2003, 2017; Ruhl and Smith, 2004; Woodson et al., 2012). These phenomena are strongly modulated by interannual variations in basin circulation, such as the El Niño-Southern Oscillation (ENSO), as well as by longer-term variability such as the Pacific Decadal Oscillation (PDO) and the North Pacific Gyre Oscillation (NPGO) (e.g., Mantua et al., 1997; Schwing et al., 2002; Di Lorenzo et al., 2008). In 2014–2016, a large area of the Northeast Pacific became known as the “Warm Blob” (e.g., Bond et al., 2015; García-Reyes and Sydeman, 2017). Such large-scale phenomena can exert a strong influence on marine ecosystem changes (Chavez et al. 2017; Ryan et al., 2017; Barth et al., 2018). On top of such large-scale changes, there is considerable alongshore variability in ecosystem conditions, such as spatial differences in upwelling and CO2 fluxes associated with coastal promontories (Chavez and Messie, 2009; Fiechter et al., 2014).
The Monterey Bay region, located in the south-central portion of the CCLME, is renowned for its marine biodiversity. However, considerable work is needed to synchronize, coordinate, and make biological observing efforts interoperable across the large number of marine science and conservation organizations in the region that represent academic, federal, state, private, and community sectors. In 2014, the Bureau of Ocean Energy Management (BOEM), the National Aeronautics and Space Administration (NASA), and others funded a series of MBON projects through the National Oceanographic Partnership Program (NOPP), including an early project focusing on the central and northern California region and the Florida Keys titled National Marine Sanctuaries as Sentinel Sites for a Demonstration Marine Biodiversity Observation Network (Sanctuaries MBON). Completed in 2020, this project was a collaborative effort between the MBNMS, members of the CCLME IEA team at the NOAA National Marine Fisheries Service Southwest Fisheries Science Center (SWFSC), CeNCOOS, and other regional partners. This Sanctuaries MBON was designed to define essential variables for biological monitoring (Muller-Karger et al., 2018) and to develop eDNA method and application pipelines (Chavez et al., 2021, in this issue), diversity and species richness indices (Santora et al., 2017), assessments of changing biogeographical seascapes (Kavanaugh et al., 2021, in this issue), and data management and information tools to underpin delivery of each of these (e.g., Benson et al., 2021, in this issue), and to provide information for Monterey Bay and Florida Keys National Marine Sanctuaries. These efforts converged on the modern and flexible Darwin Core data standard for biological taxonomic data for operational and research applications. This led to more biological data being made available for public access through automated servers (e.g., a NOAA SWFSC ERDDAP data server; Simons, 2019).
A new MBON project in central California was initiated in 2019 to focus on the quantification of relationships among climate, ocean physics, biogeochemistry, and ecosystem dynamics affecting everything from microbes to top predators. Key aims included improvement of forecasts for forage fish distributions and evaluations of the physical and biological characteristics of the satellite-based seascapes biogeographic classification system (Kavanaugh et al., 2021, in this issue). The CCLME IEA and MBNMS Condition Reports are key delivery targets for the information developed by MBON efforts. The “Central California MBON” complements other regional MBON projects that address similar requirements in southern California, the Pacific Northwest, the Arctic, the Gulf of Maine, and South Florida. These US MBON initiatives, in turn, join projects globally contributing to GEO BON and GOOS.
Understanding Needs and Co-Designing Solutions
The US IOOS program, implemented in central/northern California through the CeNCOOS Regional Association, operates and maintains observing systems, manages data, and adds value through data and information product development, and engages stakeholders regularly (CeNCOOS, 2020). This work has included regional development of technology, methods, and research to understand processes and theory. A substantial focus is working with current and future observing system contributors and the public. Serving diverse stakeholder needs requires communication, consultation, and collaborative approaches—including public-private partnerships. CeNCOOS works with managers at NOAA’s National Marine Sanctuaries and Pacific Fishery Management Council, the California Ocean Protection Council (OPC), and the California Departments of Fish and Wildlife (CDFW), Water (CDW), and Public Health (CDPH) to make the data accessible in formats that meet the needs of users with a variety of technical abilities.
ONMS Condition Reports and Information Needs for Management
NOAA’s Office of National Marine Sanctuaries (ONMS) serves as the federal trustee for a system of National Marine Sanctuaries and Marine National Monuments in the ocean and Great Lakes that were established for resource protection, research, education, and sustainable public use. Sanctuary research and monitoring programs support management efforts by assessing sanctuary change. Conditions within a sanctuary are influenced by a wide variety of ocean and climate drivers, ecological processes, human activities, and actions of adjacent and overlapping management and regulatory entities. One reporting tool developed by ONMS, and first released in 2007, is the sanctuary Condition Report, which provides a summary of resources in a sanctuary, pressures on those resources, current conditions and trends, and management responses to various pressures on the sanctuary ecosystem (ONMS, 2018). These reports are structured around standardized questions that provide a tool for reporting on the status and trends of human pressures, water quality, habitat, living resources, maritime heritage resources, and ecosystem services. Although the structure of a Condition Report is standardized nationally, the content of a report and the indicators used to address questions are sanctuary-specific; therefore, the completeness and impact of a Condition Report depends on the existence and availability of locally relevant observations and their synthesis.
Sanctuary Condition Reports are a fairly new management tool, and so far have been completed at seven- to 10-year intervals. A significant amount of time and resources are involved in the process of updating a report, a large part of which is compiling and summarizing the relevant monitoring data. a For example, the first Condition Report for the MBNMS was published as a large document in 2009 (ONMS, 2009), and a partial update was published in 2015 (ONMS, 2015). Though these reports have provided extensive status and trend information at the time of publication, effective and timely resource management requires status and trend information that is readily updated as new data are collected. The information presented needs to be visually clear, publicly accessible, and understandable by both technical experts and the public.
IEA Program, ESRs, and Information Needs for Management
The need for ecosystem-based fisheries management has become heightened with a rapidly changing ocean and increased interactions between protected species and human activities. The California Current IEA (CCIEA) is managed in part through information from its Ecosystem Stats Reports (ESRs), which integrate ecosystem indicators from many sources including NOAA’s Northwest and Southwest Fisheries Science Centers, fisheries landings, academia, and others (Samhouri et al., 2014; Levin et al., 2014; Harvey et al., 2019). These indicators have also been incorporated into risk analyses (Samhouri et al., 2017) and management strategy evaluations (Dawson and Levin, 2019). Analysis of data is simplified by using standard formats, including the Darwin Core standard for taxonomic data (Benson et al., 2021, in this issue), and serving them together in a web service (ERDDAP) that provides human and machine-to-machine access using software tools of the researcher’s choice. Web services also enable interactive web page dashboards and infographics.
The IEA focuses broadly on ecosystem-based management, including human activities beyond living resource extrac-tion, such as wind energy development, effects of marine traffic on ecosystems, and species range shifts or expansions across jurisdictional boundaries. The ESR is developed annually, focusing on northern, central, and southern regions of the California Current and reporting from physical oceanography up to human dimensions, and is presented to the Pacific Fisheries Management Council every March (Harvey et al., 2019). This report started as a ~1,000-page document (Levin and Schwing, 2011) and has evolved into a 20- to 30-page report with important appendices available online (NOAA, 2021a). Anomalous conditions and ecosystem perturbations have resulted in the appearance in the ESR of new sections focusing on the recent warm water event and human-wildlife conflict such as between whales and crab fisheries (Santora et al., 2020). The CCIEA is also moving toward increased automation and broader partnership beyond the council, recognizing that the tedium of incorporating new data annually limits the growth of new scientific aims.
Delivering Biodiversity Information to Meet Management Requirements
A key challenge in developing a distributed information system is building a common understanding of priorities, requirements, actions, actors, structure, flow, and user values, as well as feedback to drive system improvement (e.g., Iwamoto et al., 2019). MBON helped shape workflows that led to the integration of biological observing information for ocean-health indicator products (see also Benson et al., 2021, in this issue). The workflow facilitates the synthesis of data and integration into web-based tools that summarize ecosystem status and changing conditions. Across the nation, MBON successes include improved access to data repositories, technical innovation, and development of a suite of user-focused products that align with existing management requirements and are responsive to adaptive management needs (Figure 1).
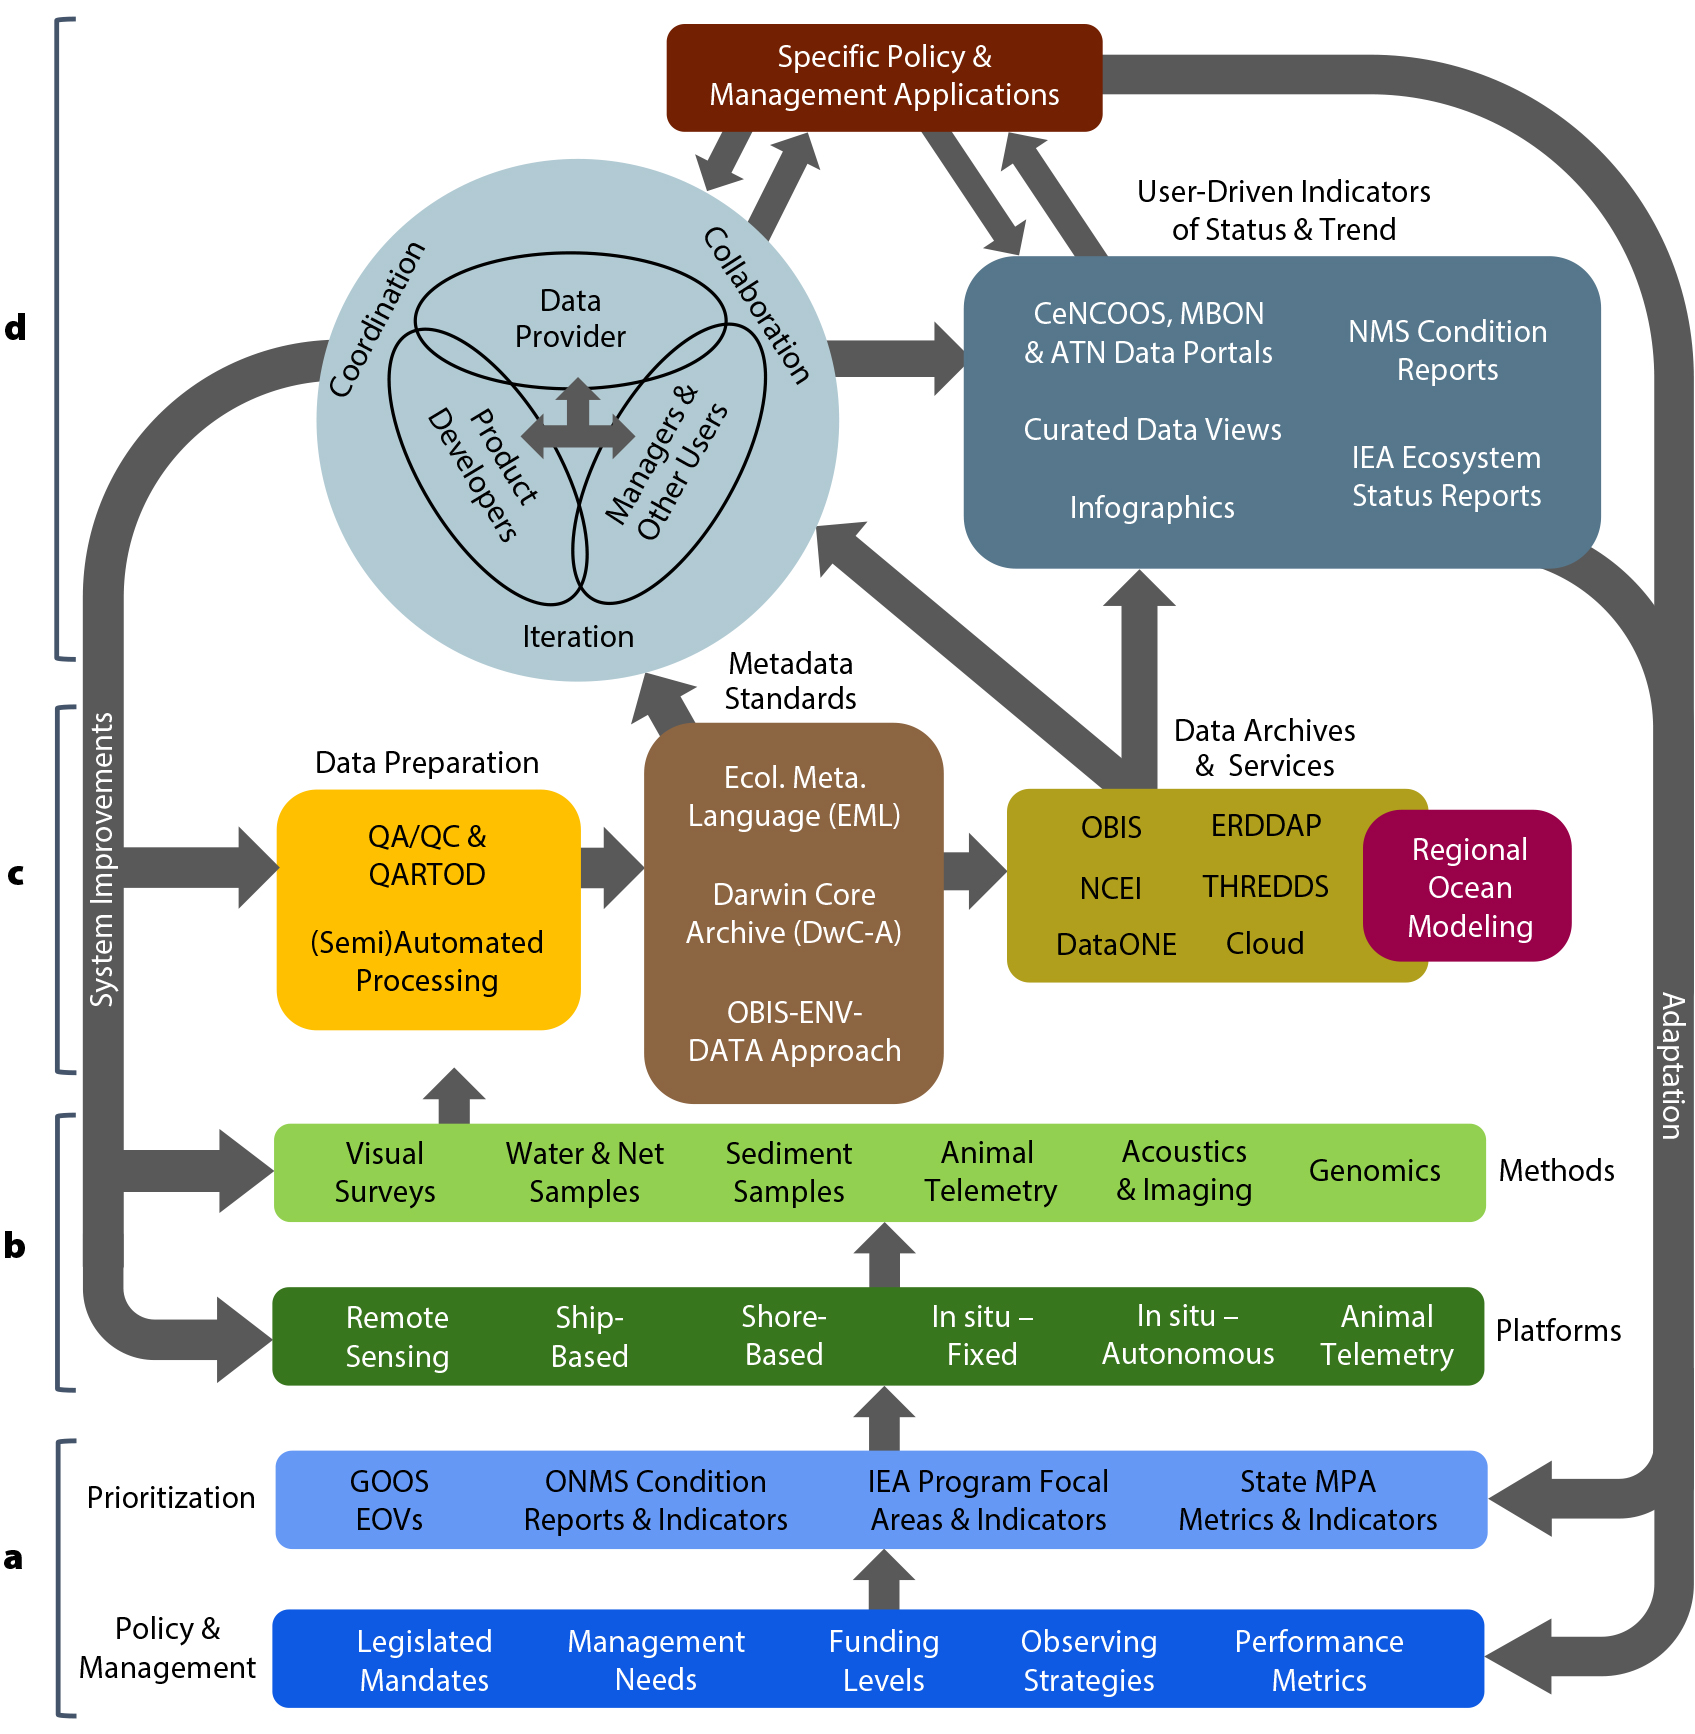
Figure 1. Workflow organogram highlighting MBON-focused sequential and cyclical relationships among (a) policy, management, and prioritization of (b) observing platforms and methods. (c) Application to ocean observing practices and information handling. (d) The evolution of information provision for users in application-specific decision-making. Sections (c) and (d) embody FAIR (Findability, Accessibility, Interoperability, and Reusability) data principles (Wilkinson, 2016). Governance structures operate at various points throughout to implement each system component. > High res figure
|
The quality and availability of marine biodiversity observations are critical for developing products that adequately meet user needs (Bailey et al., 2019; Iwamoto et al., 2019). Building consensus for workflow elements and communicating them to the contributors and users via “datastream plans” leads to efficiency in information flow and delivery of products. Biological data needed for integrated assessments have been available from disparate individuals, networks, and teams, in a variety of formats and with sparse or poorly structured metadata (Buck et al., 2019). A collaborative network, with an operational focus in the IOOS Regional Associations is accelerating discovery and use of biological ocean data through the promotion and uptake of standardized data and metadata services and tools and the application of such workflow planning for access points such as infographics and dashboards.
Prioritizing Data Targets Based on Resource Management Requirements
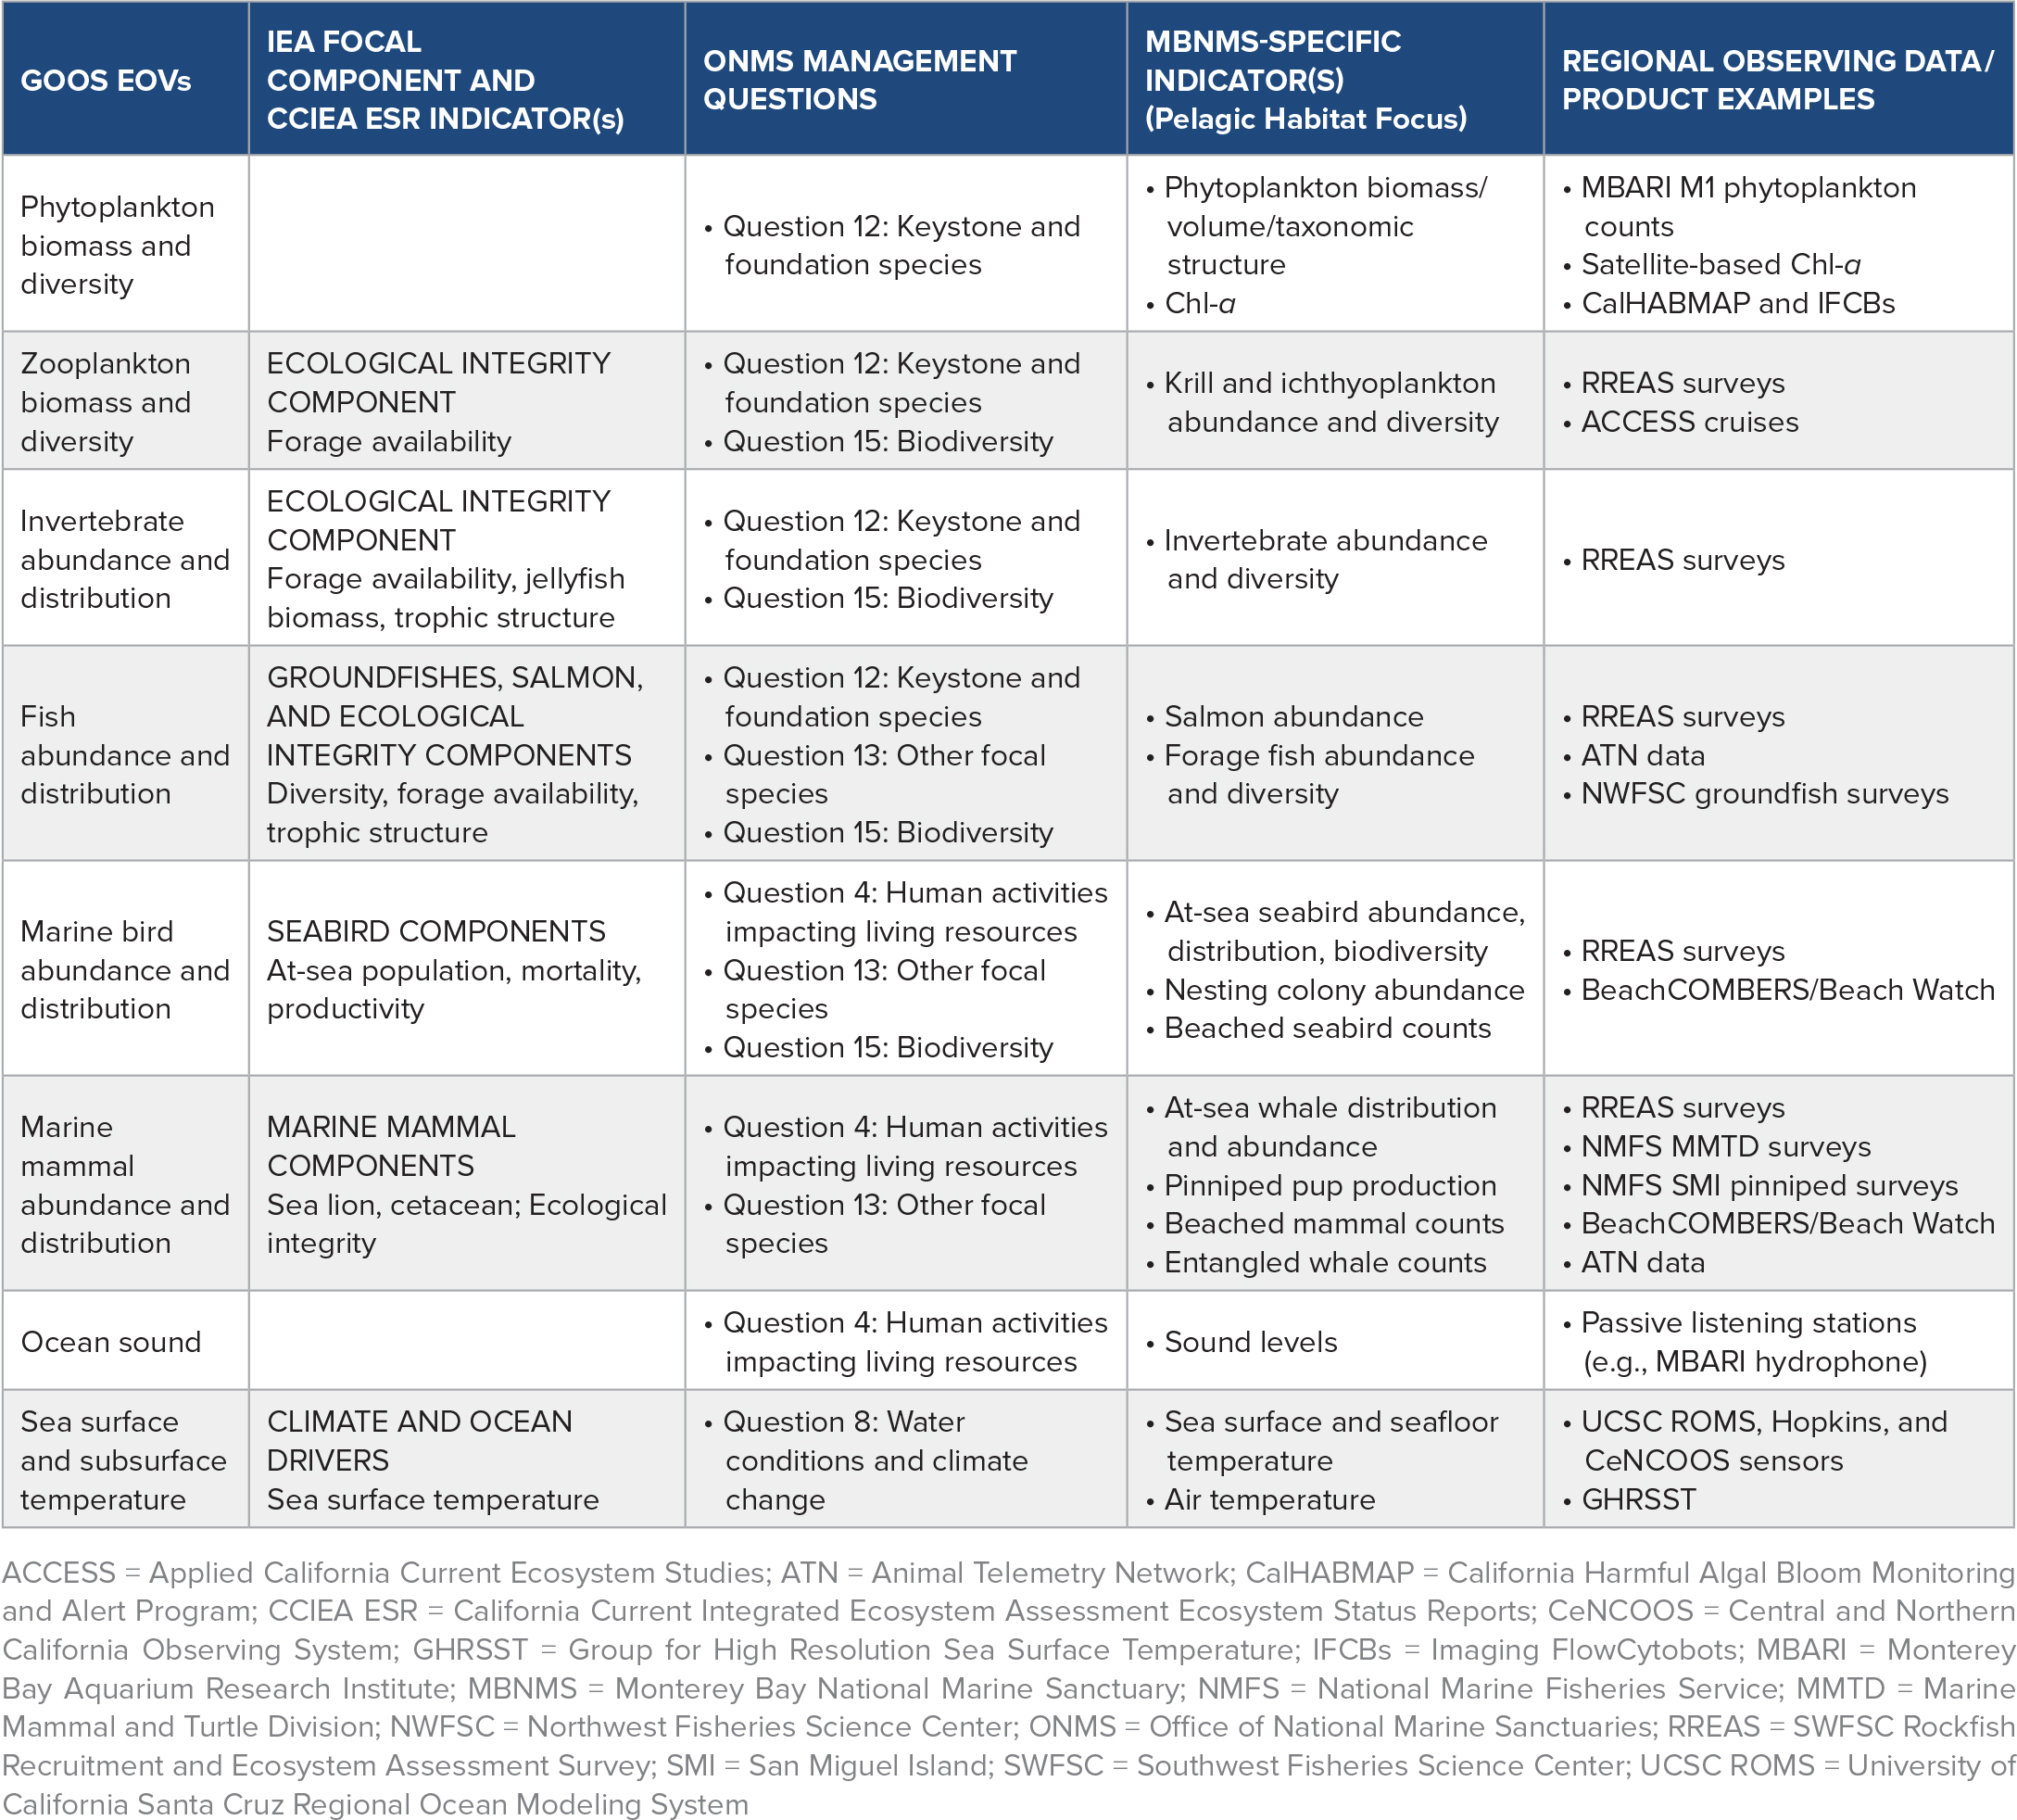
From a management perspective, identifying and prioritizing observing data that align with policy requirements and management priorities is a critical first step (Table 1) toward achieving a workflow that maximizes management impact and focuses limited resource allocation (Figure 1). We assessed which existing and developing observation programs would satisfy multiple management requirements related to GOOS Essential Ocean Variables (EOVs), Sanctuary Condition Report questions (ONMS, 2018), and IEA program focal areas (Figure 1a, Table 1). Monterey Bay National Marine Sanctuary priority indicators are regionally specific, align with one or more Condition Report questions, and inform conditions of one or more of the eight major habitats in MBNMS (Brown et al., 2019). Similarly, CCIEA ESR indicators have been selected to inform Pacific Fisheries Management Council needs (Harvey et al., 2019). This assessment process matched information needs from these management drivers to available regional observing data sources with particular attention to identifying data sources that filled multiple management needs.
Table 1. Priority-setting matrix linking Global Ocean Observing System (GOOS) Essential Ocean Variables (EOVs) with Integrated Ecosystem Assessment (IEA) and sanctuary information needs and examples of observing data that meets those needs. > High res table
|
The assessment identified several high-priority data sets for data integration and product development (Table 1), including remote-sensing satellite data (e.g., sea surface temperature, chlorophyll-a), ship-based net samples (phytoplankton, zooplankton, forage fish, groundfish), shore-based observations (pinniped and seabird colonies, beached carcasses), and ship-based observations (seabirds, mammals, whale entanglements). Specific topics included indicators of biodiversity change at multiple trophic levels; local expression of, and impacts to, water quality and biodiversity during marine heatwaves; and causes of seabird and mammal mortality and whale entanglement. We also highlighted key observing platforms and methods of collecting data for top priority core variables and management requirements (Figure 1b).
Several technology advancements are also improving efficiency of collection and delivery of management priority data sets about the ocean and its diverse species (e.g., Estes et al., 2021). Observations in the established areas of visual surveys, along with water, net, and sediment samples, join emerging methods such as plankton imaging, ocean sound, and multi-trophic level eDNA monitoring that are increasing the quantity and quality of information that supports dynamic management (Figure 1b). In the near-term, researchers and data scientists in the region will be collaborating via MBON and other initiatives to improve automation, including machine learning pipelines. These are steps that are taking what traditionally has been the realm of research into operational biological ocean observing.
FAIR Data Handling and Services
A cornerstone of MBON is to expand capability and capacity for enduring biological and ecosystem data management, data stream planning, reliable dissemination through archives and portals, and the safeguarding of data through metadata and data formatting standards and archiving. An identified need is access to biodiversity data through public portals, such as the Ocean Biodiversity Information System (OBIS, 2021) or the new joint CeNCOOS/SCCOOS (Southern California Coastal Ocean Observing System) Data Portal. This effort is guided by FAIR data principles (emphasizing Findability, Accessibility, Interoperability, and Reusability of digital assets by machines; Wilkinson et al., 2016). This is fundamental to contending with the rapidly increasing volume and complexity of data. In the future, these information delivery systems will be closely coupled with numerical models that will expand the fields spatially and forecast into the future. Models themselves will be part of the quality control system.
Innovations in MBON, CCIEA, and IOOS data management systems include streamlined access to biology and ecosystems data (Benson et al., 2021, in this issue), enabled by data preparations that include quality control, the application of metadata standards, and data and archive services (Figure 1c). This work is supported by the Southwest Fisheries Science Center, CeNCOOS, MBON, and the IOOS Animal Telemetry Network (IOOS, 2021a), along with Earth Science Information Partners (ESIP) programs. Examples of data preparation include the application of the Quality Assurance/Quality Control of Real Time Oceano-graphic Data (QARTOD; IOOS, 2021b) system to flag suspect or erroneous data, and (semi)automated processing of video and still-image photographic surveys, ocean sound, and marine genomic information including eDNA. Machine readable metadata standards including Ecological Metadata Language (EML) and Darwin Core (Wieczorek et al., 2012; TDWG, 2021) enable data on servers to feed into a variety of web portals and infographic tools. Metadata formatting using the OBIS ENV-DATA approach enables linking of a wide variety of information, including attributes like abundance, body size, and biomass, or habitat and environmental information related to the sample (DePooter et al., 2017). Practitioners follow international guidelines such as the GOA-ON metadata standard for biogeochemistry (Newton et al., 2015), the World Register of Marine Species (WoRMS Editorial Board, 2021), and those designed for the training of artificial intelligence tools.
The open source ERDDAP data server developed by NOAA provides a simple consistent way to make data available using a web interface or machine-to-machine transfer. This enables brokering between data centers with no separate dedicated infrastructure (Buck et al., 2019). Geospatial and model data are also frequently made available through Thematic Realtime Environmental Dis-tributed Data Services (THREDDS) servers. For example, the Rockfish Recruitment and Ecosystem Assessment Survey (RREAS; Sakuma, et al., 2016; Santora et al., 2021, in this issue) was an early candidate for prototyping the MBON data flow process. The Fisheries Ecology Division (FED) of SWFSC has conducted this midwater trawl survey off central California since 1983 with the primary goal of developing pre-recruit indices for young-of-the-year (YOY) rockfish (Sebastes spp.). The survey also samples numerous other components of the epipelagic micronekton. These data were made available for machine-to-machine access via ERDDAP directly from a relational database (PostgreSQL), updated regularly, aligned to Darwin Core, uploaded to GBIF (Field et al., 2019), and made available in OBIS.
Co-development of Dynamic Data Products for Status and Trends
Delivering effective products for management and policy applications requires early and repeated coordination among data providers, product developers, and managers and other users, to facilitate collaboration and iterative product development (Figure 1d). The MBON team developed a number of products in collaboration with and for specific users, including sanctuary managers, scientists, educators, fisheries management councils, and CeNCOOS stakeholders. Some examples follow.
Interactive Infographics
The MBON project developed and implemented interactive infographics in collaboration with various groups, including the regional IEA programs, IOOS, and sanctuary teams. Interactive infographics deliver sanctuary-specific data products for assessing and interpreting ecosystem status and trends. The infographics use web-enabled technologies, including open-source software and data, to link illustrations of ecosystem elements to complex underlying time series of observations. This link allows users to quickly see trends and background information in a multimedia format. Interactive infographics have gained interest regionally, nationally, and internationally as a highly successful and innovative way to serve data visualizations.
For the California set of MBON efforts, the ecosystem illustrations were created in collaboration with the California Current IEA graphic designer (Su Kim, NOAA). They show Condition Report indicators in each of a sanctuary’s major habitats (background scene) using ecosystem elements (e.g., icons of fish, plankton, kelp, and climate drivers and human uses) (Figure 2a; Brown et al., 2019; Spector et al., 2021). An interactive infographic framework was developed (using D3 JavaScript, R, and Rmarkdown software) to link the ecosystem elements in the illustration to pop-up windows showing one or more figures along with the latest associated data visualization (e.g., time series, map, chart). The websites and versioned source code are hosted at https://github.com/ and updated using the Travis continuous integration web service. The storage requirements are modest (<1 GB) and computation requirements are also minimal (<1 hr). Example MBON infographic products are available on GitHub (Best and Ranganathan, 2021). Infographics code is free, open for use by anyone, and described in more detail in Spector et al. (2021).
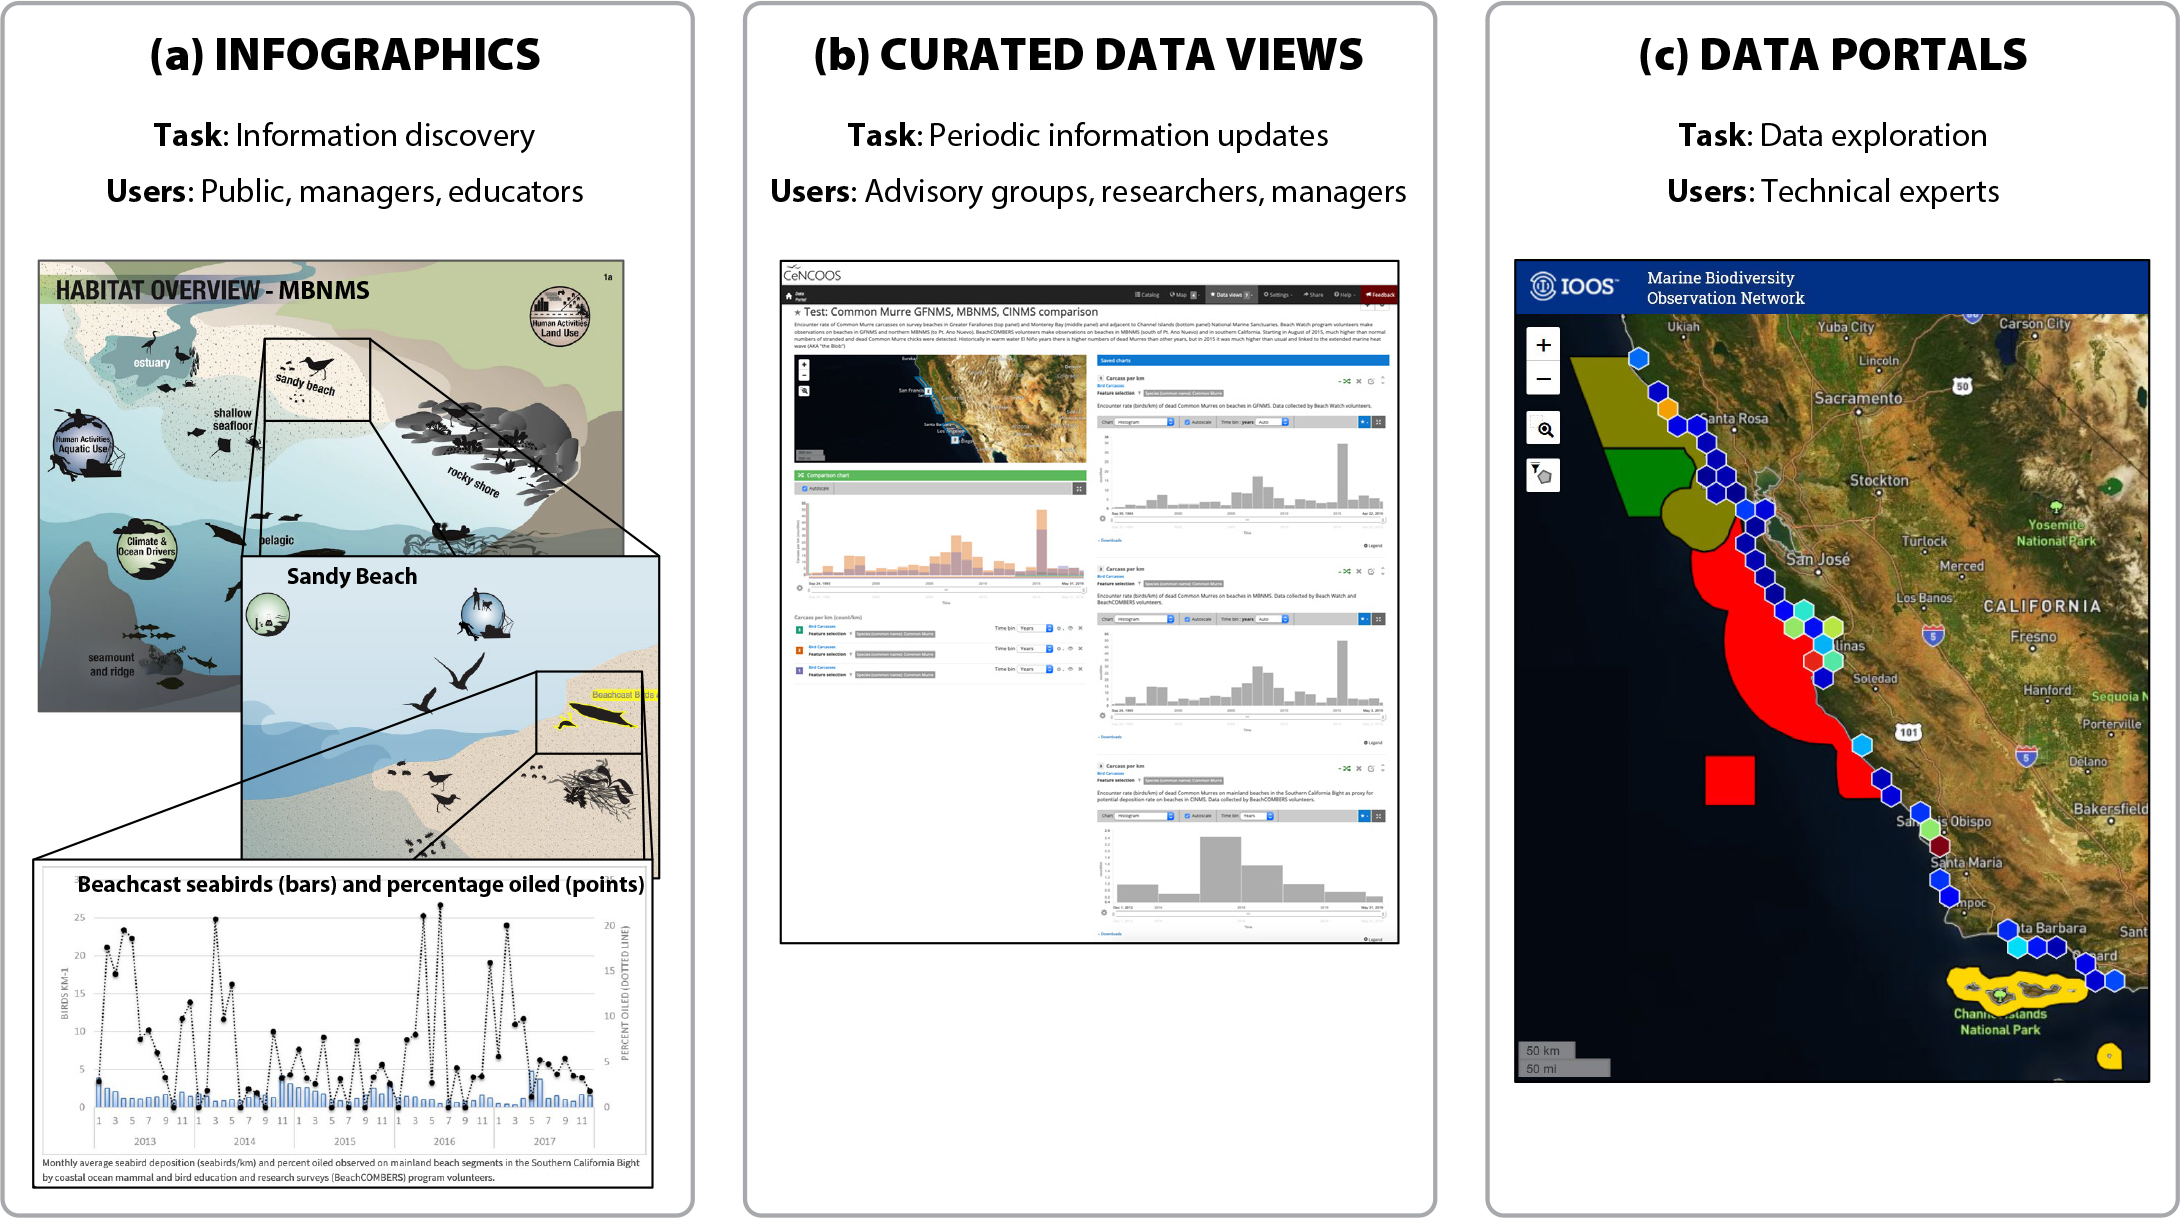
Figure 2. Tiered data products targeting different audiences from general to expert users. (a) Interactive infographics provide status and trend information that is visually appealing, publicly accessible, and easily understood by both technical and nontechnical users. (b) Curated data views provide updates to a set of interrelated metrics for a more involved user, such as those involved with a monitoring program, a management issue, or an advisory group. (c) The MBON Data Portal and new joint Central and Northern California Ocean Observing System/Southern California Coastal Ocean Observing System Data Portal facilitate data visualization, exploration, and manipulation by the most technically adept users, including data providers and subject experts. > High res figure
|
MBON and CeNCOOS Portals with Curated Data Views
Sanctuary science teams and advisory panels may on occasion need access to research and assessment tools with more technical capabilities than are offered in the interactive infographics. For more expert users, the ability to discover, explore, and manipulate data is available through the MBON and the new joint CeNCOOS/SCCOOS Data Portals (Figure 2c) and catalog tools.
Customizable curated data views such as those generated within these portals show multiple graphical plots that relate to a specific scientific or Condition Report question or to a management issue (Figure 2b). Metrics and graphs are predetermined to ensure that all users are viewing and evaluating the same information, but the user can change timescale and other features to explore the displayed information. These views can illustrate change over time and space for specific areas and analytics that describe relationships between variables, and they provide context for change in larger regions or reference areas. For example, one view might illustrate patterns in satellite-based sea surface temperature and species richness of the pelagic forage community, along with encounter rates of seabird carcasses. Curated data views can be modified to update the data for every viewing or on a periodic basis, and the URL can be copied and sent to other users, who could then render the same catalog view and illustrations on a separate computer.
Options for curated data views include satellite, ocean model, and in situ data sets from large programs, smaller initiatives, and individual researchers and citizen scientists. Tools available in the CeNCOOS and MBON portals have been developed that quantify changes in regional climate variation, sea surface temperature, heat content, surface currents, wave height and direction, and net primary production, and these can be combined with observations of habitat, biomass, community composition and/or species change. Summary forms of this information can be provided as ecological indicators and report card categorizations of conditions. Analytics for specific marine spaces and reference areas can also be digested for inclusion into infographics and other tools suitable for more a general audience.
CASE STUDY
BeachCOMBERS: A California Network of Volunteer Observers
A case study from the BeachCOMBERS seabird and mammal stranding survey initiative provides an example of prioritization to end-user workflow (Figure 1). When a stranding or mortality event is observed on local beaches, it can be challenging to determine whether the event is natural or related to issues such as harmful algal blooms (HABs), oil spills and seeps, ingestion and entanglement in marine debris and fishing gear, local prey availability, or vessel strikes. Detailed information on extent and duration of wildlife mortality events can help managers determine causes and develop mitigation strategies for the future. In the fall of 2015, increased numbers of dead and stranded juvenile common murres were observed on central California beaches. This was later linked to the prevalence of warm water and low prey conditions along the coast (Gibble et al., 2018) and then to an extended marine heatwave (Piatt et al., 2020). CeNCOOS worked with data providers to aggregate beach surveys of marine mammals and seabirds from BeachCOMBERS, Beach Watch citizen science programs, and the Marine Mammal Stranding Program at Humboldt State University. These data now form the “Effort-based surveys, Northern and Central California Beaches: Seabirds and Marine Mammals” data product that combines surveys over a 25-year period from Del Norte to Los Angeles Counties. This harmonized data product is now available for exploring through the CeNCOOS/SCCOOS Data Portal.
Once data are available through ERDDAP data services, tiered data products are developed with input from BeachCOMBERS and sanctuary resource protection and education staff (Figure 2). Integration of seabird and mammal stranding data into the CeNCOOS/SCCOOS portal allows BeachCOMBERS researchers and partners to easily visualize observations to better explore potential causes of seabird and marine mammal strandings and inform potential management actions to reduce wildlife impacts from human activities. To engage a wider audience that includes managers, educators, and the interested public, we incorporated BeachCOMBERS summary data into interactive infographics as described above (Figure 2a). A set of curated data views were developed to showcase the same metrics regularly provided by BeachCOMBERS in their periodic technical reports (Figure 2b) and used in sanctuary Condition Reports. The most technically adept users of MBON data products, including data providers and subject experts, will be able to discover, explore, and manipulate data using the CeNCOOS/SCCOOS portal (Figure 2c). Lastly, seabird mortality rates based on stranded carcass counts from BeachCOMBERS and Beach Watch are presented as indicators of seabird mortality rates in the CCIEA’s annual Ecosystem Status Report to the PFMC (Harvey et al., 2019) and in the CCIEA (NOAA, 2021a,b).
|
Maturing Technologies and Data Streams for Biology and Biodiversity Observing
The policy, management, and related observing drivers identified in Table 1 motivate the development of new methods and their transitions from research into sustained applied observations. Biological observing methods that can address priority needs and that are becoming more feasible include those in genomics, imaging, animal tagging, and passive acoustic and satellite-based monitoring (see also Estes et al., 2021).
Environmental DNA (eDNA)
Traditional field methods for observing biodiversity are expensive, require intensive human intervention, and are time-consuming. Examples include ship expeditions that use net trawls or visual diver surveys in shallower waters. In most cases, these surveys only cover one or two trophic levels, a limited number of taxa, and rely on expert taxonomists. Environmental DNA is a method to survey organisms that may be present in an area by examining the genetic material left behind suspended in the seawater. The approach is akin to that of a forensic scientist who searches for human material left behind at a crime scene, extracts the DNA from that material, and compares it to a bank of suspect DNA to find a match. In the case of eDNA, the material left behind by the suspects is collected by filtration and our suspects are life in the sea at every trophic level.
During the first Sanctuary MBON project, the team developed best practices for using eDNA including the use of a routine set of markers that cover the tree of life, from microbes to whales (Chavez et al., 2021, in this issue). The team made systematic collections throughout the Florida Keys and Monterey Bay National Marine Sanctuaries, as well as offshore Santa Barbara, Hawai’i, and Peru. Frozen samples were exploited to develop decade-long time series. The results, together with many others in the growing literature, show that eDNA is a useful method for discriminating changes in marine communities over time and space (horizontally from sanctuary to sanctuary and vertically with depth). During the follow-on MBON projects, the teams in different projects are working on resolving many of the challenges associated with eDNA as well as exploiting the opportunities. Sampling is being expanded to the full CeNCOOS domain and elsewhere, and efforts are being made to transition the work from research to operations, such as in data processing and management to deliver information on the occurrences of managed and protected species.
Phytoplankton Surveys and HAB Monitoring
Biological sampling of phytoplankton is frequently limited by logistical constraints (including geographic location, depth, sample acquisition methodology, handling, processing). As a result, historical sampling density is considerably more coarse spatially and temporally than physical and chemical measurements. The rapid maturity of new technologies such as the Imaging FlowCytobot (IFCB) begins to address these issues. The IFCB is an automated flow cytometer with imaging capabilities (i.e., an automated microscope; Sosik and Olson, 2007). It can sample every 25 minutes from fixed locations, ships, and autonomous vehicles. When the IFCB is coupled with tools for automated classification of images, the system produces phytoplankton abundance estimates of species- and genus-level taxa in near-real time (e.g., Fischer et al., 2020). Four instruments have routinely been deployed off California with support from NOAA and the National Science Foundation. In 2020, the California Ocean Protection Council expanded this network to include 10 instruments, with two deployed on coastal moorings and several alternating between shipboard and fixed location sampling. One goal is to support the California Harmful Algal Bloom Monitoring and Alert Program (HABMAP). The network will also be used to explore the largely beneficial plankton community structure and biodiversity across a wide swath of the California Current System, as this is the food and energy foundation for the coastal marine ecosystem in this region.
A key metric for success is the establishment of coordinated operations and centralized data management designed to scale to a national network as such data become increasingly common within IOOS. For example, the rich data set from the Santa Cruz Municipal Wharf (Figure 3) is becoming more widely available. The HAB organism Pseudo-nitzschia is quickly and reliably quantified using the IFCB and computer vision tools. The data also show an unusual dominance of dinoflagellates in 2018 related to local environmental forcing (Fischer et al., 2020). The true power of these analyses will be realized when the full suite of 10 instruments can provide a picture of plankton dynamics across the California Current system, including HAB species bloom extent and duration.
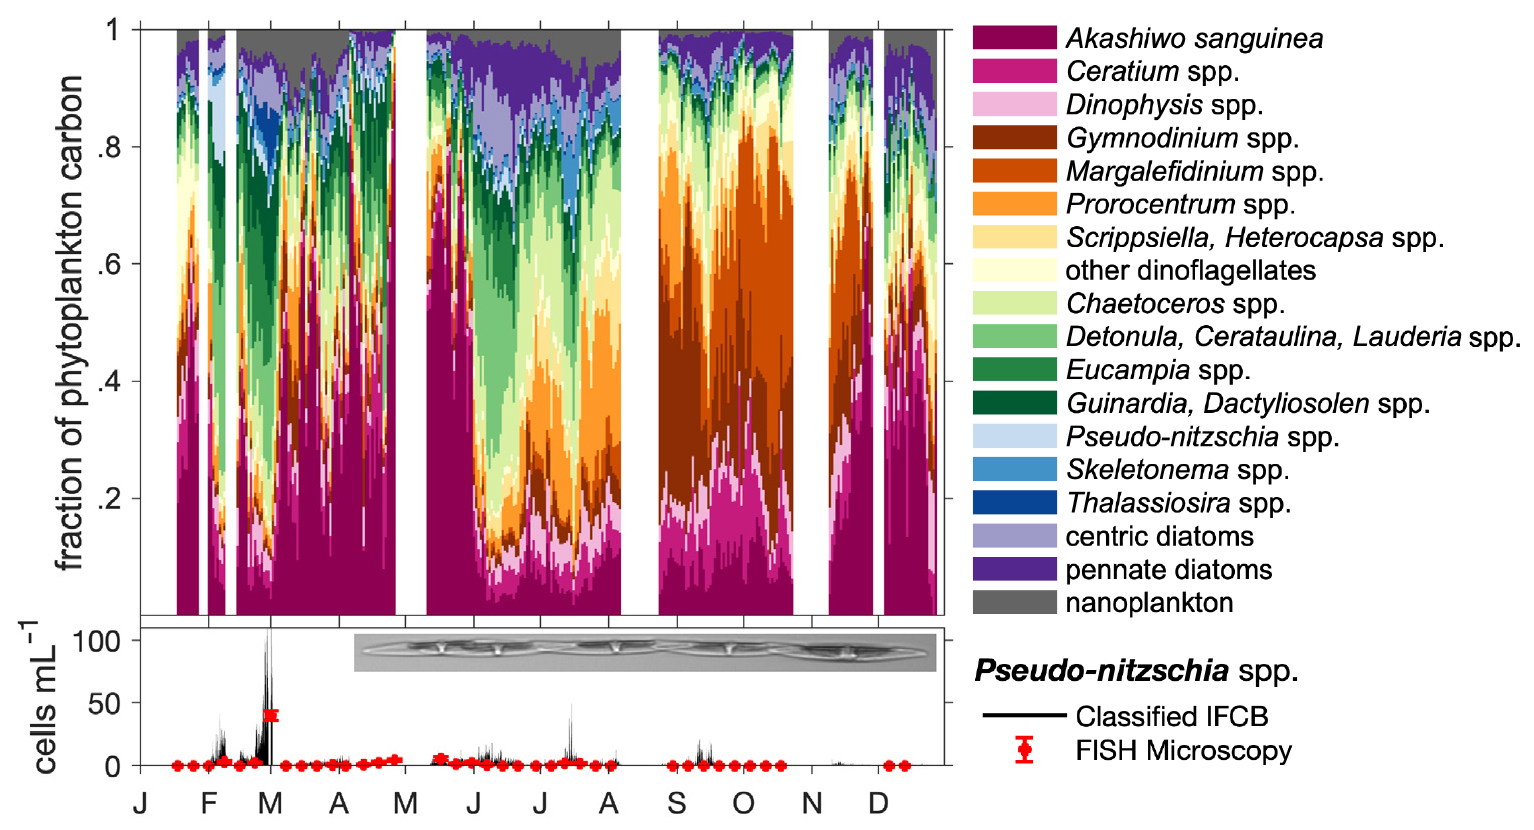
Figure 3. Daily time series of phytoplankton-specific carbon fractions (top) and Pseudo-nitzschia spp. cell concentrations (bottom) generated by an Imaging FlowCytobot (IFCB) at the Santa Cruz Municipal Wharf (Monterey Bay, California) in 2018 and a machine learning image classifier. The top panel shows the fraction of phytoplankton-specific carbon composed of dinoflagellate taxa (pinks, reds, oranges, yellows), diatom taxa (greens, blues, purples), and nanoplankton (gray). The bottom panel shows the same time series for the toxic diatom genus Pseudo-nitzschia compared to weekly Fluorescent In Situ Hybridization (FISH) microscopy of discrete samples; the inset image provides an example of an IFCB image for Pseudo-nitzschia. White bands indicate data gaps. Adapted from Fischer et al. (2020). > High res figure
|
Imaging with Cameras on Gliders and Other Platforms
The recent development of a microscopic camera system for gliders is paving the way to greater availability of marine snow and zooplankton abundance and diversity information (Lombard et al., 2019). For example, the Zooglider, developed at the Scripps institution of Oceanography, has photographic and acoustic zooplankton sensing capability (Ohman et al., 2019). Image data can be processed using automated object detection and classification. Expanded use of such tools on gliders and long-range autonomous underwater vehicles in IOOS could provide profiles and repeat ocean transects of zooplankton variables with high spatial and temporal resolution. This could deliver data for the Ecological Integrity category of the CCIEA, specifically copepods, including northern and southern copepods as well as krill including Euphausia, Pyrosoma, Aurelia, Chrysaora, Aequorea, and fish larvae. These tools could also deliver biodiversity information for MBON and the MBNMS “Zooplankton species/abundances” Condition Report indicator. Other tools are also maturing using a variety of approaches including holography, structured light, and confocal imaging across a wide range of object sizes (Lombard et al., 2019).
Animal Tagging
The Animal Telemetry Network (ATN) is building partnerships and data handling capability for animal tag sensor data. This method can collect information about the ecology and physiology of tagged individuals and serve as a source of operational oceanographic data (Sequeira et al., 2018; Harcourt et al., 2019). Depending on the tagged species, thousands of profiles can be collected on temperature, salinity, and other information to hundreds of meters depth and/or ocean sections covering thousands of kilometers in range (e.g., Naito et al., 2017; McHuron et al., 2018). By tagging across several taxa, such as tuna, sharks, and seals, it is possible to cover an wide range of ocean observations that can provide critical information for how changes in the MBNMS interact with variations occurring in the greater northeastern Pacific. Critically, this information can come associated with the movements of managed species and has policy applications such as understanding ranges, connectivity, and movements in and out of marine protected areas (Dunn et al., 2019).
Ocean Soundscapes
Passive acoustic monitoring (PAM) is essential to understanding marine biodiversity (Mooney et al., 2020). By enabling detection of the presence and behavior of soniferous animals, including mammals and fish, PAM expands knowledge of the species inhabiting an ecosystem far beyond what can be achieved using only visual surveys. Because sound travels so effectively in marine waters, PAM can also provide far-reaching detection ranges, up to hundreds of kilometers for the powerful, low-frequency calls of endangered blue and fin whales (Figure 4). Further, the temporal coverage of biodiversity monitoring for soniferous species is greatly enhanced by the potential for PAM to provide continuous data. Integrative application of PAM and animal-borne sensing in MBNMS has enabled detection of blue whale migration, a new capability applicable to protection of this endangered species (Oestreich et al., 2020). Together with effective ecosystem monitoring, relationships between ecosystem dynamics and marine mammal behavior can be examined (Ryan et al., 2019). This method is now being tested for long-term monitoring in marine sanctuaries (SanctSound program) and in the context of marine mammal indicator data for IEAs.
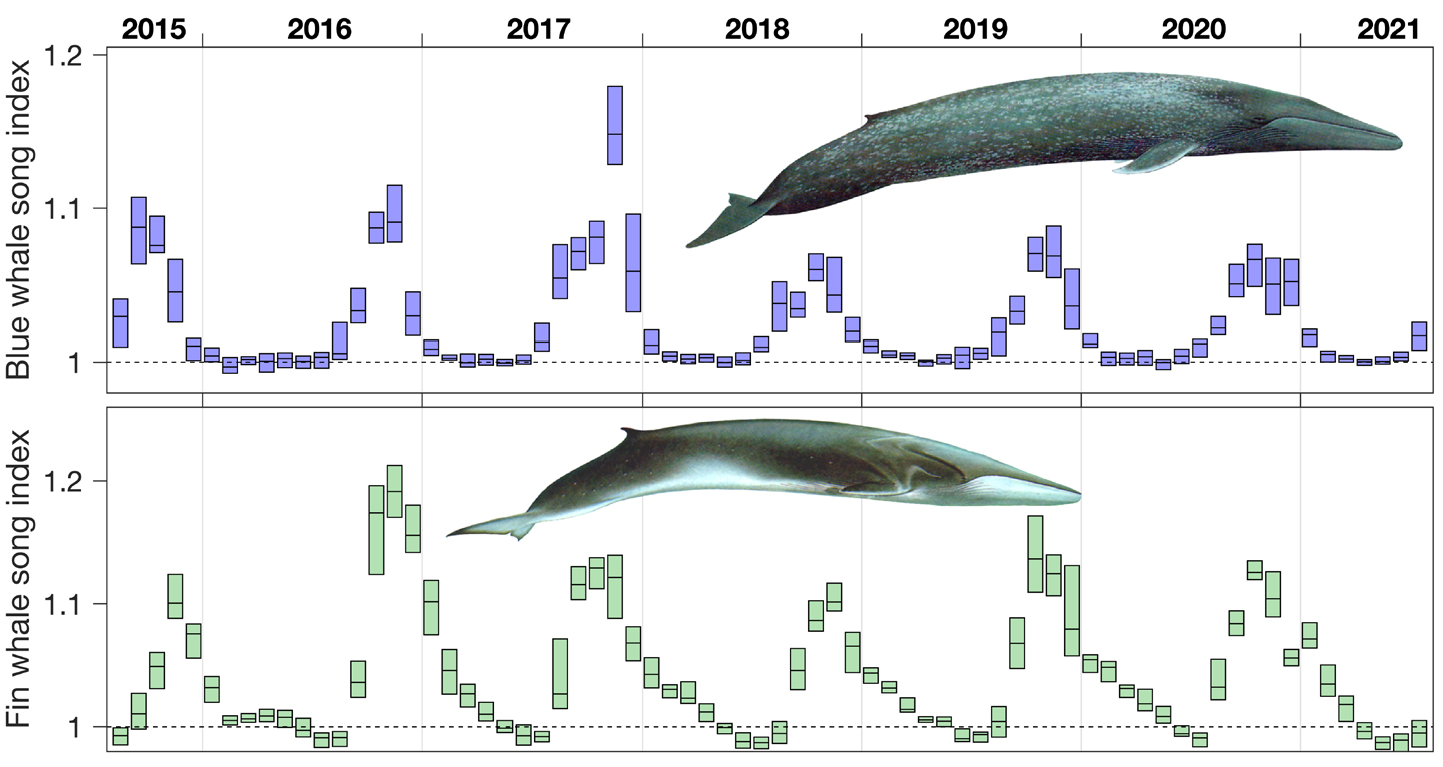
Figure 4. Acoustic indices of blue and fin whale vocal activity recorded in Monterey Bay National Marine Sanctuary through the Monterey Accelerated Research System (MARS) cabled observatory. The index is a calibrated signal-to-noise ratio: signal from whale song (rhythmic repeated sequences of sound produced by males of each species) and noise from background (adjacent frequency bands). For each month, the interquartile range and median are shown. Whale artist: Larry Foster. > High res figure
|
By enabling detection of anthropogenic noise in the ocean, PAM also supports research that is essential to an emergent dimension of ocean stewardship—protection of acoustic habitat (Southall et al., 2009; Gedamke et al., 2016; Hatch et al., 2016). While acute noise sources have received attention due to dramatic impacts on marine mammals observed in some regions, chronic noise is recognized as a global issue that must be addressed regionally through ecosystem-based management (Hatch et al., 2016). Within MBNMS, noise from seal bombs—explosives used in fishing operations with the goal of deterring interference in fishing operations by sea lions, seals, and dolphins—has been a focal research topic (Simonis et al., 2020). PAM revealed occurrence patterns, with up to 88 explosions per hour, while modeling of acoustic transmission revealed the far reach of noise from individual explosions across tens of kilometers. Persistent PAM in MBNMS has also emphasized the ephemeral nature of noise pollution and the associated potential for rapid improvement in habitat quality through noise reduction, as diminished shipping traffic during the COVID-19 pandemic significantly reduced noise within the frequency band used by baleen whales to communicate (Ryan et al., 2021).
Achieving the Vision of MBON
Marine ecosystems are undergoing rapid change (Bindoff et al., 2019; Blowes et al., 2019). Around the globe, rates of change in species distribution, abundance, and biodiversity often outpace our ability to monitor or measure them. The CCLME harbors a diverse array of life, including some of the most diverse algal flora and marine mammal fauna in the world (Checkley and Barth, 2009; Fautin et al., 2010; Block et al., 2011). Its resources sustain major economic activity and food security. The CCLME is also one of the most robustly observed systems in the world (e.g., Chavez et al., 2017; Barth, 2018; Chan et al., 2019; Gallo et al., 2019). Yet even in this well-studied region, major challenges persist in collecting and delivering biological and ecosystem data and information suitable for understanding, managing, and adapting to ecosystem changes and human activities. Anthropogenic pressures include climate change and ocean acidification, as well as the tourism, shipping, and natural resource extraction industries.
As data management and information dissemination tools evolve in our region and across the IOOS Regional Associations, the capacity to deliver more MBON products with (semi-) automated updating can become a standard for sanctuaries and IEAs across the national system. Biological data at its most advanced or “mature”’ stage is defined by the generation of routinely available and relevant information products (IOOC BIO-TT, 2016). Observational data collection approaches, including those that are currently maturing from research to operational domains, are delivering a greater selection of the EOVs in biology and ecosystems. This, in turn, will empower an evolution in estimating and modeling the current ecological state, and forecasting into the future, and it will require improved quantity and quality of data in order to parameterize models and improve them through assimilation. The processes described here are now also benefiting condition report work for the Cordell Bank and Greater Farallones National Marine Sanctuaries, as well as marine protected area assessment in California.
Ecological forecasting examples from the central and northern California region include EcoCast, which guides fishing based on drivers of both target and bycatch distribution estimation (Hazen et al., 2018); the California-Harmful Algal Bloom Risk Mapping (C-HARM) model (Anderson et al., 2016); and physical, biogeochemical, and ecological modeling of the California Current that includes an iteration of the North Pacific Ecosystem Model for Understanding Regional Oceanography (NEMURO; Kishi et al., 2007; Fiechter et al., 2014). There are excellent opportunities for using and improving these tools more effectively and for including such capabilities in anticipated advancements in modeling such as the use of the West Coast Operational (Ocean) Forecast System (Kurapov et al., 2017) and addition of biogeochemical and ecological modeling capabilities.
Integration of biology, biodiversity, and ecosystem observations into a coherent system of environmental observing could bring valuable information to new and diverse users. Coordination is a limiting factor in the ability of researchers and funding entities to adequately serve stakeholder communities and the public. In order to deliver information at the level of the CCLME, better synchronization of information resources could be achieved through a “West Coast Marine Biodiversity Observing Network” encompassing the West Coast Ocean Alliance, the West Coast IOOS Regional Associations, and ONMS and IEA efforts, as well as the many governmental, nongovernmental, academic, industry, education, and other organizations that make up these associations. This West Coast synchronization could build consensus and improve efficiencies among researchers and observing practitioners, help to coordinate funding resources, and promote a more effective understanding of our marine biological resources and ecosystems. Moreover, such an effort can inform possible practices for mitigation or adaptation to change, including expansion in the renewable energy, desalination, and aquaculture industries. Implementing these practices will require prioritizing increased knowledge of the marine environment and the life it supports.
ACKNOWLEDGMENTS
This work was made possible in part by efforts of NOAA, including the Integrated Ecosystem Assessment, the Office of National Marine Sanctuaries, the National Marine Fisheries Service, Integrated Ocean Observing System, and Marine Biodiversity Observation Network. Support funding included the project “National Marine Sanctuaries as Sentinel Sites for a Demonstration Marine Biodiversity Observation Network (Sanctuaries MBON)” (NASA Grant #NNX14AP62A) and its follow-up projects “The CeNCOOS MBON: Integrating remote sensing, in situ data and models to understand central California ecosystem responses to environmental change” (NASA Grant# 80NSSC20M0001), and “Implementing a Marine Biodiversity Observation Network (MBON) in South Florida to Advance Ecosystem-Based Management” (NASA Grant # 80NSSC20K0017; ONR/NOAA/US IOOS grant NA19NOS0120199), awarded through the National Ocean Partnership Program (NOPP). NOPP includes contributions from BOEM, NASA, ONR, and NOAA. Thanks to Steve Gittings and Gabrielle Canonico for reviewing drafts of this manuscript.