Oceanography The Official Magazine of
The Oceanography Society
Volume 35 Issue 3-4

View Issue TOC
Volume 35, No. 3-4
Pages 103 - 105

OpenAccess

SIDEBAR • Increasing Freshwater Fluxes from the Greenland Ice Sheet Observed from Space

By Bert Wouters  and Ingo Sasgen 
Jump to
Full text Citation References Copyright & Usage
Full Text

With a potential sea level contribution of 7.4 m (Morlighem et al., 2017), the Greenland Ice Sheet is by far the largest freshwater reservoir in the Northern Hemisphere. In addition to precipitation that nourishes the ice sheet throughout the year, summer above-freezing temperatures cause surface melt. Part of the meltwater refreezes in the snowpack, but a considerable part runs off to the ocean. The difference between precipitation and runoff is referred to as the surface mass balance (SMB). Typically, when averaged over a year, snowfall exceeds runoff, resulting in accumulation of mass on the ice sheet. This mass gain is counteracted by the slow but steady flow of glacier that transports ice toward the margins of the ice sheet and eventually to the ocean, where it either melts or calves as icebergs.

For an ice sheet to be in balance, the input (SMB) and output (ice discharge) terms need to equal each other. This balance held until the 1980s (Mouginot et al., 2019), when SMB gradually started to decrease. Regional climate models show that precipitation has remained about constant, but atmospheric warming has resulted in a dramatic increase in meltwater production. Comparing the period 1990–2015 against 1960–1989 shows an increase in melt volumes of more than 30%, with melt now exceeding precipitation in some years (van den Broeke, 2016). The second component of the mass balance equation—ice discharge—was relatively stable until the early 2000s, when widespread retreat and acceleration of the glaciers occurred, resulting in an approximately 14% increase in ice discharge (King et al., 2020).

Together, these shifts moved the ice sheet into a state of disequilibrium, reducing the volume and mass of the ice sheet, while at the same time adding to sea level rise. The associated redistribution of mass on Earth’s surface can be observed by NASA’s Gravity Recovery And Climate Experiment (GRACE; 2002–2017) and its successor GRACE-FollowOn (GRACE-FO; 2018–present). Both missions consist of two satellites following the same near-polar orbit but separated by about 220 km. Rather than measuring mass redistribution on Earth’s surface directly, GRACE measures local changes in Earth’s gravitational field due to this redistribution. Because the gravitational force acting on the satellites is inversely proportional to the square of the distance to the attracting mass (see Newton’s Law), the impact of a local mass redistribution on the orbit of the leading satellite will be different from that of the trailing satellite. This results in constant changes in the intersatellite distance on the order of microns, which are continuously measured using a ranging system onboard the satellites. From this, monthly estimates of anomalies in Earth’s geoid are estimated, which in turn can be converted to surface mass loading anomalies (Wahr et al., 1998; Tapley et al., 2019).

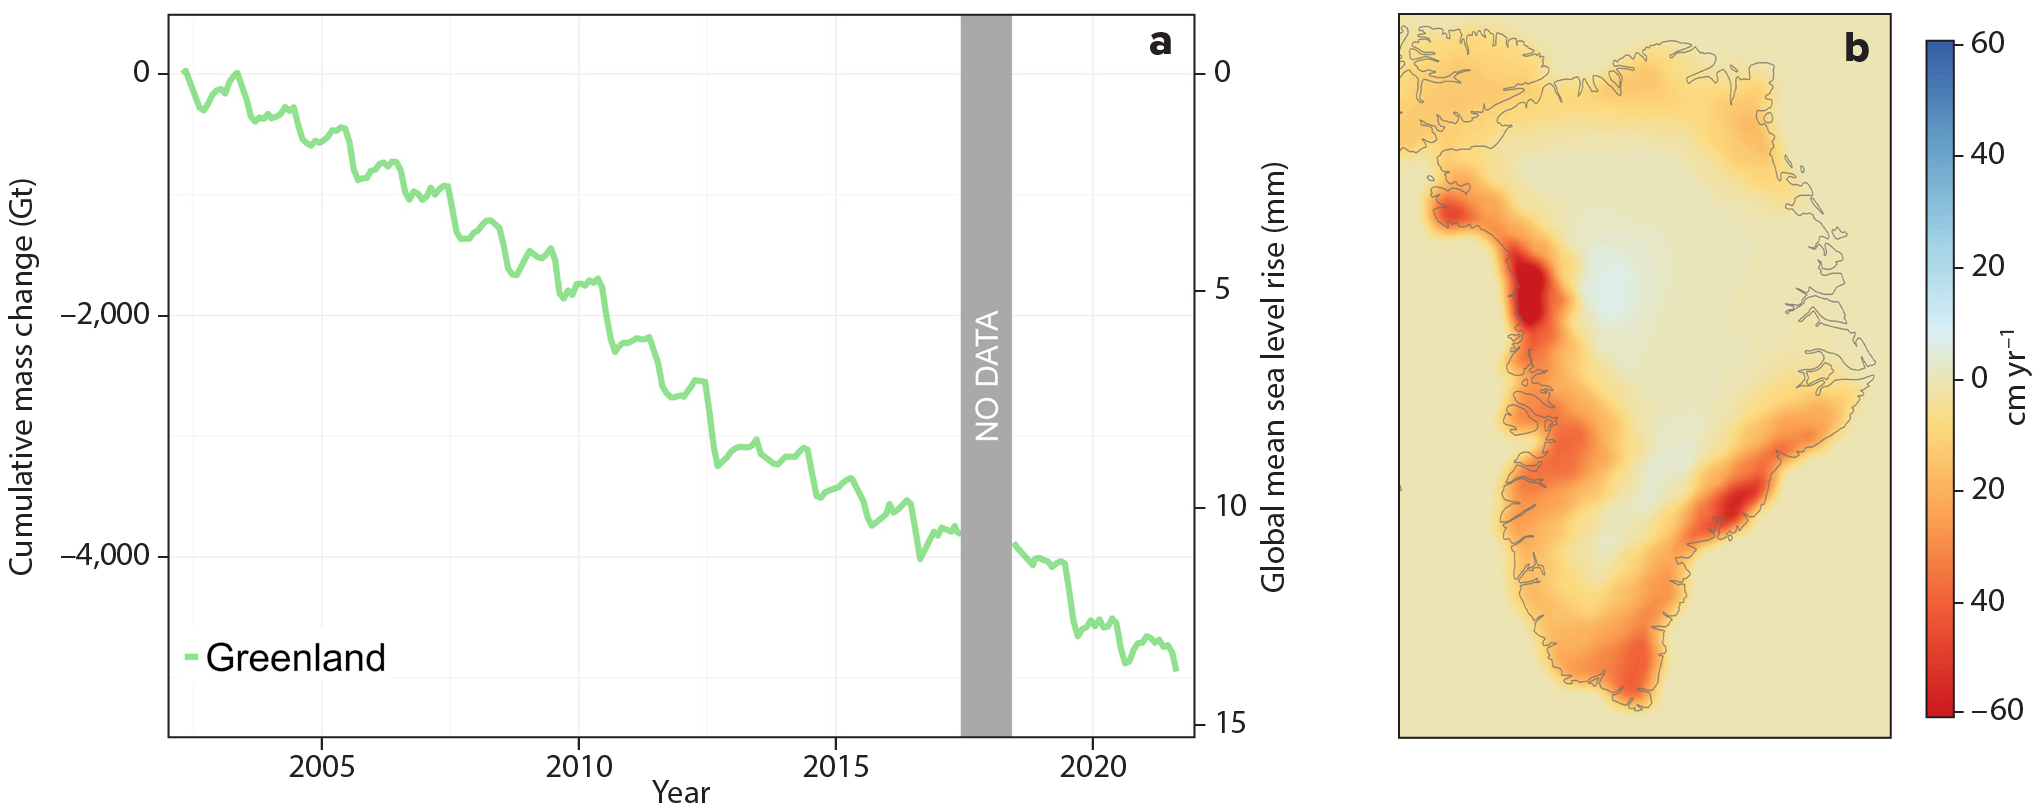
Figure 1a shows the observed mass change integrated over the Greenland Ice Sheet. On average, the ice sheet lost 268 ± 20 gigatons per year between 2002 and 2021, but the annual mass loss varies substantially. Exceptionally large losses on the order of 500 gigatons in a single year were recorded by the GRACE/GRACE-FO missions in 2012 and 2019. In these years, primarily anticyclonic atmospheric circulation patterns advected warm air from mid-​latitudes toward the ice sheet, leading to surface melt up to the highest altitudes of the ice sheet. Conversely, in 2017 and 2018, low-pressure systems residing over the ice sheet transported cold Arctic air southward, causing anomalously low summer temperatures and surface melt (Sasgen et al., 2020). Together with above-average snowfall during winter, this resulted in SMB values otherwise unmatched in the GRACE/GRACE-FO era. In the decades preceding the 2000s, such conditions would have led to ice sheet growth. Yet, the GRACE/GRACE-FO satellites recorded a net mass loss due to the elevated level of ice export through glacier flow.


FIGURE 1. (a) Mass changes observed by NASA’s Gravity Recovery And Climate Experiment (GRACE; 2002–2017) and its successor GRACE-FollowOn (2018–present) integrated over Greenland. (b) Spatial pattern of linear trends (2002–2021) in equivalent water height (EWH) per year. As a reference, 1 mm EWH corresponds to a surface loading of 1 kg m–2. > High res figure


In the 20-year record, the Greenland Ice Sheet contributed 14 mm to global mean sea level rise. However, the total freshwater input to the ocean is larger because of the precipitation feeding the ice sheet. With an estimated mean annual total precipitation of 906 gigatons per year for the same period (Noël et al., 2018), the Greenland freshwater flux sums to 1,174 km3 per year, equivalent to 0.04 Sverdrup (1 Sv = 1 × 10⁶ m3 s–1). To put this flux in perspective, it corresponds to about 30% of the observed pan-Arctic river discharge (4,025 km3 yr− 1 between 1981 and 2019; Winkelbauer et al., 2022), or 45% of the annual liquid freshwater flux through the Bering Strait (2,500 ± 100 km3 yr−1 for 2000–2010; Haine et al., 2015). As Figure 1b shows, the mass loss is not uniformly distributed but rather is concentrated along the margins of the ice sheet in the northwest, where glaciers have sped up dramatically since the 2000s (Mouginot et al., 2019; King et al., 2020), and the southeast, where an increase in ice discharge and meltwater runoff contribute about equally (Mouginot et al., 2019). Consequently, freshwater influx has mainly increased in the North Atlantic, Davis Strait, and Baffin Bay, where the accumulated freshwater may affect biological productivity and ocean circulation (e.g., Bamber et al., 2018).

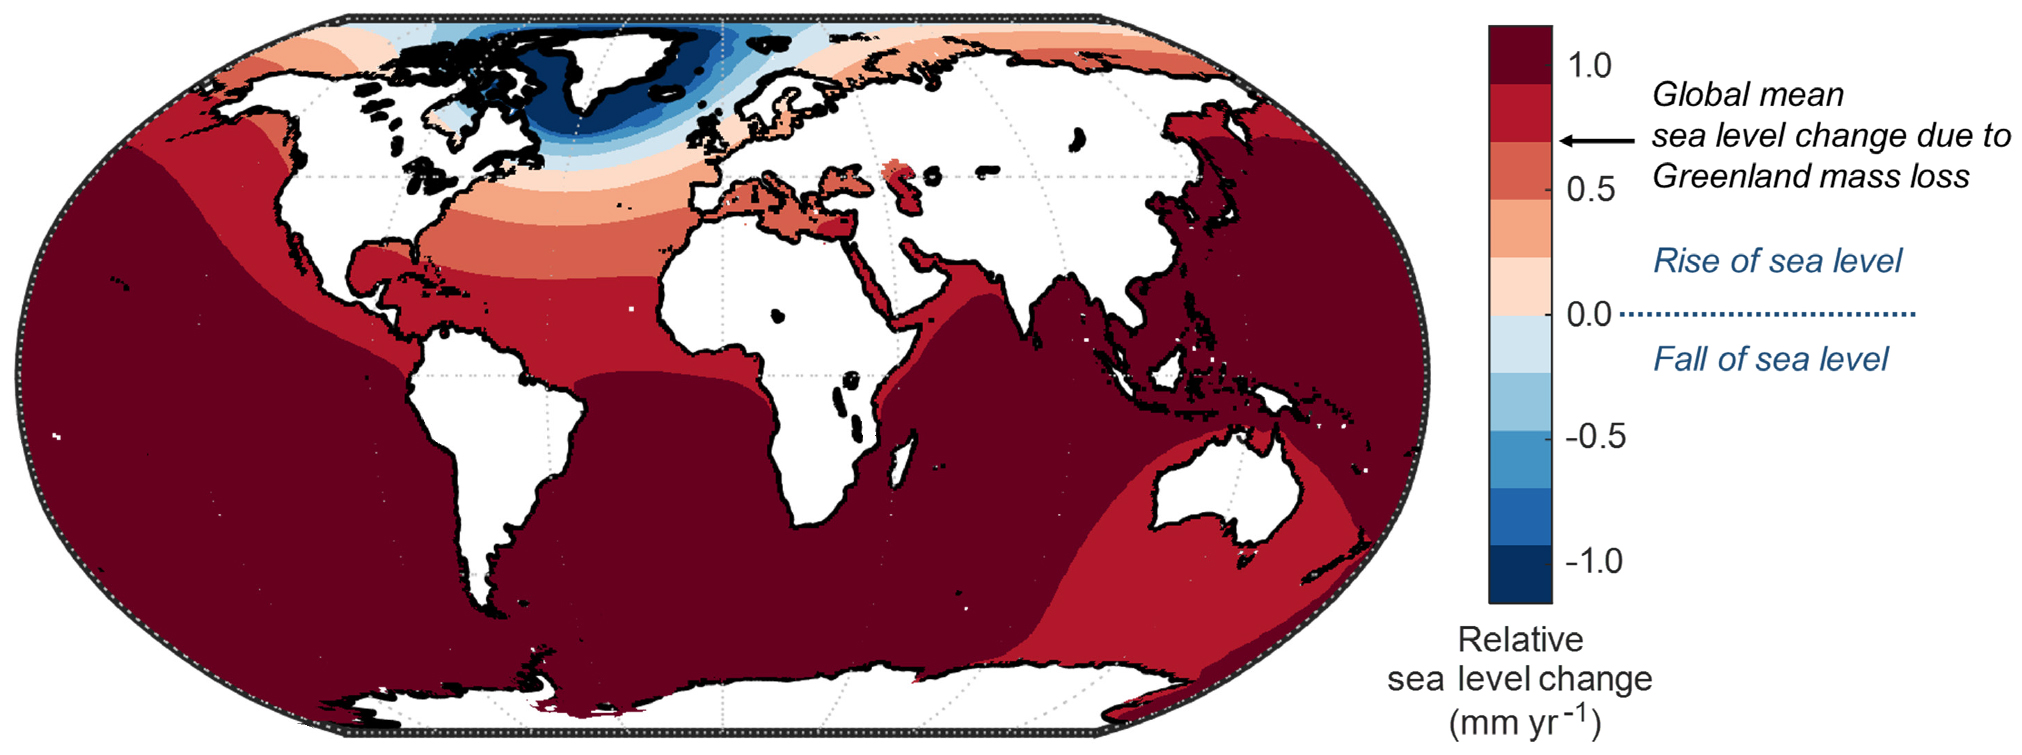
When considering the impact on sea level, it should be kept in mind that the mass loss of the Greenland Ice Sheet induces a distinct pattern of relative sea level change over the global ocean. Mass loss in Greenland reduces the gravitational attraction in the ice sheet’s vicinity but causes a slight increase over the global ocean. Consequently, less ocean water is pulled toward the ice sheet, causing a local fall of sea level in its vicinity and a rise in its far field. Additionally, the redistribution of mass loading leads to instantaneous elastic deformation of Earth’s surface, causing uplift in the region of mass loss, further increasing the fall of the sea level relative to the land. Finally, the mass redistribution changes Earth’s inertia tensor, resulting in rotational variation and an associated long-wavelength sea level pattern. The self-consistent treatment of these three effects is described in a linear integral equation called the “sea level equation” (Woodward, 1888; Clark et al., 1978; Spada and Stocchi, 2006). Figure 2 shows the resulting pattern of relative sea level change induced by the mass changes observed by GRACE/GRACE-FO. Typically, ice loss in polar regions leads to a disproportionate sea level rise in the mid-latitudes (Mitrovica, 2009; Kopp et al., 2015; Jevrejeva et al., 2016), which needs to be taken into account in projections and historical reconstructions of sea level.


FIGURE 2. Relative sea level change induced by the mass changes in Figure 1b. > High res figure


Acknowledgments

I.S. acknowledges funding by the Helmholtz Climate Initiative REKLIM (Regional Climate Change), a joint research project of the Helmholtz Association of German Research Centres (HGF) and support from the Open Access Publication Funds of Alfred-Wegener-Institut Helmholtz-Zentrum für Polar- und Meeresforschung. B.W. was funded by NWO VIDI grant 016.Vidi.171.063.
Citation

Wouters, B., and I. Sasgen. 2022. Increasing freshwater fluxes from the Greenland Ice Sheet observed from space. Oceanography 35(3–4):103–105, https://doi.org/10.5670/oceanog.2022.125.

References
    Bamber, J.L., A.J. Tedstone, M.D. King, I.M. Howat, E.M. Enderlin, M.R. van den Broeke, and B. Noel. 2018. Land ice freshwater budget of the Arctic and North Atlantic Oceans: Part 1. Data, methods, and results. Journal of Geophysical Research: Oceans 123:1,827–1,837, https://doi.org/​10.1002/2017JC013605.
  1. Clark, J.A., W.W. Farrell, and W.R. Peltier. 1978. Global changes in postglacial sea level: A numerical calculation. Quaternary Research 9(3):265–287, https://doi.org/10.1016/0033-5894(78)90033-9.
  2. Haine, T.W.N., B. Curry, R. Gerdes, E. Hansen, M. Karcher, C. Lee, B. Rudels, G. Spreen, L. de Steur, K.D. Stewart, and R. Woodgate. 2015. Arctic freshwater export: Status, mechanisms, and prospects. Global and Planetary Change 125:13–35, https://doi.org/10.1016/j.gloplacha.2014.11.013.
  3. Jevrejeva, S., L.P. Jackson, R.E. Riva, A. Grinsted, and J.C. Moore. 2016. Coastal sea level rise with warming above 2°C. Proceedings of the National Academy of Sciences of the United States of America 113:13,342–13,347, https://doi.org/10.1073/pnas.1605312113.
  4. King, M.D., I.M. Howat, S.G. Candela, M.J. Noh, S. Jeong, B.P.Y. Noël, M.R. van den Broeke, B. Wouters, and A. Negrete. 2020. Dynamic ice loss from the Greenland Ice Sheet driven by sustained glacier retreat. Communications Earth & Environment 1:1, https://doi.org/10.1038/s43247-020-0001-2.
  5. Kopp, R.E., C.C. Hay, C.M. Little, and J.X. Mitrovica. 2015. Geographic variability of sea level change. Current Climate Change Reports 1:192–204, https://doi.org/10.1007/s40641-015-0015-5.
  6. Mitrovica, J.X., N. Gomez, and P.U. Clark. 2009. The sea-level fingerprint of West Antarctic collapse. Science 323:753, https://doi.org/10.1126/science.1166510.
  7. Morlighem, M., C.N. Williams, E. Rignot, L. An, J.E. Arndt, J.L. Bamber, G. Catania, N. Chauché, J.A. Dowdeswell, B. Dorschel, and others. 2017. BedMachine v3: Complete bed topography and ocean bathymetry mapping of Greenland from multibeam echo sounding combined with mass conservation. Geophysical Research Letters 44(21):11,051–11,061, https://doi.org/10.1002/2017GL074954.
  8. Mouginot, J., E. Rignot, A.A. Bjørk, M. van den Broeke, R. Millan, M. Morlighem, B. Noël, B. Scheuchl, and M. Wood. 2019. Forty-six years of Greenland Ice Sheet mass balance from 1972 to 2018. Proceedings of the National Academy of Sciences of the United States of America 116(19):9,239–9,244, https://doi.org/10.1073/pnas.1904242116.
  9. Noël, B., W.J. van de Berg, J.M. van Wessem, E. van Meijgaard, D. van As, J.T.M. Lenaerts, S. Lhermitte, P. Kuipers Munneke, C.J.P.P. Smeets, L.H. van Ulft, and others. 2018. Modelling the climate and surface mass balance of polar ice sheets using RACMO2 – Part 1: Greenland (1958–2016). The Cryosphere 12:811–831, https://doi.org/10.5194/tc-12-811-2018.
  10. Sasgen, I., B. Wouters, A.S. Gardner, M.D. King, M. Tedesco, F.W. Landerer, C. Dahle, H. Save, and X. Fettweis. 2020. Return to rapid ice loss in Greenland and record loss in 2019 detected by the GRACE-FO satellites. Communications Earth & Environment 1:8, https://doi.org/10.1038/s43247-020-0010-1.
  11. Spada, G., and P. Stocchi. 2006. The Sea Level Equation: Theory and Numerical Examples. Aracne Editrice.
  12. Tapley, B.D., M.M. Watkins, F. Flechtner, C. Reigber, S. Bettadpur, M. Rodell, I. Sasgen, J.S. Famiglietti, F.W. Landerer, D.P. Chambers, and others. 2019. Contributions of GRACE to understanding climate change. Nature Climate Change 9(5):358–369, https://doi.org/10.1038/s41558-019-0456-2.
  13. van den Broeke, M.R., E.M. Enderlin, I.M. Howat, P. Kuipers Munneke, B.P.Y. Noël, W.J. van de Berg, E. van Meijgaard, and B. Wouters. 2016. On the recent contribution of the Greenland ice sheet to sea level change. The Cryosphere 10:1,933–1,946, https://doi.org/10.5194/tc-10-1933-2016.
  14. Wahr, J., M. Molenaar, and F. Bryan. 1998. Time variability of the Earth’s gravity field: Hydrological and oceanic effects and their possible detection using GRACE. Journal of Geophysical Research: Solid Earth 103(B12):30,305–30,229, https://doi.org/10.1029/98JB02844.
  15. Woodward, R.S. 1888. On the form and position of the sea level with special references to its dependence on superficial masses symmetrically disposed about a normal to the Earth’s surface. Bulletin No. 48, US Government Printing Office, 88 pp., https://doi.org/10.3133/b48.
  16. Winkelbauer, S., M. Mayer, V. Seitner, E. Zsoter, H. Zuo, and L. Haimberger. 2022. Diagnostic evaluation of river discharge into the Arctic Ocean and its impact on oceanic volume transports. Hydrology and Earth System Sciences 26:279–304, https://doi.org/10.5194/hess-26-279-2022.
Copyright & Usage

This is an open access article made available under the terms of the Creative Commons Attribution 4.0 International License (https://creativecommons.org/licenses/by/4.0/), which permits use, sharing, adaptation, distribution, and reproduction in any medium or format as long as users cite the materials appropriately, provide a link to the Creative Commons license, and indicate the changes that were made to the original content. Images, animations, videos, or other third-party material used in articles are included in the Creative Commons license unless indicated otherwise in a credit line to the material. If the material is not included in the article’s Creative Commons license, users will need to obtain permission directly from the license holder to reproduce the material.