Full Text
Satellite observations show that the sea ice cover in the Arctic is in decline. Ice extent is decreasing in all months of the year, and the ice is thinning and becoming younger. However, the observations do not delineate the details of how these changes are occurring. In situ measurements of sea ice mass balance can determine the amount of ice growth and the amount of ice surface melt and ice bottom melt. During field experiments, ice mass balance observations are straightforward using instruments as simple as ablation stakes and thickness gauges. However, field experiments are limited in number, location, and time. Autonomous ice mass balance buoys can overcome these constraints and provide long-term measurements at multiple sites.
There are a few different types of autonomous ice mass balance buoys and sensor packages. Buoys may be designed for multiyear or seasonal ice, and they are all equipped to determine geographic location, track the position of the surface and the ice bottom, transmit observations via satellite, and measure internal ice. The data collected provide time series of snow accumulation and melt, ice growth, surface ice melt, and bottom ice melt. Ice mass balance buoys are typically designed with open architecture that permits additional sensors, including acoustic rangefinders, barometers, radiometers, strain gauges, anemometers, and conductivity cells.
The Snow and Ice Mass Balance Array (SIMBA) buoy is one example. It has a 4.8 m long digital temperature string at 0.02 m spacing (Liao et al., 2018). It also has a heating element on the back of each temperature sensor that provides a pulse of heat whose decay is measured by the temperature sensor. The decay time is used to determine the thermal diffusivity of the medium, thus resolving whether the sensor is in air, snow, ice, or water. SIMBAs also carry a GPS, a barometer, and an Iridium transmitter.
The Seasonal Ice Mass Balance (SIMB) buoy can be used in either multiyear or seasonal ice (Figure 1). It is a 0.12 m diameter, 4.9 m long spar buoy designed to float in open water (Planck et al., 2019). It consists of two acoustic rangefinders, one above the ice looking down in order to track surface position, and one in the ocean looking up to track ice bottom position. It has a 3.8 m long digital temperature chain with sensors placed every 0.02 m. There are also a GPS, a barometer, and a shielded air temperature sensor. Data are transmitted via Iridium, and the measurement sampling interval is user selectable. The buoy has a battery life of 1.5 to 2 years.
|
|
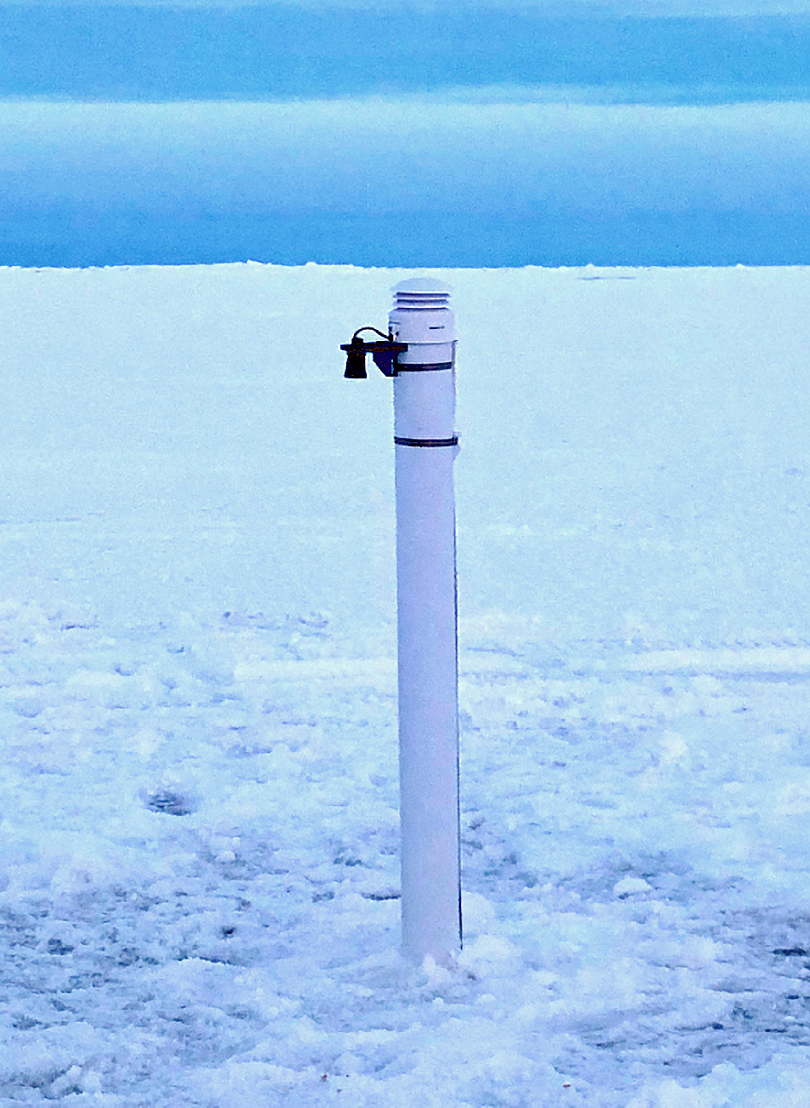
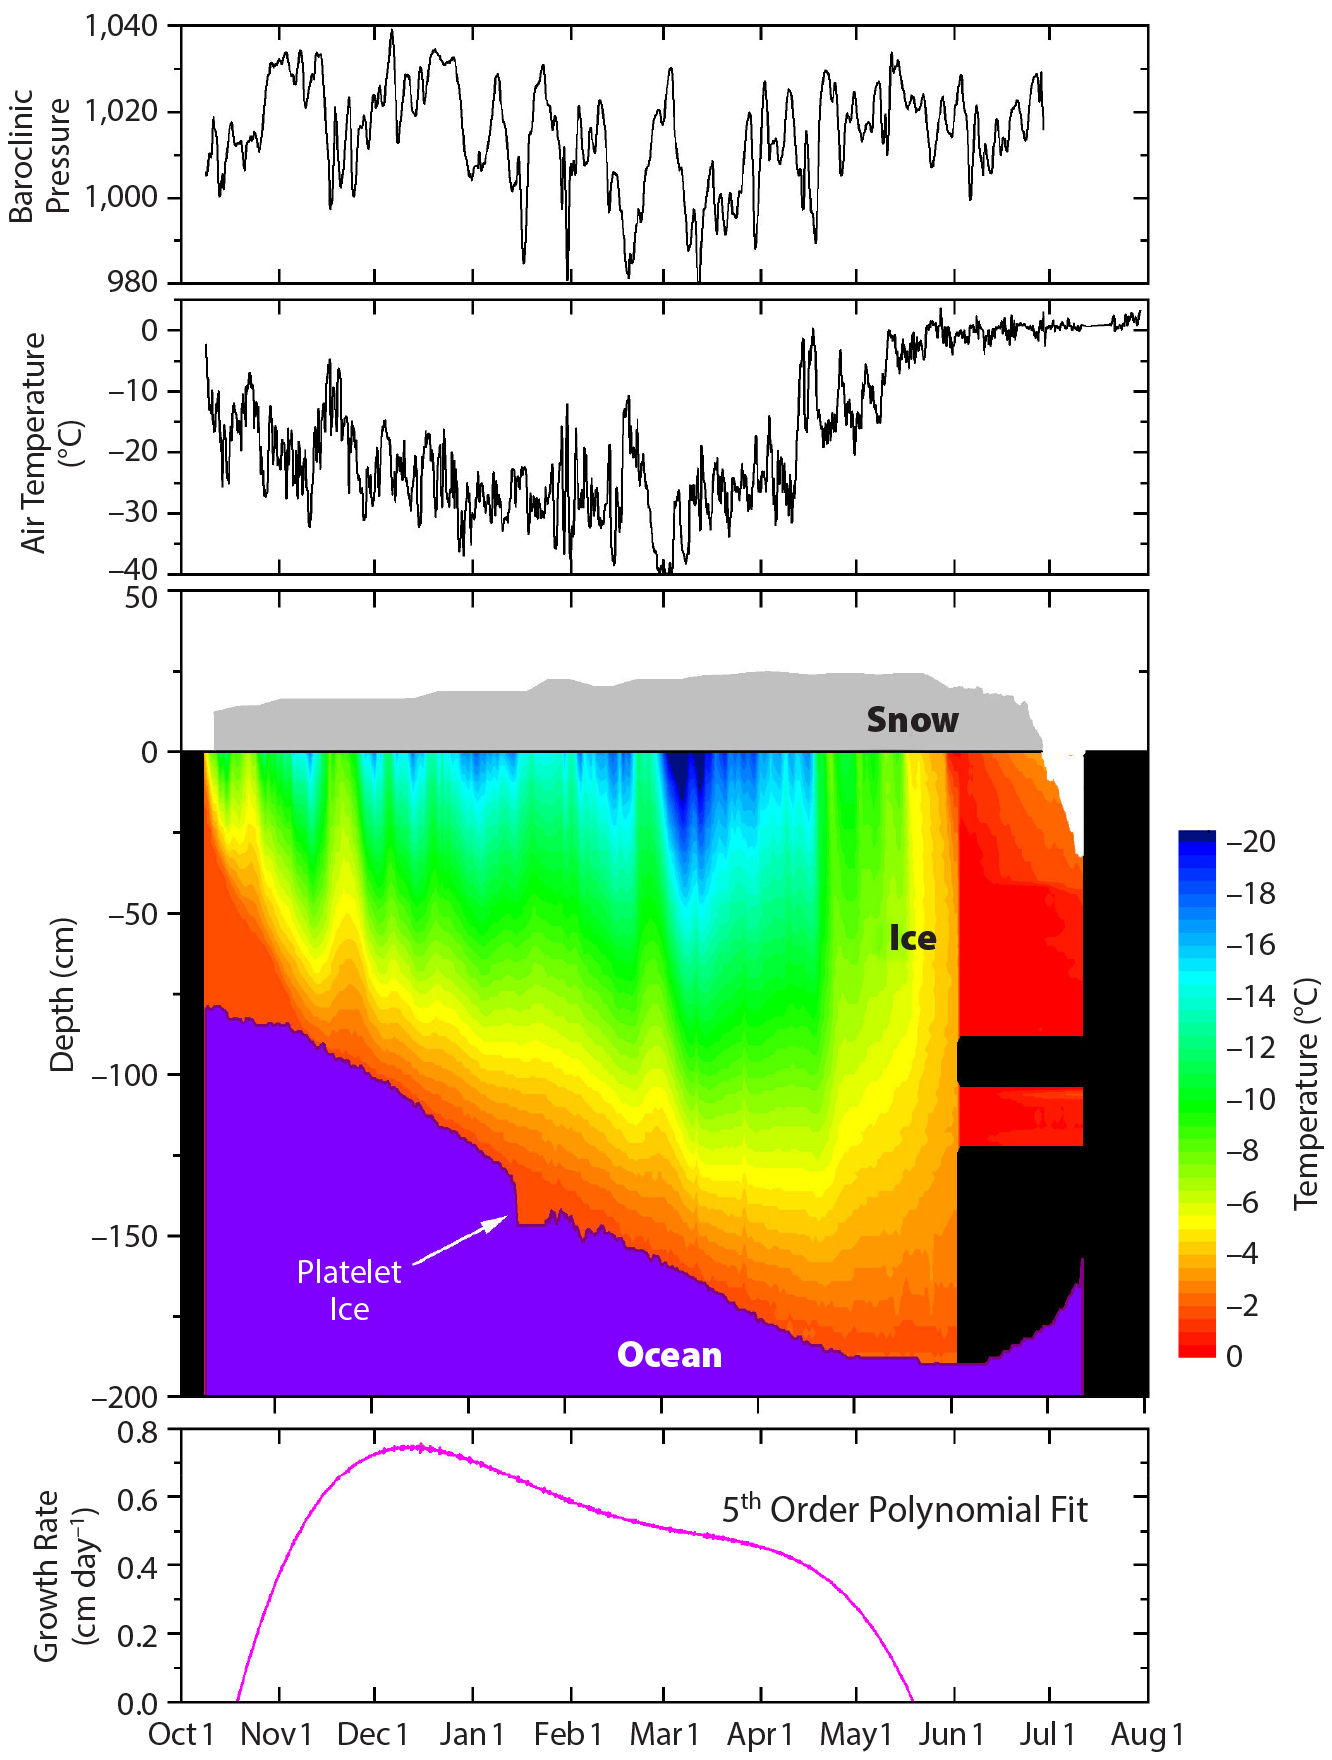
Figure 2 plots results of barometric pressure, air temperature, ice growth rate, snow depth, ice temperature and thickness, surface melt, and bottom melt from an SIMB deployed in the Central Arctic. The buoy was deployed in October 2019, and the floe broke up in late July 2020. The barometric pressure panel shows changes due to synoptic weather events that are evident in high-frequency changes in air temperature, which are superposed over the low-frequency seasonal cycle. The central panel illustrates the ice mass balance, with the gray shaded area showing the accumulation and melt of the snow cover. The red/purple interface is the bottom of the ice. Changes in air temperature propagate partially into the ice as shown by the color contours of ice temperature. The initial ice thickness of 0.80 m increased to 1.90 m by the end of the growth season in late May. The peak ice growth rate of 0.75 cm day–1 occurred in December. Melt onset and the total amount of melt were similar for surface melt (June 9, 0.31 m) and bottom melt (June 11, 0.30 cm).
|
|
The full utility of ice mass balance buoys is achieved when they are collocated with other autonomous systems that observe the atmosphere and ocean as part of a network. Ideally, these systems are deployed at multiple locations and over multiple years, allowing atmosphere-ice-ocean processes to be studied and spatial and temporal trends to be explored. For example, results from autonomous networks in the Beaufort Sea have investigated the interannual variability of the melt season and the increased ocean contribution to ice loss (Planck et al., 2020). The Sustainable Arctic Observing Network and the International Arctic Buoy Program are international efforts to deploy more autonomous systems in the Arctic Ocean.