Introduction
Rain often creates density stratification in the upper few meters of the tropical ocean, which can lead to large vertical and horizontal gradients in sea surface salinity (Lukas and Lindstrom, 1991; Anderson et al., 1996; Wijesekera et al., 1999; Anderson and Riser, 2014; Asher et al., 2014; Drushka et al., 2016; Thompson et al., 2019). Following Thompson et al. (2019), stable surface layers in the ocean created by rain are referred to here as rain layers. Significant progress has been made in understanding the vertical one-dimensional processes that contribute to rain layer formation and evolution. Using in situ measurements of salinity and temperature and one-dimensional models, Asher et al. (2014), Anderson and Riser (2014), Drushka et al. (2016), and Thompson et al. (2019) demonstrated that the formation of near-surface vertical salinity gradients depends on local rain rate, net heat flux, wind speed, and ocean turbulence. However, according to observations made by You (1995), Thompson et al. (2019), and Drushka et al. (2019), surface freshening and vertical salinity stratification are also often detected when rain is not present locally, but where it rained recently near the location of salinity measurements. In these cases, freshwater deposited on the ocean surface by rain in the surrounding area could have been (1) intercepted by a sensor as it moved through the location of prior rainfall, (2) sampled by a stationary sensor as freshwater either advected past the sensor or propagated past the sensor as a density current (Soloviev et al. 2015), or (3) some combination thereof. In order to determine the drivers of salinity variability observed with in situ and satellite sensors, horizontally dispersed rain observations are needed at fine spatial scales with temporal resolution on the order of a few minutes.
Ocean salinity plays a dominant role in determining the density structure and heat content of the tropical ocean (Lukas and Lindstrom, 1991; Sprintall and Tomczak, 1992; Drushka et al., 2012). Because rain layers are prevalent, persistent, and capable of changing the dynamics of air-sea exchanges, a clearer understanding of rain layers is needed to accurately model these features and their impacts. According to model simulations (Drushka et al., 2016) and observations (Thompson et al., 2019), stable rain layers typically have lifetimes of a few hours, although rain layers have been observed to persist for up to 14 hours at wind speeds below 10 m s–1 (Price, 1979; Thompson et al., 2019). The stable density stratification in rain layers affects turbulent mixing in the ocean. When rain layers combine with daytime warm layers on the ocean surface, density stratification can increase and lead to enhanced variability in sea surface temperature and air-sea fluxes (Fairall et al., 1996; Soloviev and Lukas, 2006; Kawai and Wada, 2007).
A complicating factor in studying rain and rain-formed fresh layers in the tropics is that the majority of tropical oceanic rain events are smaller in area, and evolve faster, than the observation scales of global-coverage satellite rain products derived from infrared and passive microwave radiometer measurements. Previous studies using long-term climatologies of satellite radar measurements and shipborne radar measurements during field experiments have determined that the majority of tropical rain events have diameters <10 km and lifetimes <30 minutes (Johnson et al., 1999; Trivej and Stevens, 2010). Satellite measurements of rain derived from infrared and passive microwave radiometers do not have the spatial resolution or sampling frequency required to resolve rain on these scales. For instance, the TRMM 3B42 rain product from the NASA Tropical Rainfall Measurement Mission (TRMM, available from 1997 to 2015) has a spatial resolution of 0.25° (~25 km) and an update cycle of 3 hr (Kummerow et al., 1998). The NASA Global Precipitation Measurement Mission IMERG product (Integrated Multisatellite Retrievals for the Global Precipitation Mission, GPM, available from 2014 to present) has a spatial scale of 0.1° (~10 km) and temporal resolution of 30 min (Skofronick-Jackson et al., 2016). According to rain climatology studies, precipitation events with larger spatial scales (>100 km) and longer lifetimes (>1–2 h) result in the largest rain accumulation (Nesbitt et al., 2006; Xu and Rutledge, 2014; Xu and Rutledge, 2015; Tan et al., 2017). However, small short-lived rain events are still important for understanding salinity variability because they can cause significant ocean freshening (Drushka et al., 2019, in this issue; Thompson et al., 2019).
As discussed by Wilheit et al. (1991), Chiu et al. (1993), Kummerow (1998), and Viltart et al. (2006), hardware specifications determine the detection capabilities and spatial resolution of satellite-based rain products. The precipitation radars aboard the TRMM and GPM satellites produce snapshots of rain with fine spatial resolutions of 5 km, which resolve individual rain cells. However, these radar snapshots are repeated in the same location relatively infrequently, every two to four days for TRMM PR and one to two days for GPM DPR (Precipitation Radar, Dual-Frequency Precipitation Radar). Therefore, these satellite radar data do not capture the time evolution of rain at a single location. However, shipborne radars sample precipitation with horizontal resolution of 150 m to 1 km, smaller than the dimensions of individual rain cells, with a sample rate between 1 min and 10 min (Hudlow, 1979; Petersen et al., 1999; Xu and Rutledge, 2014; Rutledge et al., 2019, in this issue). As a result, shipborne radars track both the spatial and temporal evolution of rapidly evolving rain cells of all sizes, and thus bridge the measurement gap between global satellite rain products and in situ rain gauges.
This study introduces rain measurements made with an X-band marine radar during the 2016 and 2017 cruises of the second Salinity Processes in the Upper-ocean Regional Study (SPURS-2) experiment in the eastern tropical Pacific Ocean. X-band radar is typically used to collect measurements of waves through investigation of the backscattered signal from the sea surface. This marine radar, part of the Wave and surface Current Monitoring System (WaMoS II) aboard R/V Roger Revelle, was instead tuned to detect rain by isolating the backscattered signal from raindrops. In this paper, we use examples to demonstrate the detection capability of the radar and its utility for oceanographic and atmospheric research purposes. The X-band radar data have a spatial scale of 180 m and temporal resolution of 1 min, providing fine-scale measurements of rain within 30 km range of the ship. Note that the SEA-POL C-band dual-polarization radar was also deployed on the 2017 SPURS-2 cruise to map rain with high precision at fine spatial resolution within about 100 km range of the research ship (Rutledge et al., 2019, in this issue).
Radar Measurement Details
SPURS-2 Data Collection
Three Furuno marine radars are mounted on the main mast of R/V Roger Revelle (visible as horizontally elongated tubes in Figure 1). The topmost radar operates at S-band frequency and is used exclusively for marine navigation, as is the middle radar, operating at the X-band frequency. The lower radar, also an X-band device (Furuno Model FAR-2117-BB, XN24AF with an 8-foot-long antenna), is available for science purposes (Figure 1b). Due to its lower position on the mast, data from this radar are not collected within the aft 70° sector of the ship. Normally, the lower X-band radar is used to measure the wave field (e.g., sigma S6 WaMoS II). In its wave-observing mode, the radar data collection and signal processing algorithms are configured to ignore returns from the atmosphere in order to focus on the return signal from the ocean surface (Lee et al., 1995).
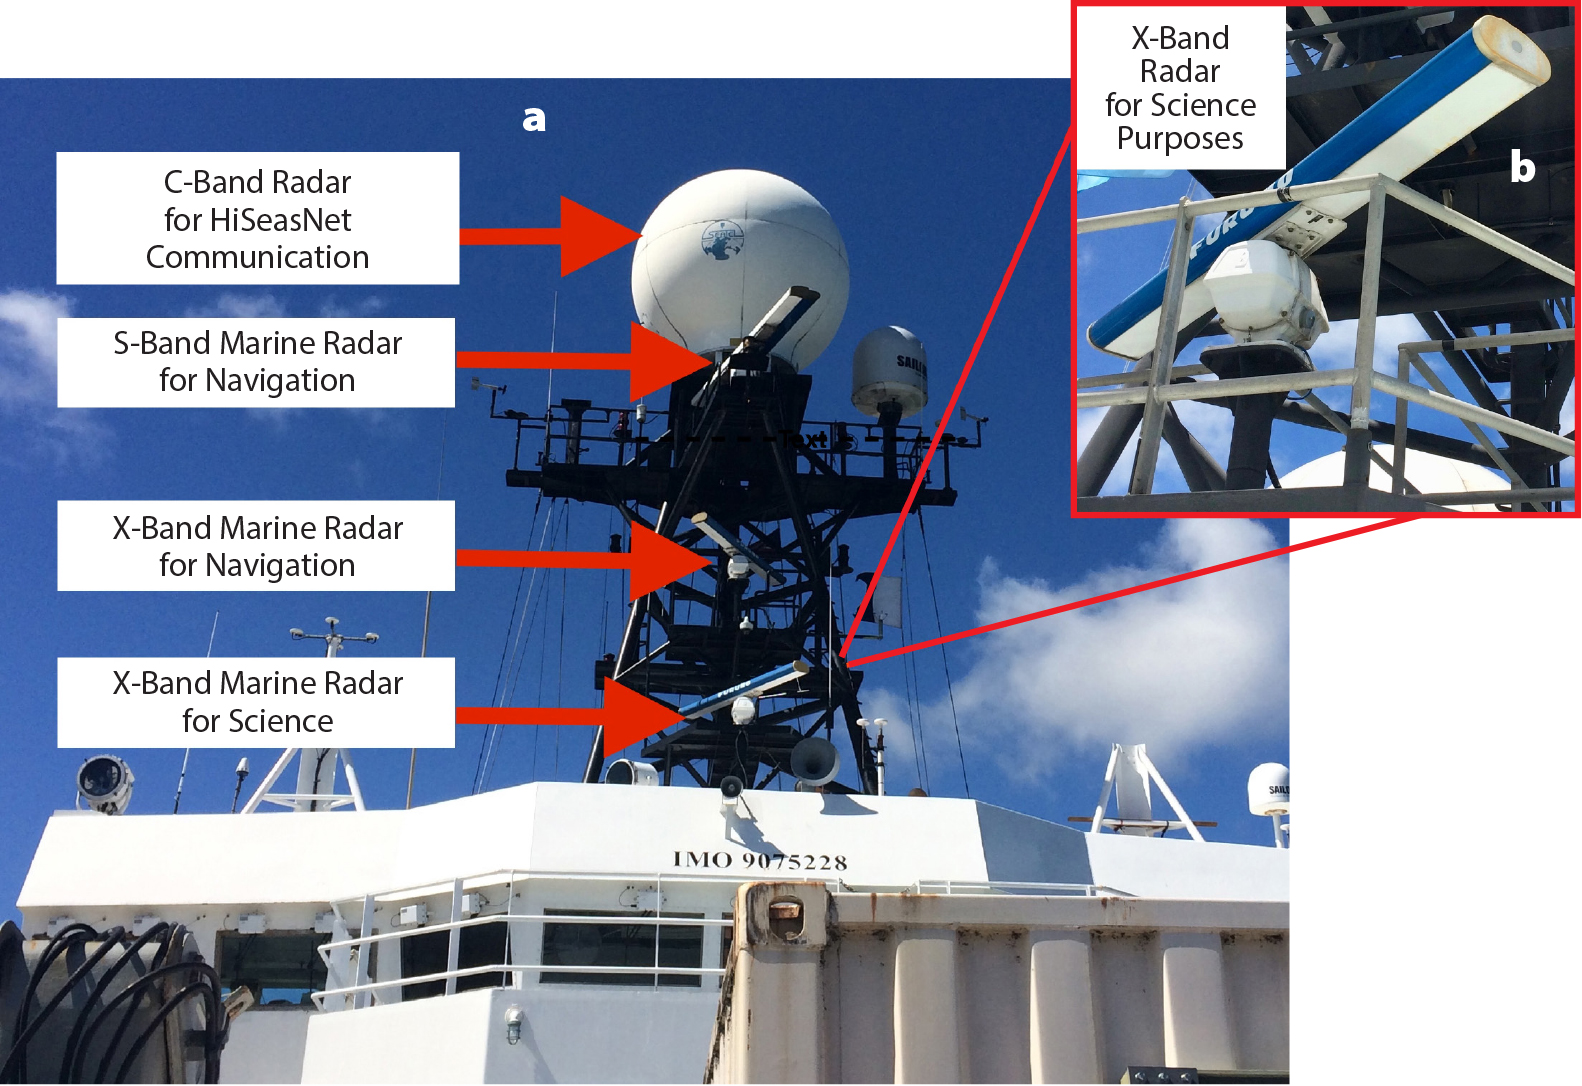
Figure 1. Zoomed out (a) and zoomed in (b) photos of the X-band marine radar used for rain observations aboard R/V Roger Revelle. Three Furuno marine radars are visible on the ship’s mast (a). The top two radars, a larger S-band and a smaller X-band, are used exclusively by the ship for navigation. An identical X-band radar sits in the lowest position on the mast and was available for science purposes during SPURS-2 (b). The topmost white dome houses the C-band radar used for HiSeasNet satellite Internet communications (Berger et al., 2006). > High res figure
|
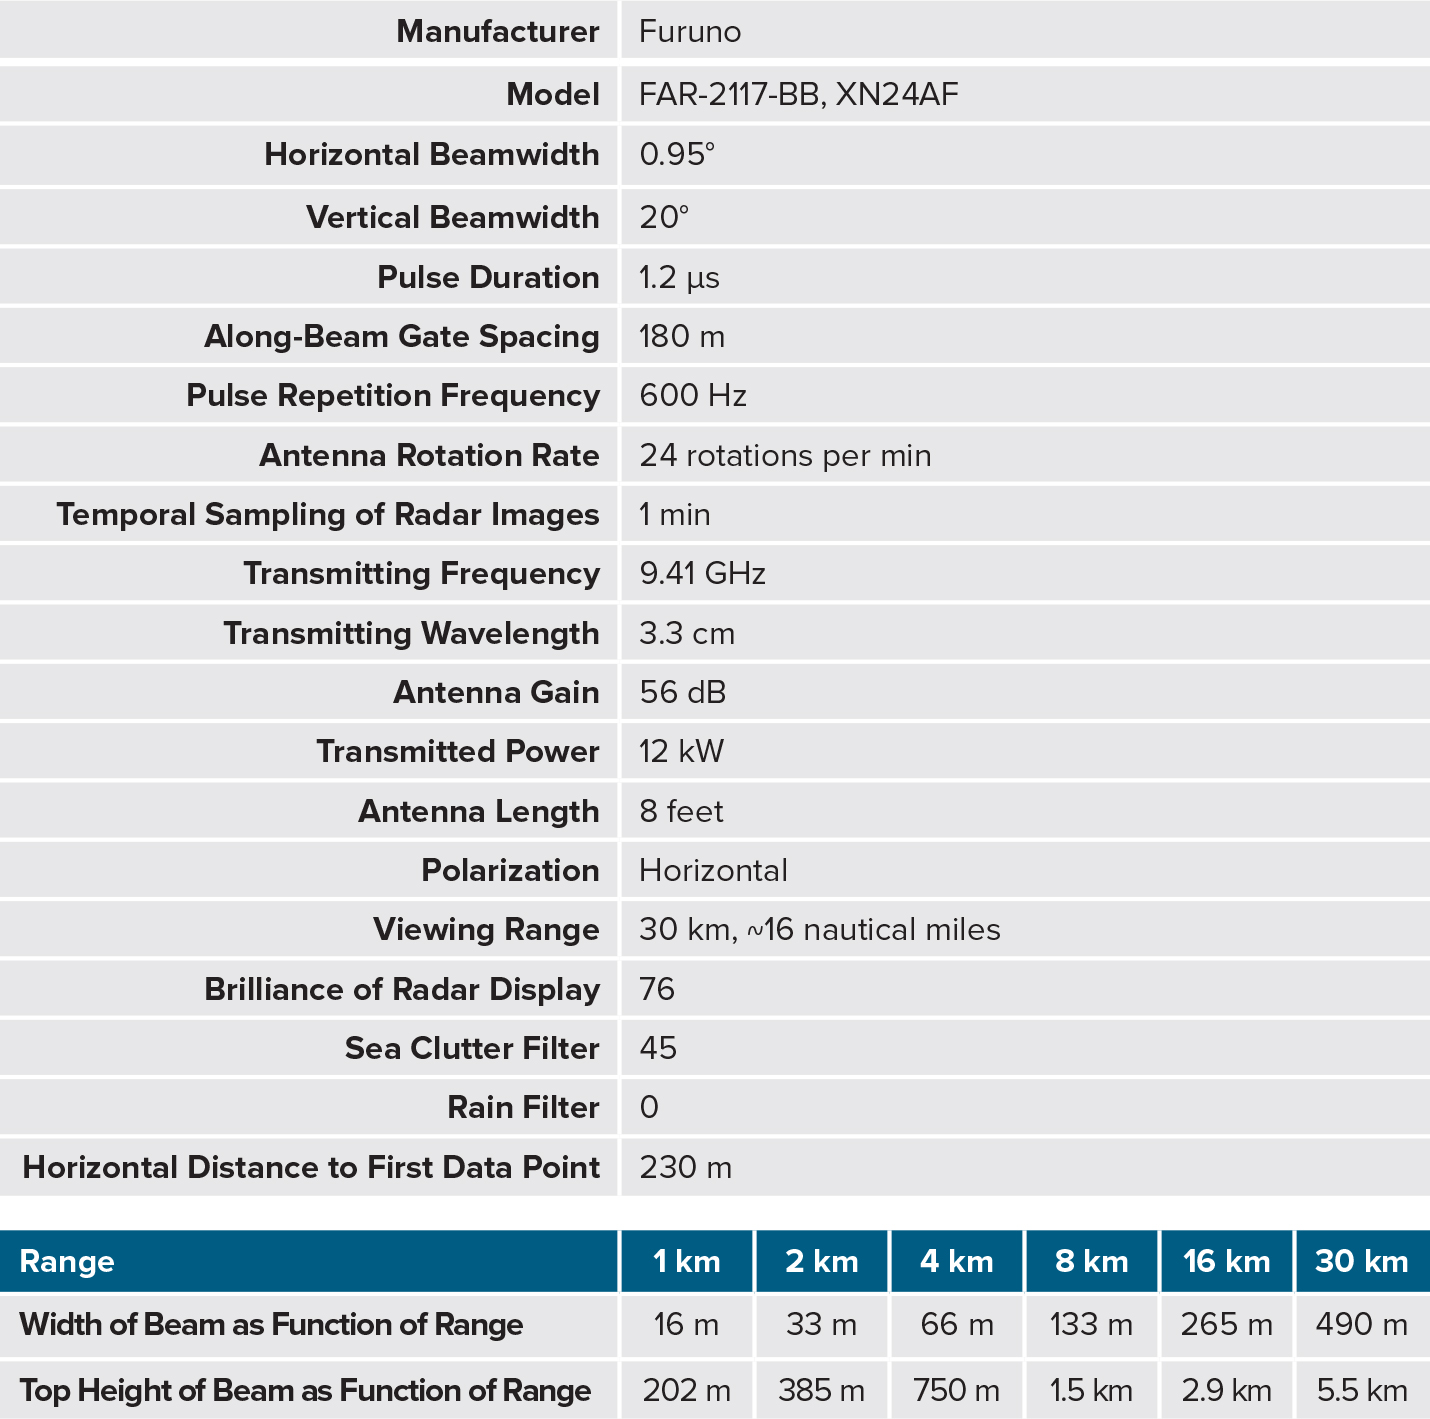
During the 2016 and 2017 SPURS-2 cruises, the lower X-band radar (Figure 1a,b, Table 1) was configured to view rain within 30 km range by adjusting the settings on the radar display console to: rain filter = 0 (used to filter out meteorological echoes), brilliance = 76 (brilliance or vividness of display, abbreviated as brill), sea clutter filter = 45 (used to filter out echoes from sea surface scattering), gain = 56 dB (intensity of energy emitted from the radar antenna), and viewing range = 16 nautical miles (about 30 km). For more details concerning the radar settings, see Table 1 and the online manual for the Furuno Model FAR-2117-BB, XN24AF, with an 8'-long antenna (https://www.furuno.com/en/products/radar/FAR-2117 BB#Spec). No adjustments were made to the radar’s internal processing software. For instance, the filters for rain and sea clutter are pre-programmed by the manufacturer to differentiate between meteorological and non-meteorological echoes based on their known differences, such as in horizontal gradients of echo intensity and the temporal persistence or movement of echoes from scan-to-scan. As a result of turning up the sea clutter filter and turning down the rain filter during SPURS-2, the radar’s software filtered out sea clutter but retained backscattered signal from rain. The end product was a monochrome intensity image in which the brightness of the color depended on the intensity of the backscattered signal from precipitation received by the radar. The returned power measured by the radar is proportional to the sixth power of raindrop diameter multiplied by the number concentration of raindrops (discussed in detail by Bringi and Chandrasekar, 2001); both of these factors determine the rain rate. Therefore, the intensity of the signal shown on the radar display is an indication of the intensity of rain rate, although it must be calibrated in the future to provide a quantitative estimate.
Table 1. Specifications of the X-band marine radar during SPURS-2 when it was used to collect rain observations. > High res table
|
During the 2016 cruise, rain intensity images displayed on the radar display screen were captured every 60 s using a digital camera that was mounted to the ceiling and directed at the monitor displaying the radar images. Standard auto-focus and exposure settings were used. During the 2017 cruise, images of the radar signal intensity on the display screen were captured directly every 60 s using a screen capture device (AV.io HD, Epiphan Video). Images from both years were then digitized to produce a data set of relative intensity (unitless) with a uniform horizontal resolution of 180 m. Owing to the high contrast between rain and clear-air echoes on the radar display (controlled by the brilliance setting), changes in ambient lighting and camera settings were not found to significantly impact the image processing techniques used on the 2016 data set obtained from a digital camera. The X-band radar’s gain was adjustable, but kept at a constant level in this experiment so that, in the future, the intensity levels could be calibrated to some extent with measurements of radar reflectivity or rain rate from the C-band SEA-POL dual-polarization radar deployed on the same ship during the 2017 SPURS-2 cruise (Thompson et al., 2018; Rutledge et al., 2019, in this issue).
During the 2016 SPURS-2 cruise, the X-band radar operated in rain mode continuously from August 31–September 17. During the 2017 cruise between October 21 and November 16, the radar collected data in rain mode roughly two-thirds of the time when the ship moved at 5 m s–1, and the radar operated in wave mode the remaining one-third of the time when the ship moved at 2 m s–1 and towed the surface salinity profiler (Drushka et al., 2019, in this issue).
Unique Radar Scanning Strategy
The X-band marine radar had a unique scanning strategy in terms of its fixed elevation angle, narrow horizontal beamwidth, very tall vertical beamwidth, and rapid rotation rate (Table 1, Figure 2). Beamwidth is defined as the angle between each half-power point (Bringi and Chandrasekar, 2001). The radar emitted a single beam oriented at 0° elevation angle relative to the deck of the ship, meaning the beam emitted horizontally from the ship. The radar measurements resolved rain with constant along-beam gate spacing of 180 m because the duration of each radar pulse was 1.2 μs. Owing to the radar’s 0.95° horizontal beamwidth, the beam expanded in the horizontal direction from 16 m across to 490 m across as range increased from 1 km to 30 km (Table 1). Research and operational weather radars yield data with similar horizontal resolution to the X-band radar. The radar’s 20° vertical beamwidth ensured that the radar sampling volume always remained in contact with the sea surface (Figure 2). The sampling volume depicted in Figure 2 is oriented relative to the ocean surface (blue line), and accounts for the X-band radar’s beam geometry, the height of the radar above sea level (20 m), Earth’s curvature, and standard refraction conditions in the atmosphere. The top of the radar beam reached 2.9 km height at 16 km range from the ship and 5.5 km height at its maximum range from the ship, 30 km. In contrast, weather radars typically emit a symmetric beam with equal height and width (~1°) that rotates around the radar at several elevation angles. This conventional scanning strategy samples a similar volume of the atmosphere to that covered by the single X-band marine radar beam at fixed elevation angle (Figure 2). The X-band radar console displayed images of backscattered intensity at ranges as close as 230 m from the ship, though the vertical extent of the radar sampling volume was limited at these very close ranges to the ship (Figure 2). The radar beam rotated around the ship 24 times per minute. Images of these radar echoes were captured at 1 min intervals during SPURS-2. The update cycle of conventional weather radars is typically much slower (5–10 min).
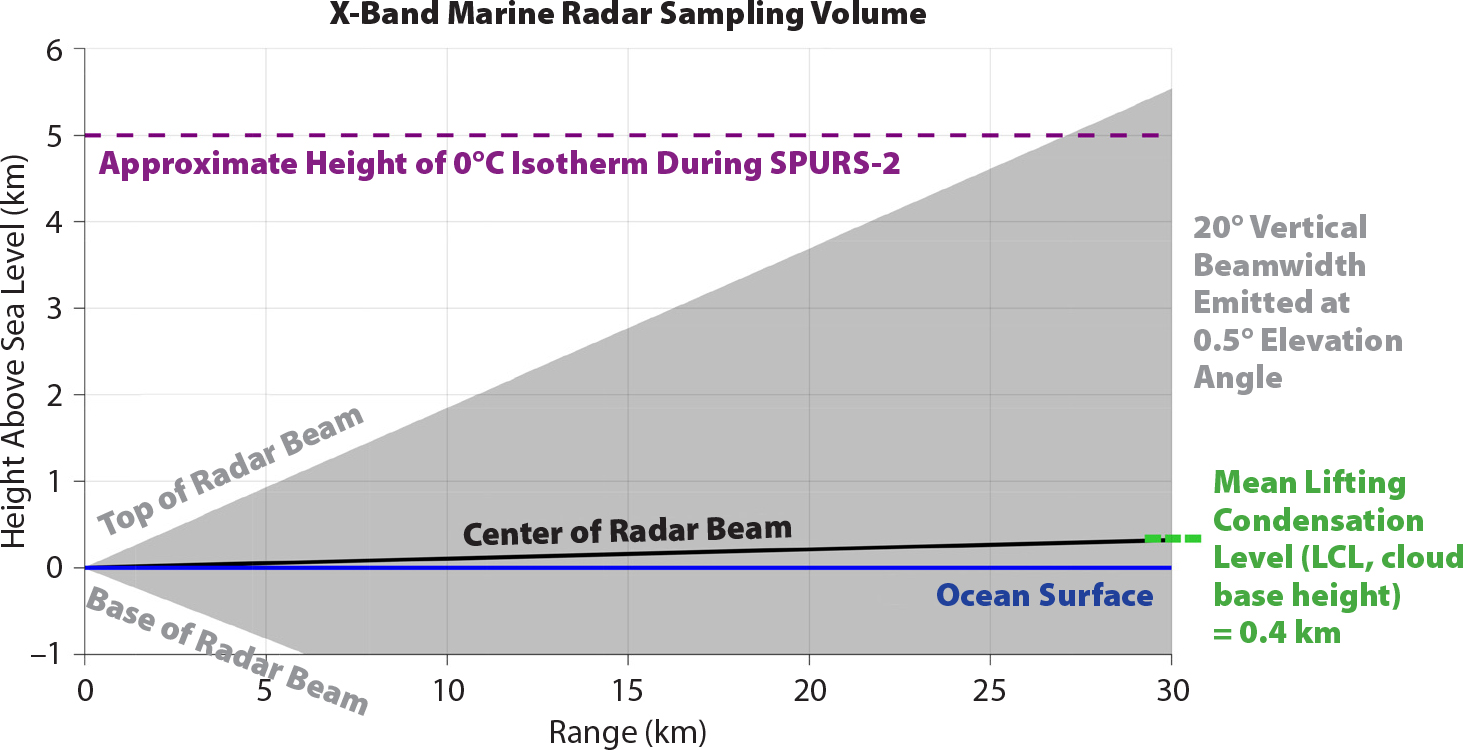
Figure 2. Sampling volume of the X-band marine radar (gray area, black line) relative to the ocean surface (blue). The estimated sampling volume accounts for the radar beam’s geometry, the radar’s height above sea level (~20 m), Earth’s curvature, and standard refraction conditions in the atmosphere. The environmental melting level (height of 0°C isotherm, purple) during SPURS-2 was about 5 km, while the mean lifting condensation level (LCL, equivalent to cloud base height, green) during SPURS-2 was 0.4 km. > High res figure
|
Because the backscattered radar signal at each range originated from a tall sampling volume of the atmosphere (Figure 2), these data cannot be used to determine the height at which rain existed within the radar beam. This means it is not known definitively whether the signal received by the radar was backscattered from raindrops that extended to the ocean surface, or raindrops that existed aloft but did not reach the surface at that time due to evaporation or horizontal advection. However, it is likely that the backscattered radar signal originated from liquid water that eventually reached the ocean surface because the radar beam was almost entirely below the environmental melting level (about 5 km) and the mean lifting condensation level, equivalent to cloud base height, was only 0.4 km (Figure 2). The lifting condensation level (LCL) was calculated from shipboard data (Clayson et al., 2019, in this issue). The LCL at R/V Revelle varied between 0.1 km and 0.9 km, which is similar to the LCL values found by Johnson et al. (2001) and Johnson and Ciesielski (2017) over other tropical oceans. It is unlikely that rain evaporated between this low cloud base height and the sea surface within the moist environment of the tropical marine atmospheric boundary layer present during SPURS-2 (shown by Torrie and Kuang, 2016, and Grant et al., 2018, over other tropical oceans). Because the height of the 0°C temperature level in the tropical atmosphere during SPURS-2 was about 5 km, the temperature of the entire radar sampling volume was above 0°C. Thus, it is safe to assume that all precipitation sampled by the X-band radar during SPURS-2 was liquid water that eventually reached the sea surface.
Results
Detection of Rain
Over the course of the five-week SPURS-2 cruise in 2016, 219 rain events with rain rates >0.05 mm hr–1 were detected by rain gauges on the ship. The radar data and rain gauge observations were investigated manually. Rain was detected at the ship by the gauges each time that rain was observed to pass over the ship according to the radar. Thus, the X-band marine radar data can be used reliably to determine the presence of rain near the ship.
Rain Mapping
The dimension, area, and relative intensity of precipitation can be estimated with the X-band marine radar data. The fine-scale spatial variability of rain intensity can also be assessed, enabling discrimination between convective and stratiform rain types (Houze, 1997; Thompson et al., 2015). For example, Figure 3a–c depicts the small spatial extent and relatively strong radar backscattered intensity of convective rain cells that moved southwestward, ahead of and across the ship’s northward track (the post-processed, digitized, gridded data are plotted; see section above on Radar Measurement Details). The ship was transiting at 5 m s–1 during this time, and no other rain events crossed the ship’s path in the prior three hours. The convective rain cells shown in Figure 3a–c did not pass over the ship, and no rain was recorded by shipboard gauges within a 4 hr time span surrounding this radar scan (Figure 3d). However, as the ship transited over the area where this rain occurred, the ship’s thermosalinigraph measured a freshening of 0.6 psu at 2 m depth (Figure 3d). The rain fell at ranges between 3 nm and 10 nm (5.4 km and 18 km) directly ahead of the ship from 20:12-20:32 UTC (Figure 3a–c). Assuming this rainwater remained near the sea surface and was not advected out of this region, the ship should have arrived at the location where the rain fell by about 20:50 UTC. Based on the locations and durations of the rain indicated by the radar, the freshening signature should have been detected by the ship for roughly 45 min, or until about 21:35 UTC. Indeed, a thermosalinograph sampling water from a through-hull port at a depth of 2 m detected a freshening signature of 0.6 psu between 20:55 UTC and 22:00 UTC (Figure 3b). The freshening signature was detected for about 25 min longer than the expected duration that was based on the assumption that the rainwater remained in place after the rain occurred. This temporal difference between the expected vs. measured ocean freshening suggests that lateral processes were also involved in the creation of the near-surface salinity structure, such as horizontal advection (discussed by Farrar and Plueddemann, 2019, in this issue) or lateral propagation of rain layers in the ocean as density currents (Soloviev and Lukas, 2015).
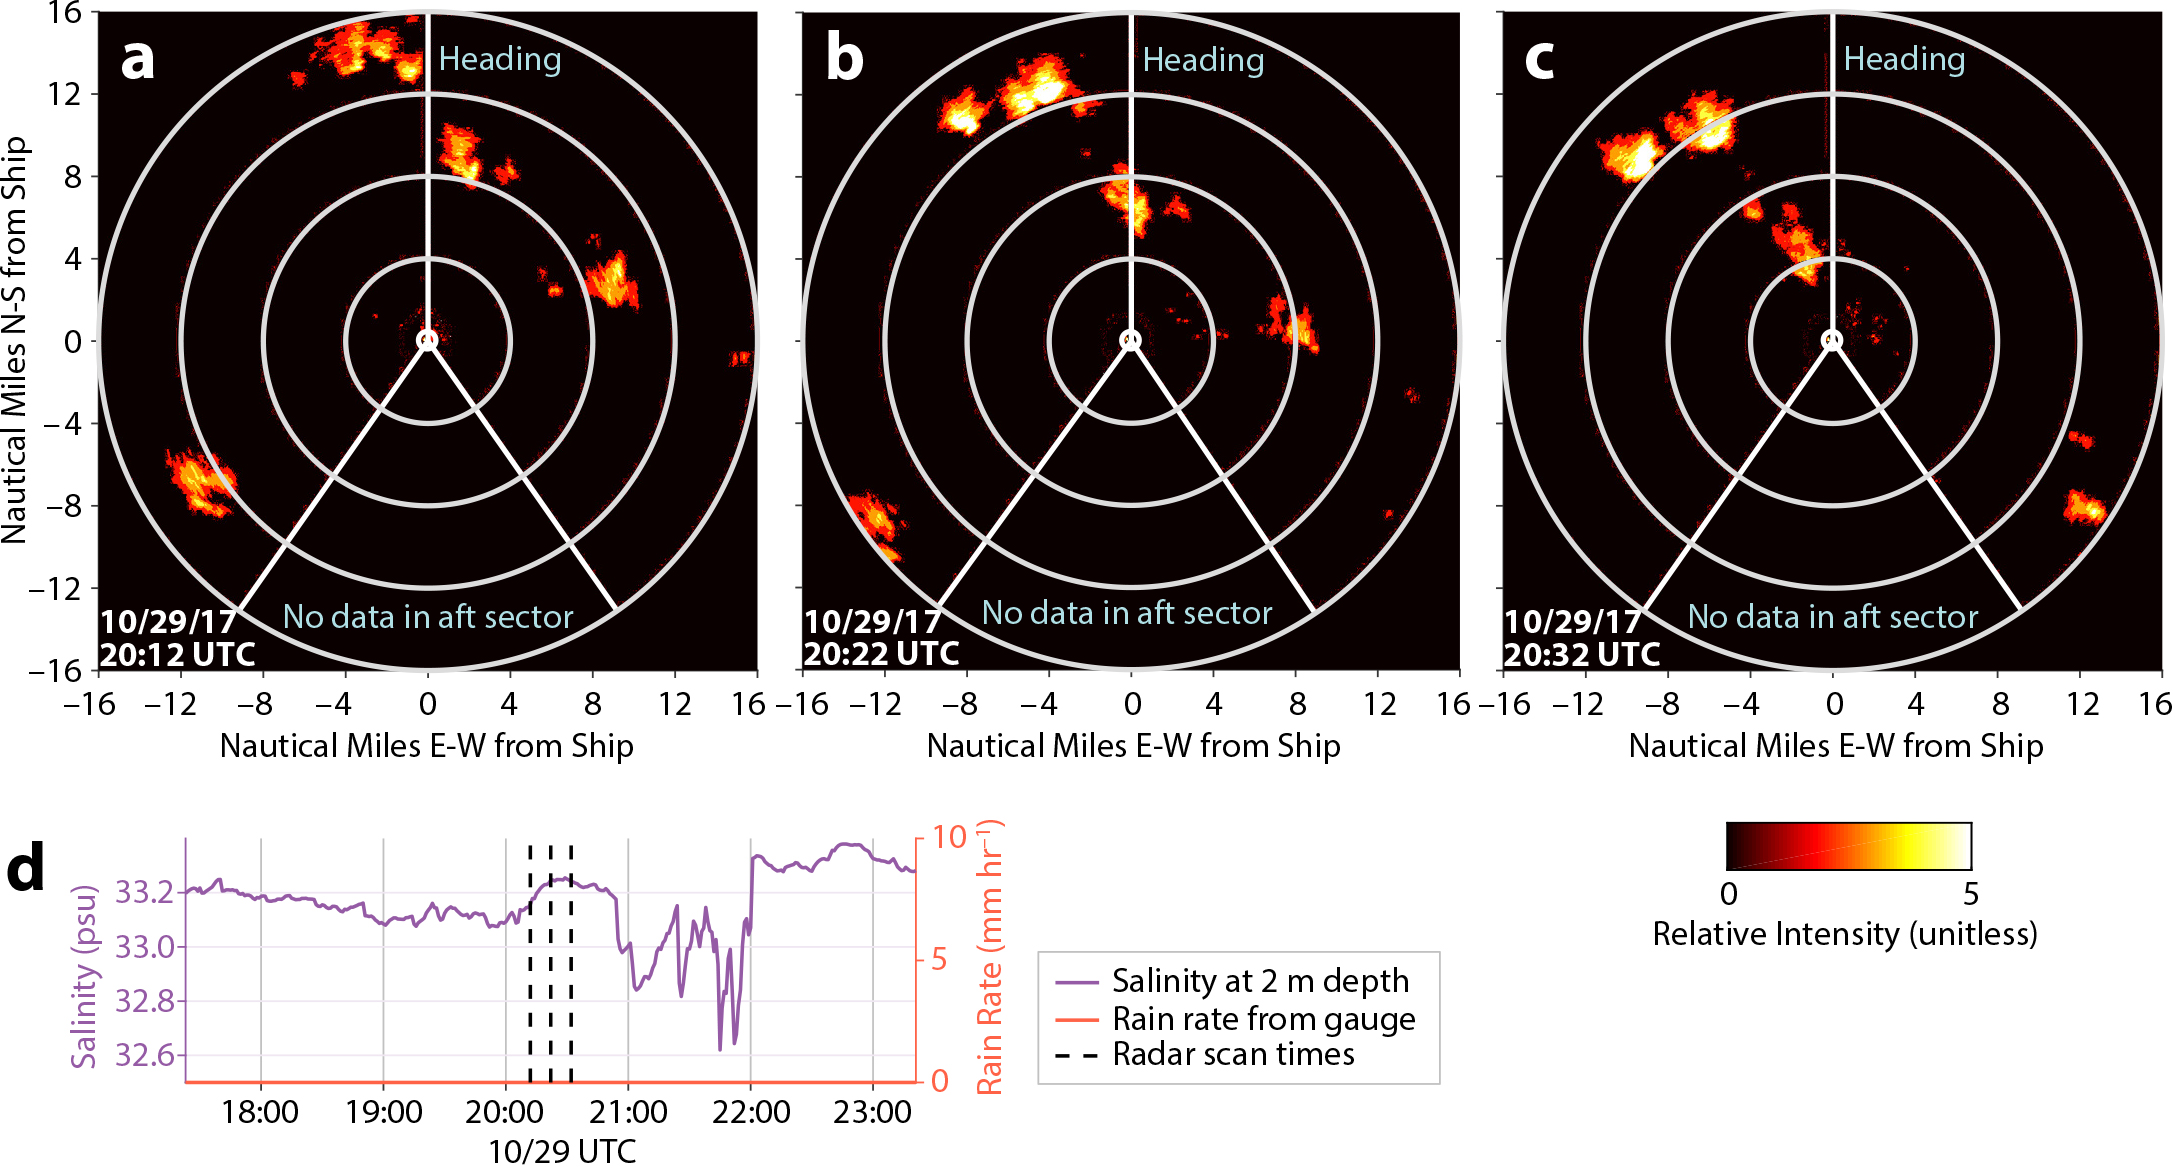
Figure 3. X-band marine radar observations of rain. In three scans spaced 10 minutes apart, isolated convective rain cells move southwestward as the ship moves northward. The post-processed, digitized, gridded data set is plotted (see section on Radar Measurement Details). The brightness of the color at each location about the radar (located at the center of the display) is a measure of the intensity of the backscatter signal received and displayed by the radar. Concentric white rings are located at 4, 8, 12, and 16 nm ranges from the ship (approximately 7.4, 14.8, 22.2, and 29.6 km range). The image is oriented such that north is toward the top of the page. Data were not collected in the aft 70° sector of the ship, marked by the “V” of white lines and labeled in blue. The ship’s heading is marked by the other white line and labeled in blue. (d) Time series of data from R/V Revelle before and after the radar scans above. Rain rate was measured by an optical gauge, and salinity was measured from a through-hull thermosalinograph at 2 m depth by the Underway Salinity Profiling System (Asher et al., 2014). The vertical dashed lines mark the times of the radar scans in panels a, b, and c. > High res figure
|
The other two types of rain events captured by the X-band radar during SPURS-2 were larger linear convective rain events (Figure 4a) and larger stratiform rain events (Figure 4b). A few minutes after the radar scan in Figure 4a was captured, this convective line of precipitation crossed over the ship and rain rates measured by the ship’s gauge reached 16 mm hr–1 (gauge data not shown). The large stratiform rain event captured in Figure 4b exhibited nearly homogeneous levels of intensity across the 60 km diameter viewing area of the radar. The concentric white ring of enhanced radar signal intensity at 3 nm range is a non-meteorological artifact that was present during other stratiform rain events. The origin of this artifact is unknown. At the time of the radar scan shown in Figure 4b, the ship’s rain gauge measured rain rates of only 2 mm hr–1. The intensity of this stratiform rain event (Figure 4b) was lower than that of the isolated (Figure 3) or linear convective rain events (Figure 4a), but the stratiform rain covered a larger area and lasted longer. These characteristics are consistent with prior radar observations of stratiform versus convective rain events (Houze, 1997). Radar-based classification of convective and stratiform rain events is a way to summarize the spatial extent and variable intensity of rain that impacted the ocean surrounding the ship. This adds valuable information to the rain rate time series collected from the ship and will aid in determining the causes for observed near-surface salinity variations during SPURS-2 (such as shown in Figure 3).
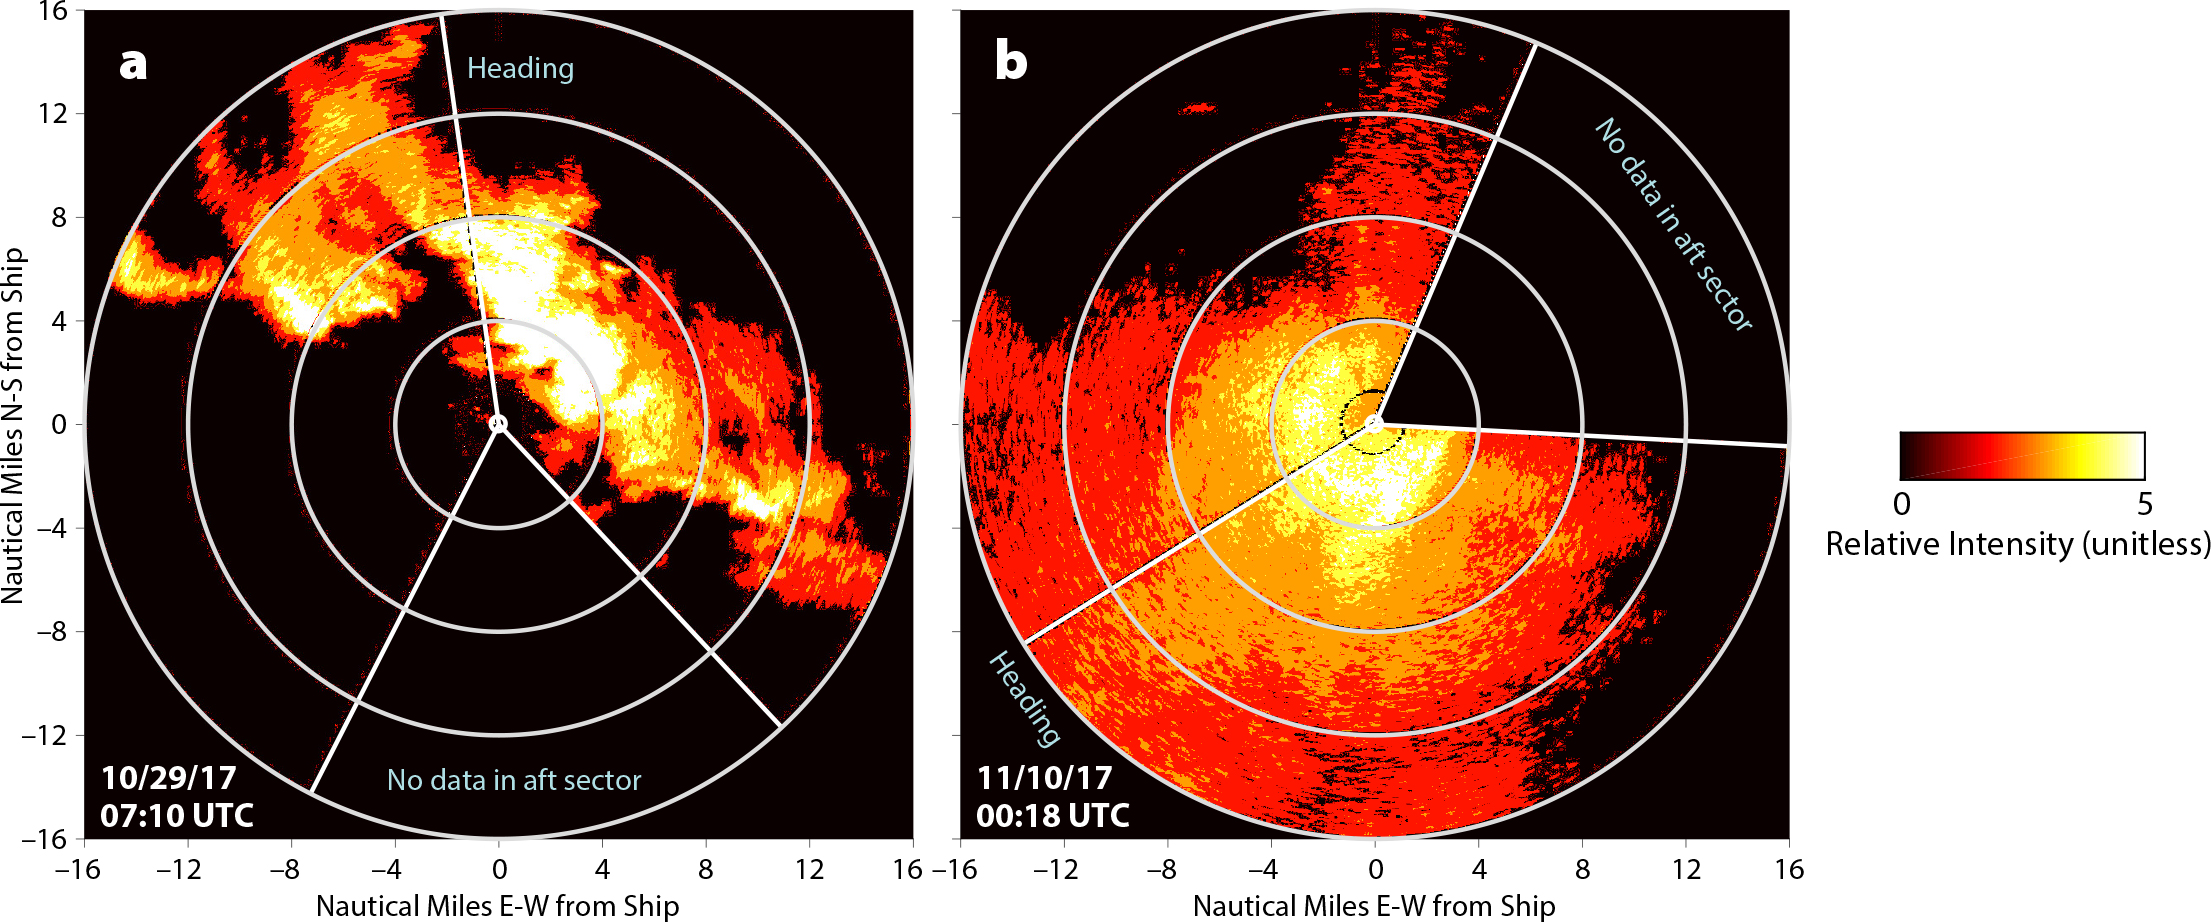
Figure 4. X-band marine radar observations of rain: (a) linear convective rain event, and (b) stratiform rain event. Same descriptors as Figure 3. > High res figure
|
Discussion and Conclusions
The rain history at locations surrounding the research ship can be constructed from a combination of data collected with the ship’s rain gauges and the ship’s X-band marine radar. The X-band radar images of qualitative rain intensity are useful for classifying rain events into canonical rain types (heavy rain, light rain, no rain, stratiform, convective) with fine spatial and temporal resolutions (Figures 3 and 4). Oftentimes, the radar indicated that rain was occurring upstream of the ship; when the ship later crossed through the location where rain had previously been detected by the radar, a local surface fresh anomaly was detected by ship measurements of salinity even though the ship’s rain gauges had not measured any recent rain accumulation (as seen in Figure 3). In other words, the local fresh anomaly detected at the ship likely resulted from earlier rainfall observed with the radar. Using the ship’s heading and speed, and the upper-ocean current velocity measured by the ship’s acoustic Doppler current profiler, the X-band radar provides a means to qualitatively determine rain intensity as well as the exact distance and time lag between occurrences of rain surrounding the ship and the ship’s location. For example, the direction and speed of the near-surface ocean current was highly variable during SPURS-2, reaching 0.94 m s–1 in magnitude. The ship transited at 5 m s–1 during the cruise unless it was stationary to recover or deploy instruments, or unless it transited at 2 m s–1 to tow the surface salinity profiler. If rain were deposited at the edge of the radar’s viewing range, 30 km away, then the ship could transit to the location of the rainfall in roughly 2 hr or <1 hr depending on whether the ship was moving at 2 m s–1 or 5 m s–1. Alternatively, if the ship were stationary and the current speed was 0.75 m s–1, it would take about 11 hr for rainwater deposited at the edge of the radar domain to be advected to the ship’s location if vertical and lateral mixing processes were negligible. Both of these scenarios are within reason because rain-generated vertical salinity gradients often persist for 1–2 hr (Drushka et al., 2016; Thompson et al., 2019) and have been observed to persist at a single location for up to 14 hr (Thompson et al., 2019).
The X-band radar data set collected during SPURS-2 can be used for measuring the spatial variability of rain and understanding ocean freshening. This data set will be analyzed to determine how the magnitude and timing of salinity stratification and surface salinity anomalies are related to variations in the size and intensity of precipitation observed by the radar, as well as the rain intensity measured by the ship gauge. We will characterize the spatial and temporal timescales of rain events as well as the spatial distributions of rain intensity, and use that information to understand which rain events lead to salinity stratification and surface salinity signals that are detectable from L-band satellite sensors. We will also evaluate whether the strength of vertical salinity stratification and surface freshening is correlated with the spatial distribution of rain, which cannot be assessed with a ship-based rain gauge.
Marine radars are standard equipment on research vessels, and those not dedicated to navigational use could provide rain observations for atmospheric and oceanographic research activities. Spatially distributed, fine-scale rain measurements are needed to predict ocean salinity in rainy regions as well as to contextualize and understand point measurements of salinity collected from drifters, autonomous vehicles, moorings, and ships.
By using the measurements collected during SPURS-2 to develop a physical understanding of how well the timing, occurrence, and strength of tropical salinity stratification can be explained by properties of rain and wind, and how well these are captured at both local and satellite scales, we will determine the initialization and physics requirements of models attempting to simulate salinity in the future. For instance, we will determine the relative importance of in situ rain measured by gauges or upstream rainfall captured by radar in determining in situ salinity variability. This will inform whether spatially varying grids vs. time series of rain are needed to accurately predict salinity variations in numerical models. The ship-based in situ data sets of salinity, rain, wind, and air-sea fluxes collected during SPURS-2 spanned two months within the Intertropical Convergence Zone, a tropical zone of low-level atmospheric convergence and precipitation that encircles the globe. Therefore, SPURS-2 results regarding the dynamics of surface salinity variability are expected to be applicable over a much larger area of the ocean and a longer time span than those of this field campaign.

