Full Text
With greater nutrient loading and seasonal water column stratification, dissolved oxygen has been declining in many of the world’s coastal areas, and climate warming is likely to exacerbate this problem (e.g., Roman et al., 2019, and references cited therein). Low dissolved oxygen or hypoxia can profoundly affect a fish’s growth, survival, and reproductive success, but tolerances to low dissolved oxygen differ across species. The level of hypoxic stress is also dependent on ambient water temperatures and prey availability. A fundamental challenge to fisheries management is to understand how hypoxia affects fish under different environmental conditions. In this paper, we introduce a new approach to assessing the impacts of hypoxia on fish that can be used to compare impacts among species as well as across other physical, biological, and chemical gradients and in response to environmental change.
FUNCTIONAL SEASCAPES
A seascape shows the spatial patterning of the ocean’s physical, chemical, and biological characteristics, regardless of its value to any particular species. Seascapes have been shown to be highly patchy, complex, and dynamic, which has challenged our ability to understand biological impacts. Here, we introduce the concept of a “functional seascape” that maps the spatial patterning of the specific biological responses (e.g., growth rate, survival rate, reproductive success, metabolic rate, activity) of a particular species to observed abiotic and biotic conditions. Functional seascapes must be defined for individual species because biological and ecological rates differ across species. Spatially explicit modeling, that is, modeling where the exact location of a variable (e.g., temperature, salinity, dissolved oxygen) matters to the process being modeled, provides the tools to produce these functional seascapes at the same high resolution as the observed ocean conditions. It also offers a first-order view of habitat quality based on the fundamental responses of a fish species to its environment.
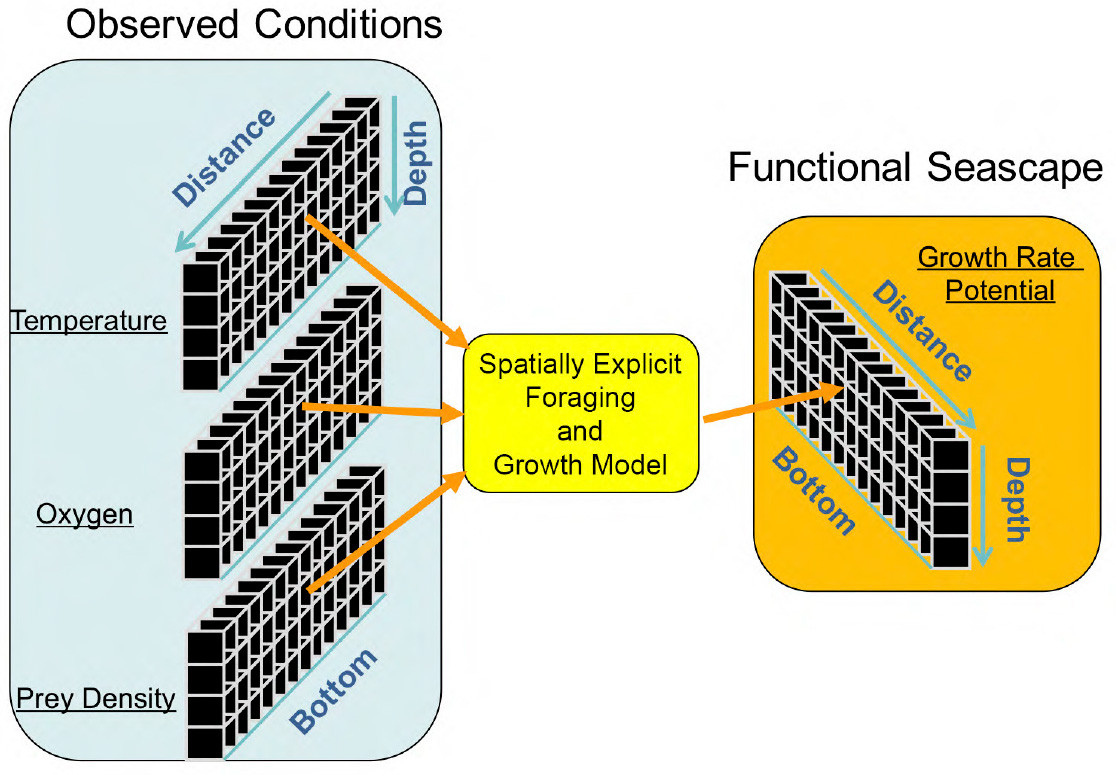
To illustrate this approach, we use fish growth rate potential (GRP), which calculates how well a particular species of fish would grow based on its bioenergetics capabilities and grown in the prevailing environmental conditions. Growth rate is a critical factor for fish and directly corresponds to survival rates and reproductive success. It is generally considered a valid measure of fish habitat quality. The metabolic processes that regulate growth in fish are often nonlinear responses to physical and biological conditions; thus, growth rates must be assessed at the same spatial and temporal scales as the underlying patterns. Growth rate potential maps are derived using species-specific, spatially explicit modeling driven by spatial patterns in temperature, oxygen, and prey densities (Figure 1).
|
|
CASE STUDY: HYPOXIA IN THE NORTHERN GULF OF MEXICO
The Northern Gulf of Mexico (NGOMEX) is one of the largest and most well-known hypoxic regions, characterized by extensive bottom hypoxia driven by nutrient loading from the Mississippi River watershed. We have been using functional seascapes of GRP to better understand how hypoxia affects fish in the region and to predict how proposed reductions in nutrient loading might affect both hypoxia and the lower-level production that fuels fish production.
High-Resolution Spatial Mapping
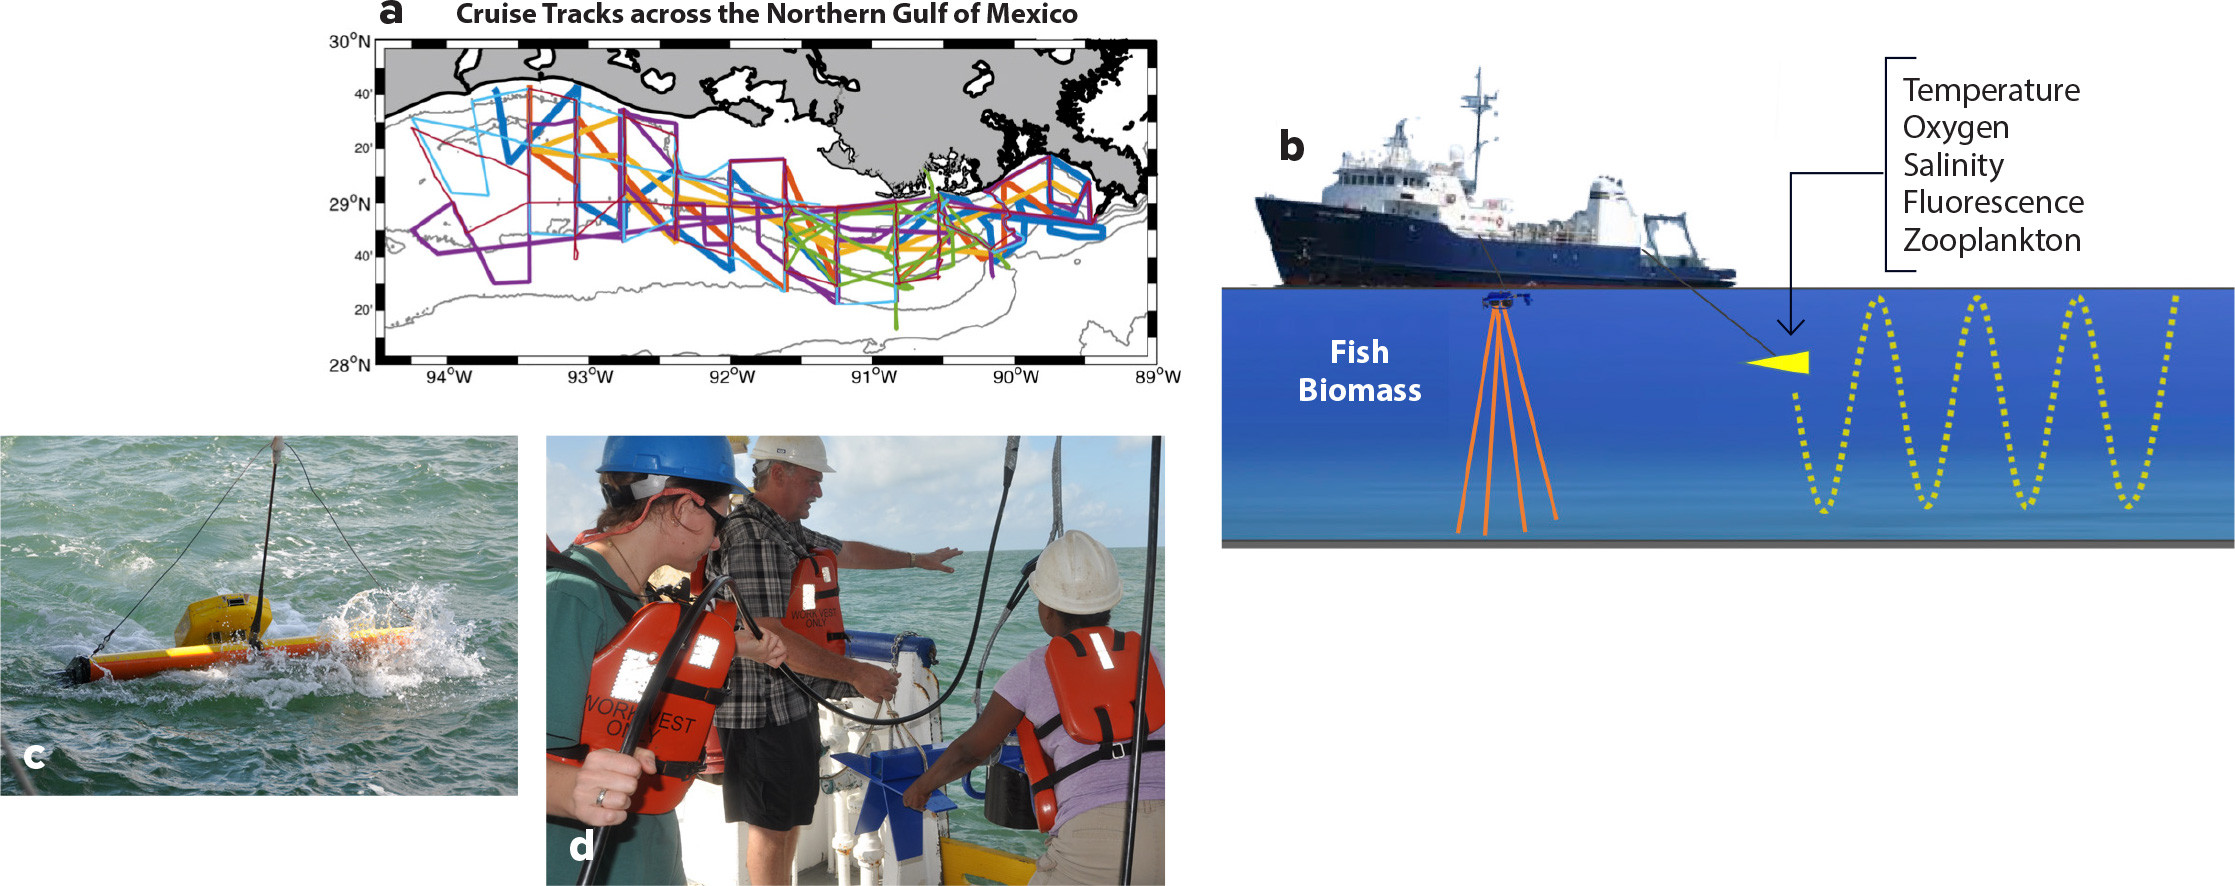
Seascapes were directly mapped by running a series of ship-based transects across the NGOMEX during summer when hypoxia is most severe (Figure 2a,b). We measured temperature, salinity, oxygen, phytoplankton, zooplankton, and fish prey densities at high spatial resolution throughout the water column. A Scanfish (Figure 2c) that undulated from near surface to near bottom was instrumented with a CTD, an optical dissolved oxygen sensor, a fluorometer, and an optical zooplankton counter. At the same time, prey fish biomass densities and sizes were measured using a calibrated, dual-frequency, split-beam acoustic sensor (Figure 2d) towed near the surface.
|
|
We subdivided observed data taken along individual transects into uniform spatial cells and calculated expected growth rate in each cell based on species-specific bioenergetics and foraging models (see Hartman and Brandt, 2011, and Zhang et al., 2014). This spatially explicit modeling approach produces functional seascapes of GRPs for each species along the length of the transect.
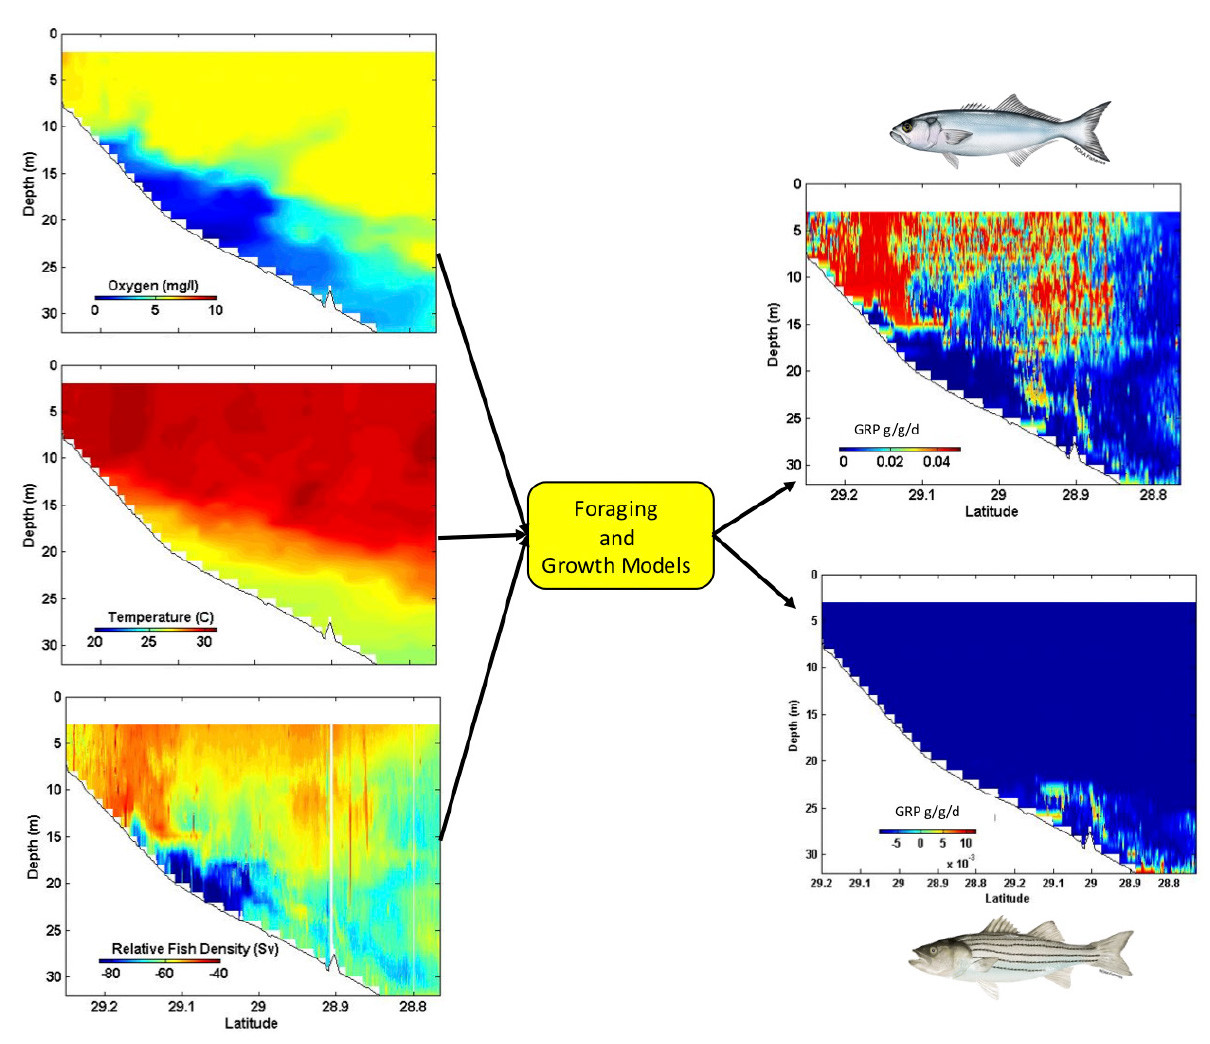
Figure 3 is an example taken from a single NGOMEX transect. The high-resolution dissolved oxygen, temperature, and prey density data collected were used to assess the GRP spatial patterns of two piscivores—adult bluefish, Pomatomus saltatrix, and striped bass, Morone saxatilis. As expected, the GRPs of these species responded quite differently to the same hypoxic conditions due to their different bioenergetics requirements (Hartman and Brandt, 2011) and to their high dependence on prevailing water temperatures and prey densities. Striped bass grew poorly in most conditions because they feed less or not at all under higher temperatures regardless of food availability. These results demonstrate that some differences in underlying structure may have biological significance while others do not. Overall growth responses can be now be summarized in various ways, such as the proportion of water supporting positive growth at different levels of hypoxia.
|
|
Hydrodynamic Water Quality Model
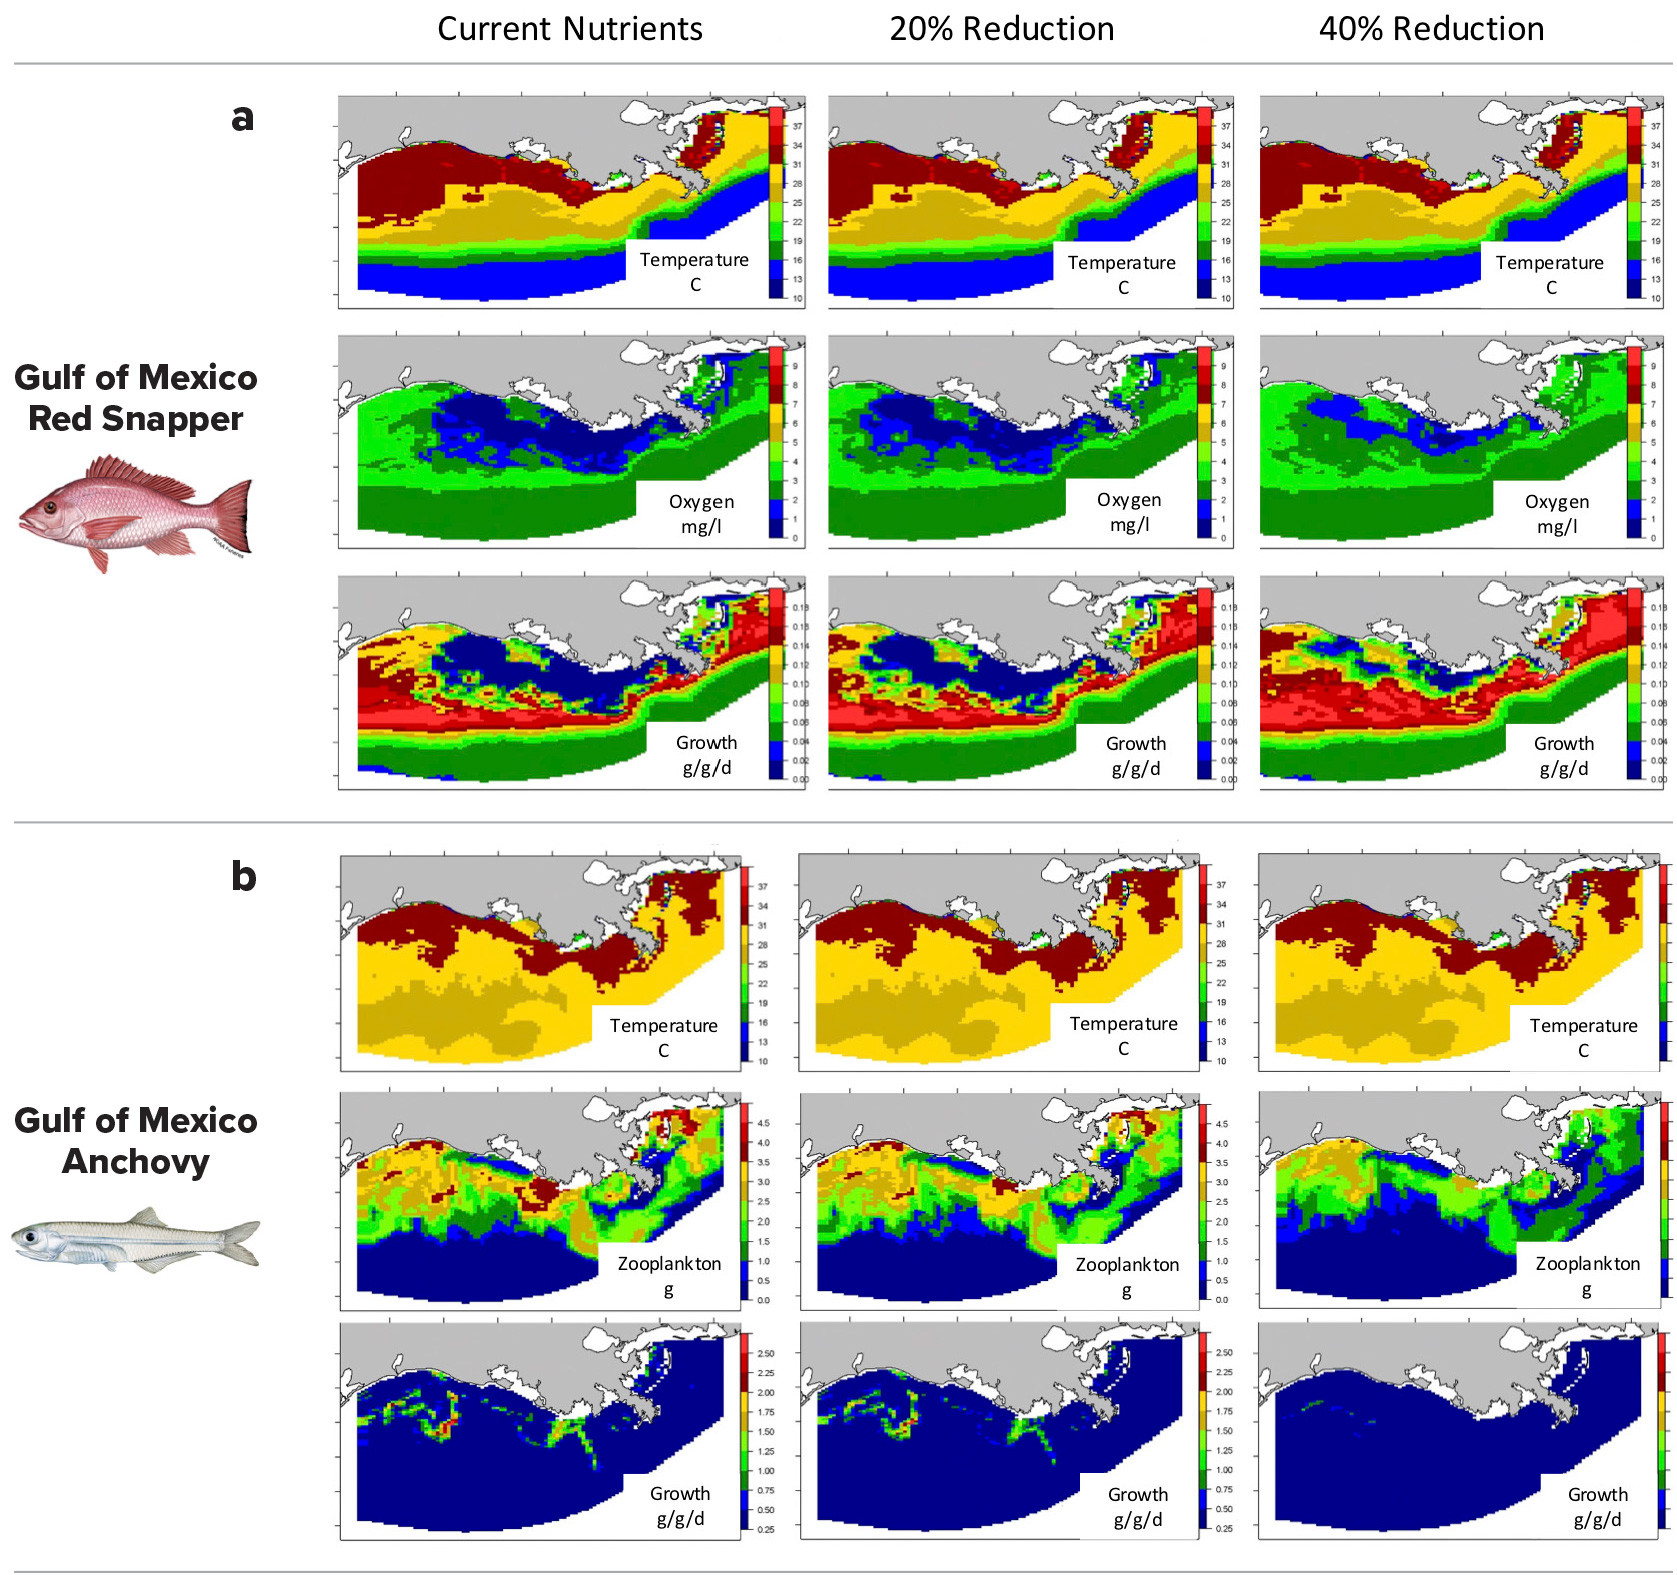
Ship-based observations only provide localized snapshots of seascapes during summer. We used a three-dimensional hydrodynamic water quality model to map functional seascapes across the entire NGOMEX region to predict the combined impacts of proposed nutrient reductions and changes in hypoxia. Regional circulation, water temperature, dissolved oxygen, phytoplankton, and zooplankton concentrations were simulated using a high-resolution implementation of the Regional Ocean Modeling System coupled with a biogeochemical model with 10 state variables (Laurent et al., 2017). The model has 163,840 cells and was run daily over 2000–2016, producing nearly a billion cells for each simulation. We predicted daily GRP for different species in each of these cells for each day under current nutrient loadings, and with 20% and 40% reductions in nutrient loadings.
Figure 4 shows the functional seascape on a single day for red snapper, Lutijanus campechanus, (with stable food supply) across the bottom during August 2004 and for a pelagic zooplankter, anchovy, Anchoa mitchilli, across the surface during June 2014. Red snapper showed some improvements in growth in response to reduced bottom hypoxia during summer (Figure 4a). In contrast, anchovy showed poorer growth in spring because prey resources were reduced with lower nutrient inputs (Figure 4b). Overall, results suggest that fish growth responses to improvements in hypoxia may be dampened by lowered trophic level production, but responses were complex, highly variable from year-to-year, and species-specific.
|
|
APPLICATIONS AND FUTURE DIRECTIONS
Functional seascapes provide a new framework for viewing and understanding the biological significance of spatial patterning in the ocean by directly linking underwater observations to fishes’ vital habitat needs. The approach demonstrated that the same underlying hypoxic conditions can produce consequences that differ dramatically across species and that other factors such as water temperature and food are fundamentally important to these evaluations. The wider use of functional seascapes may help us to (1) better display direct impacts of ocean conditions on fish, (2) identify critical habitats and potential competitors (e.g., overlapping areas of high growth rate potential), (3) better predict how a species might respond to changing environmental conditions such as climate change, and (4) develop more meaningful scaling of spatially complex ocean conditions.

