Full Text
Planktonic organisms are ubiquitous drifters in seas and oceans where they dominate life in terms of abundance and biomass (Bar-On and Milo, 2019). They are essential players in the functioning of marine ecosystems. Among them, microscopic algae called phytoplankton use sunlight to generate biomass from carbon dioxide and water, forming the basis of planktonic food webs, contributing about half of global primary productivity through photosynthesis, and producing about half of the world’s oxygen (Field et al., 1998). Phytoplankton are grazed by slightly larger, yet often still minuscule, animals called zooplankton that in turn are eaten by large predators such as fish or whales. Fish and many seabed-dwelling organisms such as corals or starfish commonly start their lives as zooplankton larvae. But plankton also include protists (flagellates, broadly defined), bacteria, and viruses, far tinier organisms that may feast on zooplankton leftovers or dead cells, or may live as parasites within the bodies of larger plankton cells.
DNA analyses have revealed that less than 10% of the estimated total plankton biodiversity is known and formally described today—and most of the unknown species are smaller than the width of a hair (de Vargas et al., 2015). Plankton diversity is not equally distributed across the ocean. At the global scale, plankton differ from pole to pole according to temperature gradients and the degree of seasonal changes in the environment (Righetti et al., 2019). At local scales, nutrient availability, seasonal environmental variation, and interactions among species or with anthropogenic stressors determine plankton community composition (Beaugrand, 2014).
Because plankton have short lifespans (often days or weeks) and their internal dynamics are tightly linked to global and local environmental conditions, they react quickly to environmental changes. These changes have cascading effects through the food web and significantly impact, for example, commercial fish recruitment. With the ocean under increasing stress from human activities, measuring changes in plankton communities is critical for addressing ocean health and food security and for tracking changes in nutrient and carbon cycles (including the effectiveness or disruption of the biological carbon pump; Zhang et al., 2018).
Plankton diversity can serve as an indicator for tracking anthropogenic environmental disturbances brought about by the maritime industry (e.g., Figure 1), eutrophication, industrial wastewater, invasive species, overfishing, and climate change. Because plankton are sensitive to these stressors, they can serve as sentinels for assessing environmental health; such sentinels are required by the European Marine Strategy Framework Directive (MSFD), adopted in June 2008 (2008/56/CE). Specifically, the Good Environmental Status for pelagic habitats under Descriptor 1 (Biodiversity) is assessed using three common indicators listed in the Convention for the Protection of the Environment of the North-East Atlantic (OSPAR): plankton lifeform index ratios (PH1/FW5), plankton biomass (PH2), and plankton diversity (PH3). In practice, the use of plankton indicators is often limited by the lack of extensive observations with appropriate spatiotemporal resolution. Moreover, our understanding of plankton abundance and diversity is still highly fragmented due to a paucity of data and lack of standardization in sampling and analytical methods.
|
|
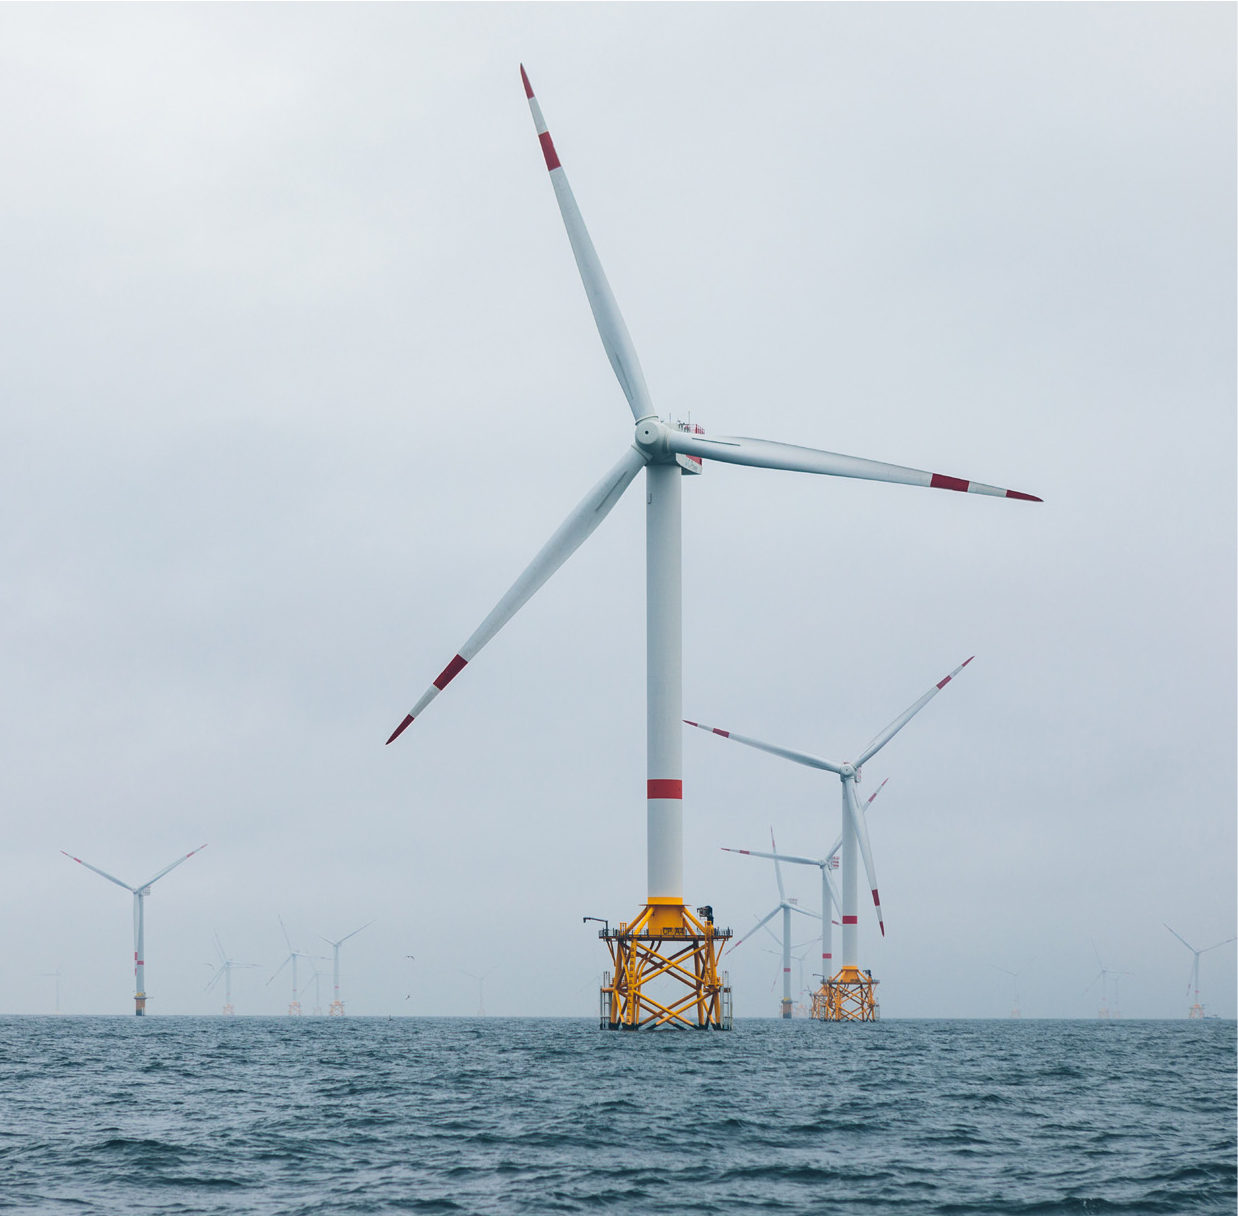
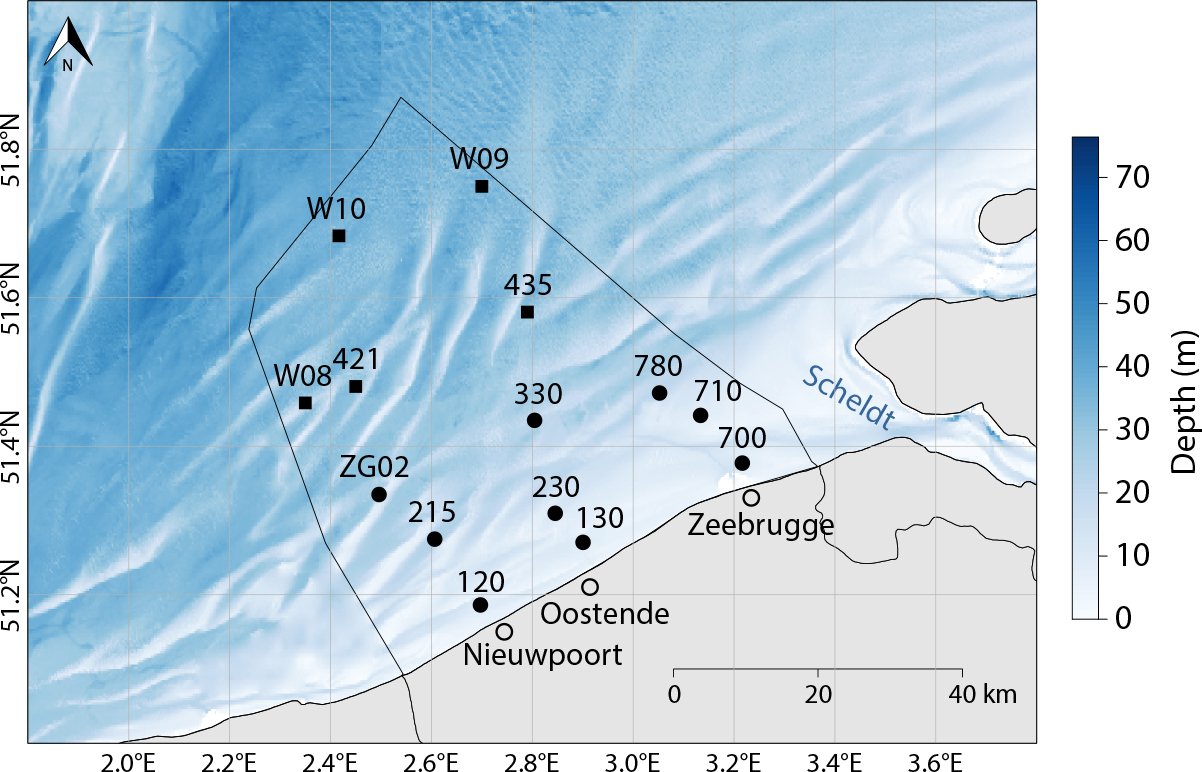
Novel technologies offer opportunities to meet the need for high resolution and continuous plankton data. Working within the frameworks of European research infrastructures such as LifeWatch and the European Marine Biodiversity Resource Centre (EMBRC), the Flanders Marine Institute (VLIZ) has vigorously employed newly available technology to initiate a long-term plankton time series in Belgian coastal waters and sand bank systems (Figure 2). This Long Term Ecological Research (LTER) site covers a salinity gradient that spans from salty Atlantic waters entering the North Sea from the southwest via the English Channel to the less-saline estuaries fed by the large Rhine, Meuse, and Scheldt Rivers in the northeast. This shallow area of the southern North Sea is a highly dynamic environment influenced by strong anthropogenic pressures such as offshore wind farms (Figure 1). As part of the LifeWatch observatory, monthly campaigns are organized with the research vessel Simon Stevin to collect samples of phytoplankton and zooplankton at up to 17 stations (Figures 2 and 3). This plankton monitoring effort uses state-of-the-art equipment and processing methods, from automated classification to more traditional techniques. The data collected on plankton biomass, abundance, and community composition contribute to the MSFD and OSPAR assessments in the southern North Sea.
|
|
|
|
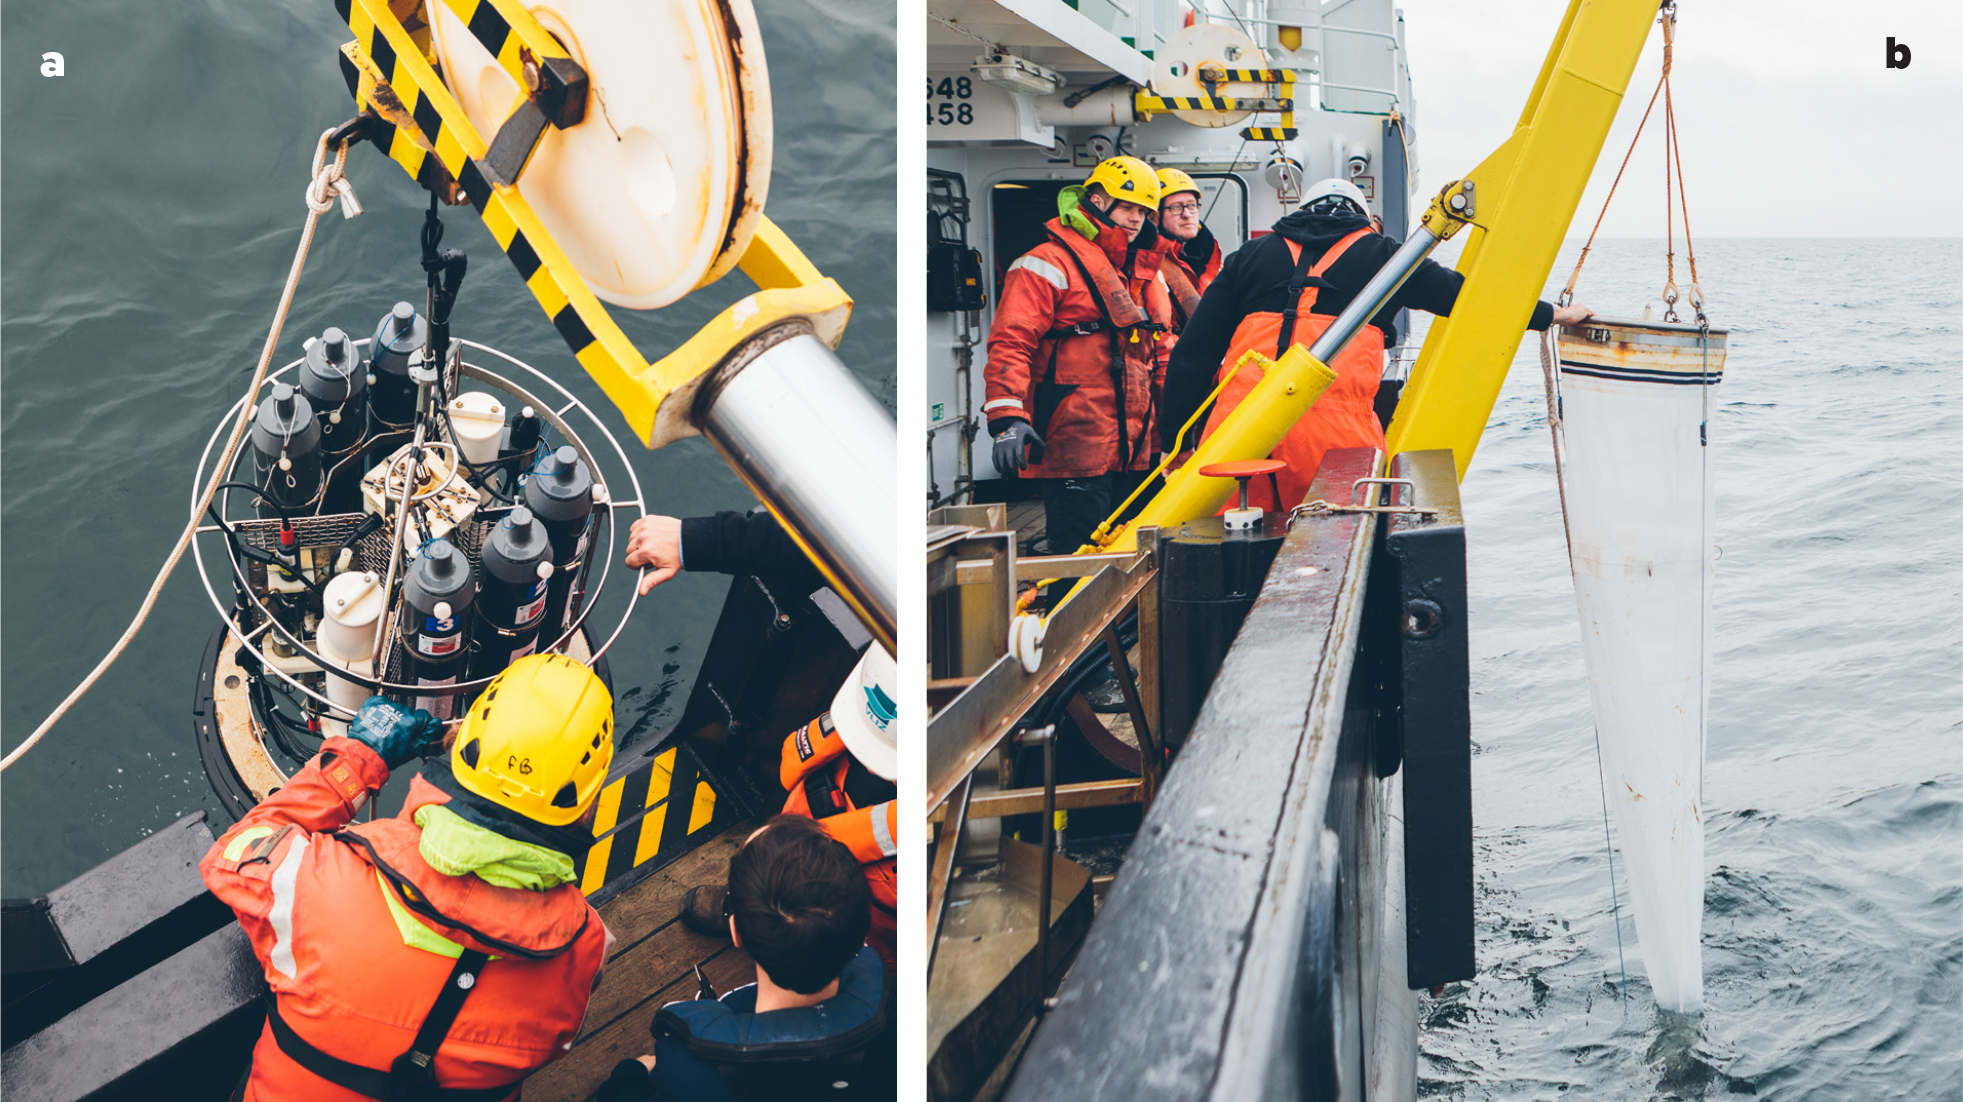
There are many ways to collect and analyze plankton samples, because no single mesh size can effectively capture the broad size spectrum of the plankton. Thus, different methods are combined in order to focus on particular size ranges (e.g., zooplankton, micro- or nanoplankton, bacteria), with necessary precision and accuracy. For long-term monitoring programs, it is important to keep protocols and equipment consistent for the whole time series or, if changes are needed, to have the ability to track modifications.
Once the samples are prepared for analysis, the plankton can be counted manually by viewing them through a microscope. In addition, to understand what is going on in the ecosystem, it is necessary to precisely identify the species present in the samples. However, because planktonic organisms are tiny and often closely resemble each other, highly skilled taxonomists are required to identify them. Although time-consuming, this taxonomic expertise will continue to be needed to advance our understanding of the marine environment, its diversity, and the risks posed by pathogenic, toxic, or otherwise harmful species, and to inform aspects of marine conservation and management.
Increasingly, manual methods are complemented by automatic and semi-automatic devices, allowing sample collection and analysis to be combined and speeded up. When the microscopy glass slides or counting trays are replaced by a narrow photo chamber and the manually operated pipette by thin tubing connected to dosage pumps, we can reach a throughput of several plankton individuals per second. Image recognition algorithms trained by thousands of manually identified photos can then recognize the plankton based on their shapes. However, some organisms, like amoebas, have no specific recognizable shape, and others, like some dinoflagellates, ciliates, and fungi, live as parasites within other planktonic species. Identifying these organisms was very laborious, if not impossible, until the application of DNA-based techniques. Combining both high throughput microscopy and characterization of the DNA pool in bulk plankton samples (e.g., using a technique referred to as metabarcoding) provides a solution to the demands of modern plankton ecology research.
High-Throughput Microscopic Imaging of Unicellular Life
In recent years, a large variety of flow-through plankton imaging instruments have been developed. At VLIZ, we monitor microplankton (50–300 µm) with the help of a FlowCAM (Figure 4). This automated imaging device combines flow cytometry and microscopy to take traditional particle counting to the next level. An image of each particle is taken while it passes the camera’s field of view (Figure 4). From this image, more than 60 particle parameters are calculated, from simple metrics like length and width to more complex metrics like transparency, roughness, and edge gradient (i.e., whether the particle is in focus). In this way, the user can quantify particles, obtain valuable metrics, and create an image library for a water sample in fewer than 30 minutes.
|
|
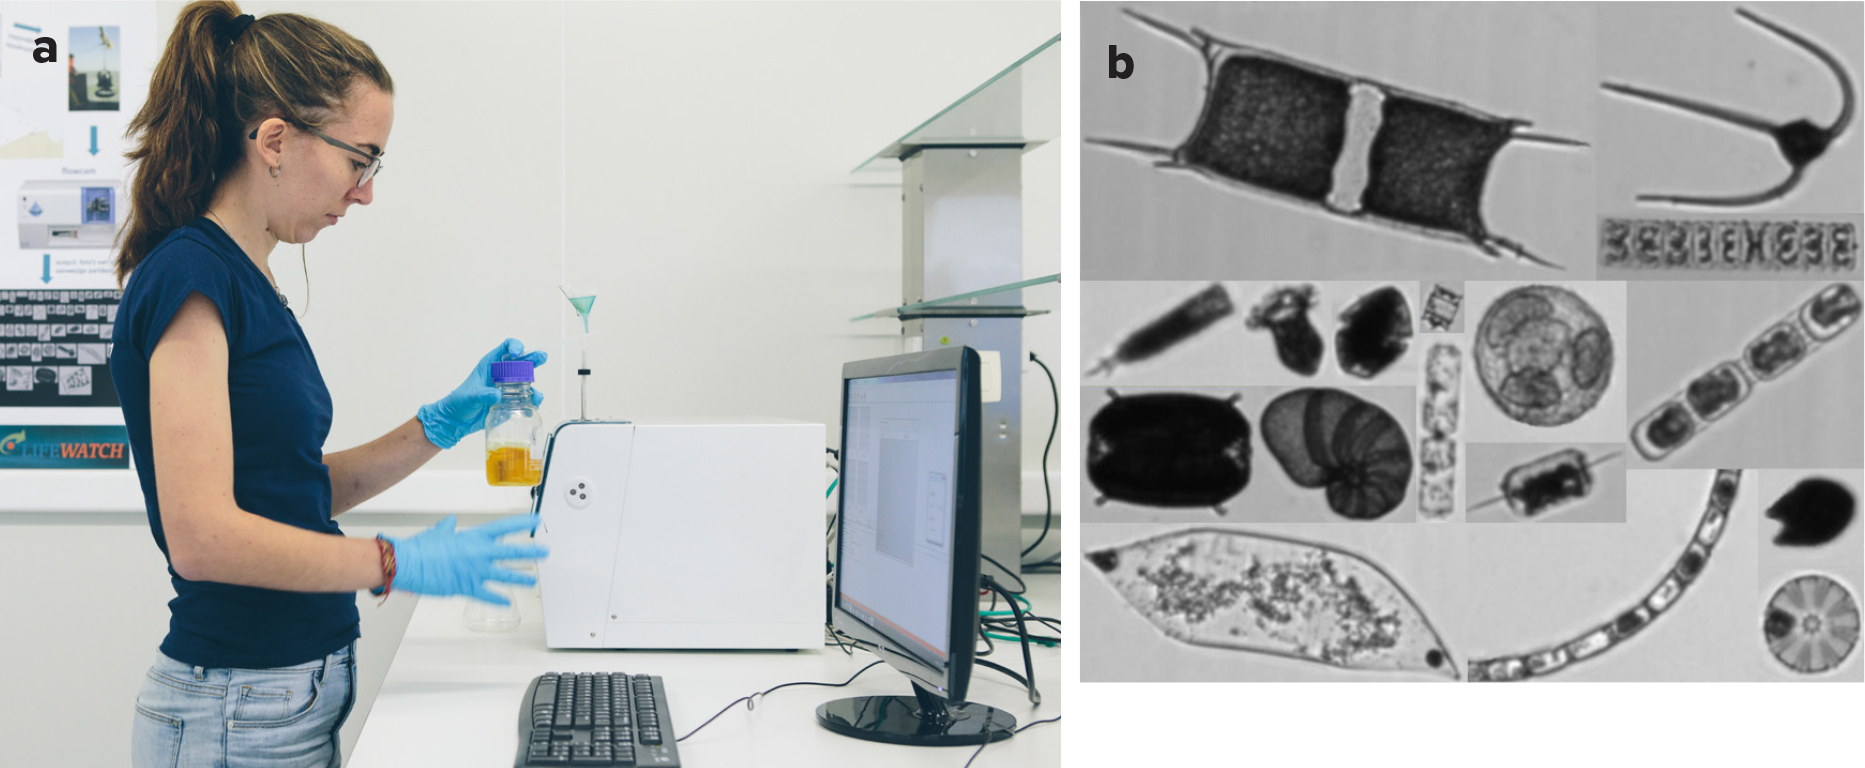
At VLIZ, the monthly sampling campaigns have contributed to the development of an extensive and validated FlowCAM image library. This library enables the use of deep learning approaches for image classification. In collaboration with the Instituto de Física de Cantabria (IFCA), a prototype artificial intelligence (AI) classifier was developed and introduced into the data workflow. Integration of this automated classification system into FlowCAM monitoring reduces time spent on image identification and facilitates faster data releases to the public. Over the past 3.5 years, FlowCAM monitoring has yielded 1.4 million particle images categorized in more than 140 taxonomic groups, with the majority of the phytoplankton groups belonging to diatoms and dinoflagellates and the majority of other groups belonging to ciliates. As different aspects of this FlowCAM monitoring are continuously re-evaluated and evolve, fine-tuning of protocols will lead to increased taxonomic resolution in the data set and expansion of the studied size range to better capture the patchy plankton dynamics in the Belgian part of the North Sea. One of the shortcomings of the FlowCAM and other image-based techniques is the reduced accuracy in taxonomic identification compared to traditional microscopy. To better quantify plankton community composition, models for image-based classifications will need to be improved and image-based information could be combined with genetic approaches (see below).
Scanning Biodiversity
Not all plankton fit through the narrow FlowCAM tubing. Larger zooplankton such as crustaceans or larvae of fish and seafloor-dwelling organisms can be imaged with the ZooScan. This device is essentially a high-resolution (4,800 dpi) flatbed scanner onto which the sample is poured (Figure 5). ZooScan does not distinguish among closely related species, and the identification is conducted at a higher taxonomic rank. But many zooplankton have larval stages that go through one or several metamorphoses until they resemble their parents, and automated analysis of scanning images is effective in distinguishing among these early life stages. The ZooScan therefore informs us not only about the taxonomic composition of zooplankton communities but also about their developmental stages. In addition, image analysis can be used for standardized size measurements, providing information on growth and ecology of the scanned organisms. Upscaling image recognition to the next level with the use of AI and the implementation of all our 2.2 million validated images will further exploit the potential of this technique, as the accuracy of prediction will rise, whereas the time spent on manual validation will drop.
|
|
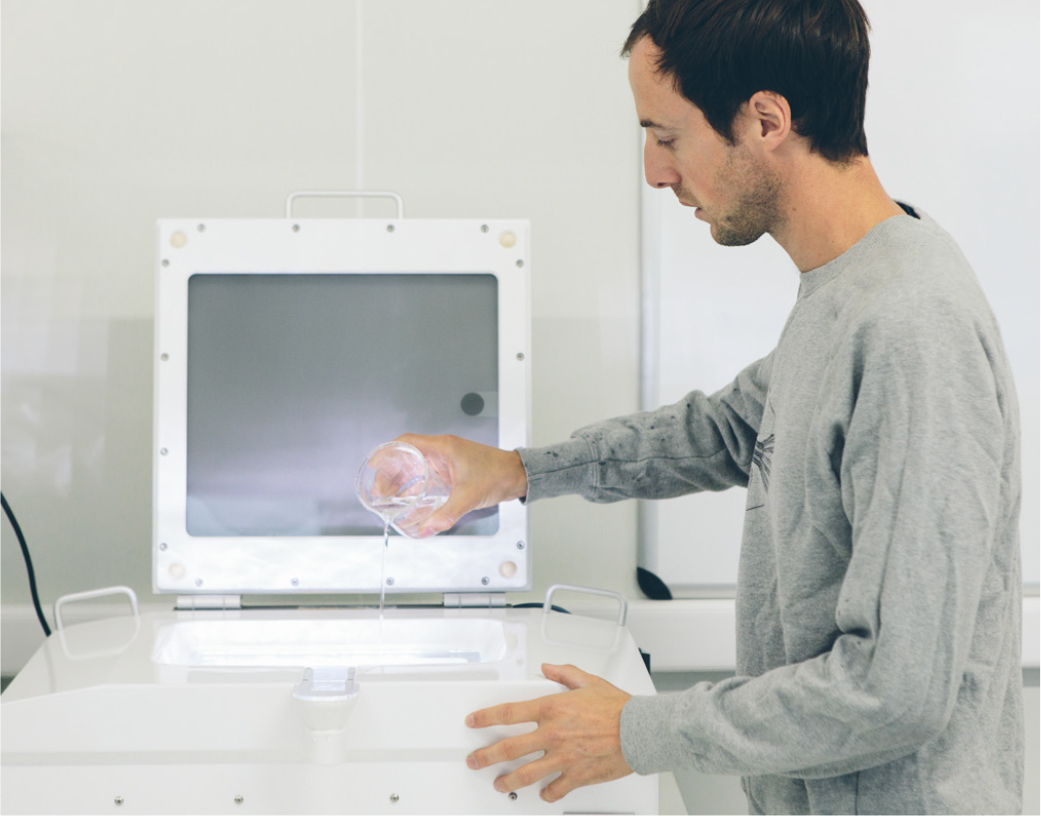
To date, 976 samples collected between January 2014 and December 2020 have been scanned, resulting in 2,218,383 scanned particles, stored into 22 taxonomic groups. These samples are both bio-archived as physical samples (enabling genomic analysis or taxonomic analysis by microscopy at a later stage) and stored digitally as Darwin Core Archives (DwC-A) for dissemination to other frameworks, such as the European Ocean Biodiversity Information System (EurOBIS).
Under the Waves
In the new era of advanced optical techniques, it is no longer necessary to collect physical samples, as the Video Plankton Recorder (VPR) can provide direct images. This device is towed behind a ship and contains a high-speed camera that takes photos of planktonic organisms as they pass by (Figure 6). Because photos are taken in the water column, the VPR observes fragile forms of marine life without damaging them, enabling registration and quantification of gelatinous plankton, colony-forming species, and dead organic particles (called “marine snow”) more effectively than net sampling. For example, the VPR can quantify colonies of Phaeocystis spp., a harmful algal species that can often be seen as thick layers of white foam along the Belgian coast in spring.
|
|
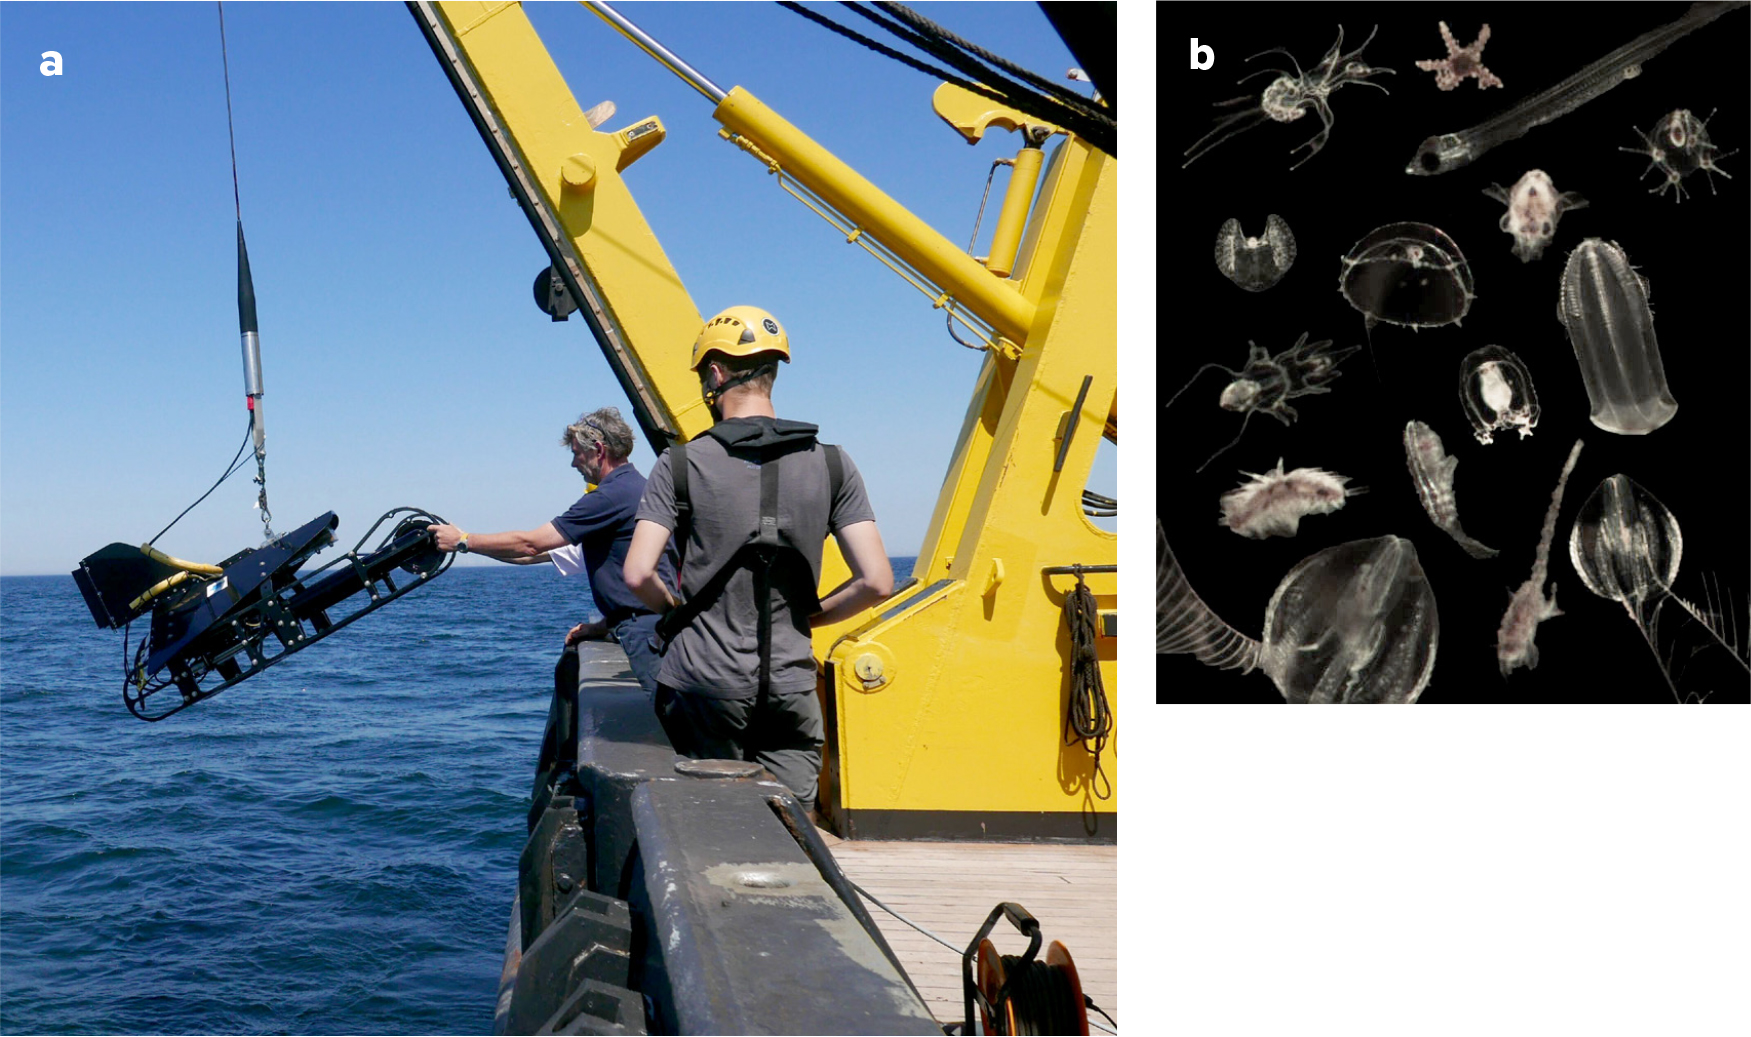
Because data are collected in situ, the VPR permits analysis of plankton clouds at high resolution in three dimensions along with observations of their reactions to water quality, vertical stratification, or marine snow. Using this method, we observed that densities of certain plankton species can strongly differ between bottom and surface water layers. Furthermore, having the plankton samples in a digital format opens up the potential to accelerate the classification procedure. So far, the biggest challenge for us is to build an automated classifier that can process and validate the millions of collected images that are still validated manually but that contribute to the growing image library that will serve as a learning set for future classifiers.
Barcoding Biodiversity
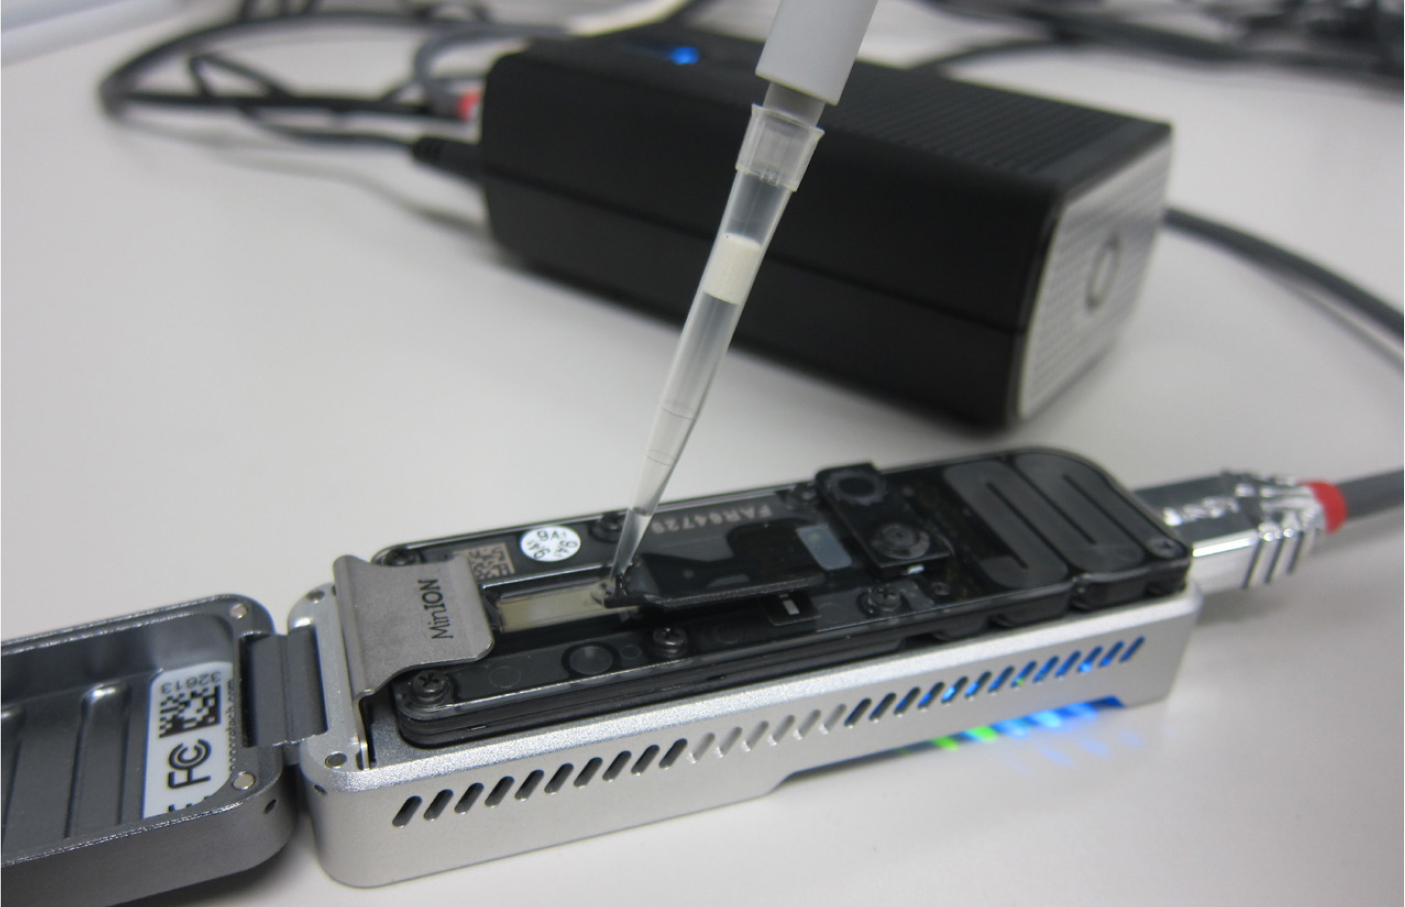
The DNA of a plankton sample is all that is needed to identify the species using a technique called metabarcoding. A short sequence of DNA—called a barcode—is rapidly copied from the original DNA mixture using the polymerase chain reaction (PCR) method, and then read in a sequencing apparatus. The basic premise of this approach is that each species can be identified by its unique genetic barcode (Hebert et al., 2003; de Vargas et al., 2015). At this stage, no taxonomic expertise is needed to process the sample, and we can easily scale up the throughput by using liquid-handling robots and 96 well plates. Metabarcoding has long been a cumbersome method requiring large, bulky, and expensive DNA sequencing equipment. We therefore turned to nanopore sequencing technology, which allows us to perform all analyses in our own laboratory with a handheld device (Figure 7), thus reducing the time to first results from weeks to days or even hours. The largest bottleneck in metabarcoding approaches is arguably the incompleteness of reference databases. While we can easily generate thousands of barcodes, each of them needs to be compared to a reference database that links species names with their barcode. These databases are still incomplete, so especially for microscopic species, we might obtain sequences that are unique to their species, but it is difficult or impossible to confidently assign them a taxonomic name.
|
|
An important application for which we use DNA metabarcoding is recognizing non-indigenous species. For example, using this method, we recently detected the invasive copepod Oithona davisae from the Indo-West Pacific for the first time in Belgian waters. This tiny zooplankton species has probably been living in the area for years, but no funding or expertise were available for microscopy-based monitoring. There is no question that more thorough sequencing will yield a host of such previously undetected invasive species in the near future.
Genetic Data Reveal the Behavior and Function of Organisms
Image and DNA-based methods identify and classify planktonic life, but they are not designed to answer a key question in plankton research: What are these oceanic drifters doing? Evaluating how global change is affecting the plankton community is key to predicting our ocean’s future. Laboratory experiments usually infer the functional response of plankton to variations in one or two factors, for example, temperature and pH, under controlled conditions. This approach fails to describe the broad spectrum of responses that can be expected in a natural community experiencing a multitude of interactions, behaviors, and other ecological effects that occur with environmental variation. Recent advances in both molecular genetics and computational biology greatly facilitate drawing an increasingly accurate and detailed picture of the functional activity within plankton ecosystems (Carradec et al., 2018).
The functions of an organism’s individual proteins are encoded in its DNA sequence, which translates proteins via the intermediate messenger RNA. At this intermediate state, the translation can be intercepted, and the activity of gene translation can be quantified. These strings of RNA sequences will then be counted and compared with databases containing sequences of known functions. This method is easily scalable for application to mixed plankton samples, and it provides a functional profile of a plankton community. Yet, this method is still far from perfect. One reason is the incompleteness of plankton reference databases. In most studies, only about 50% of sequences can be assigned to genes with known functions. The remainder is the biological “dark matter” of plankton genetics.
We recently set up a multiyear spatiotemporal sampling effort to generate environmental metatranscriptomic data. We sample surface water micro-eukaryotic plankton from fixed locations monthly, with additional diurnal sampling events. From a pilot sequencing run on 12 samples from different seasons, 818,009 gene-containing sequences were assembled. Differential expression of these genes gave us a first insight into how the metabolism of different North Sea plankton assemblages shift over time and space.
Mainstreaming Automated Biodiversity Observations
The FlowCAM, ZooScan, VPR, and DNA-based methods demonstrate that plankton data collection can be automated to a great extent. By reducing the number of expensive human work hours, more samples can be acquired and processed for the same cost, increasing spatial and temporal resolution of ecological observations. But improved automation and processing speed is not the only goal here. Machines do not have human subjectivity, which is needed to better standardize data collection across countries and make data sets more useful for global analyses. Researchers worldwide are now further automating plankton data collection by mounting continuously operating instruments on platforms such as autonomous underwater vehicles, drifters, or buoys, potentially reaching very remote areas of the planet.
Automated sample processors may be combined into networks not only across countries but also within the same area for detecting different organisms or assessing plankton size fractions. Ecological processes act across taxonomic groups, for example, in food webs. Deploying as many different sampling techniques as possible and combining them with sensors for abiotic measurements enables us to gain insight into relevant ecological processes such as the global carbon cycle.
Automatic collection of large data sets is pushing plankton research further into the field of big data science and providing systems-level insights. With such data sets, we eventually will be able to study not only the presence and abundance of plankton but also how different species interact in ecological networks. We urgently need such understanding to be able to predict and mitigate adverse effects of global environmental change, including tipping points where interactions between species and their environments change nonlinearly. We have no option but to embrace new technologies at global scale to understand our ocean in a mandatory step toward preventing further harm to its health.