GARNERING OCEAN TIME SERIES TO SPAN SUBDIURNAL TO DECADAL PROCESSES
Over the last several decades, accelerated rates of human-caused climate change have modified the Earth system’s complex natural variation. Ocean time-series stations were established after it was recognized that ocean observing through short-term process studies and infrequent hydrographic surveys was not fully capturing temporal dynamics and drivers. There was a clear need to contrast the spatial patterns observed through surveys with temporal patterns in the evolution of ocean-climate connections, ecosystem function, fisheries productivity, and the drivers of biogeochemical variability at seasonal to interannual timescales. This was the motivation in the 1980s for establishing several long-term, multidisciplinary, ship-based ocean time-series stations that have generated fundamental knowledge about ocean variability and change over time (Benway et al., 2019).
These types of ship-based time-series stations are both essential and rare. They are essential because they provide the ability to collect and preserve samples and the capability to perform complex analyses in at-sea laboratories; real-time feedback from this work allows scientists to adapt sampling strategies on the fly. This leads to the ability to produce the highest-quality data and to make more types of ocean measurements on a ship than can be accomplished using any other observing platform. These stations are rare because they require a stable, long-term commitment to a complex ship-based effort, which is challenging as availability of research vessels declines (NRC, 2015). Of the seven ship-based ocean time series that support ocean carbonate chemistry observations profiled by Bates et al.(2014), six remain.
Advances in autonomous ocean observing approaches in the 1980s created opportunities to expand the number of ocean time-series sites and supported new research addressing unknowns about ocean conditions in remote locations, air-sea interaction during storms, and high-frequency variability. Moored buoy infrastructure was established at NOAA’s Pacific Marine Environmental Laboratory (PMEL) to address these unknowns, provide the ability to improve predictions of the El Niño-Southern Oscillation (ENSO) and its impacts (McPhaden et al., 2023, in this issue), and validate and assess models and satellite data at several ocean climate reference stations (Cronin et al., 2012, 2023, in this issue).
In the early 2000s, as a complement to ship-based ocean carbon time series and the growing moored climate observing infrastructure for weather and climate, PMEL explored whether new technologies could be used in an observing network to better understand subdiurnal to interannual variability in air-sea CO2 fluxes. In situ, moored observations of marine carbon chemistry further expanded the timescales from subseasonal dynamics characterized by ship-based time series to higher frequencies. These daily to seasonal timescales are particularly important for constraining CO2 flux in the tropical Pacific, the largest natural oceanic source of CO2 to the atmosphere. Ship-based observations revealed that ENSO contributes significantly to the annual variability in atmospheric CO2 by driving large interannual variation in ocean CO2 outgassing (Feely et al., 1999, 2006), but how the transition between ENSO events evolved was insufficiently captured by ships. Advancements in buoy-based ocean carbon technology were already leveraging the Tropical Atmosphere Ocean (TAO) array by deploying and testing new autonomous CO2 sensors (Friederich et al., 1995; Chavez et al., 1999). PMEL advanced this technology in order to improve and expand autonomous air-sea CO2 time-series observations across the equatorial Pacific to track the evolution of El Niño and La Niña events.
Autonomous technology for measuring the difference between atmospheric and surface ocean partial pressure of CO2 (ΔpCO2) developed at the Monterey Bay Aquarium Research Institute utilized an air-seawater equilibrator combined with an infrared CO2 gas analyzer, similar to the methodology of the benchmark pCO2 measurements conducted in underway mode on ships. PMEL further developed the technology by adding an in situ calibration with a World Meteorological Organization (WMO) certified CO2 reference gas that allowed separate measurements of air and seawater CO2 components, while also creating a robust, embedded system that could be replicated at scale to provide real-time, high-quality data for year-long deployments (Sutton et al., 2014b). These directly measured and calibrated seawater pCO2 observations have a measurement uncertainty of ≤2 µatm, or approximately 0.5% µatm within the calibrated range, compared to the slightly lower quality (~3% uncertainty) of seawater pCO2 calculated from discrete water sample dissolved inorganic carbon and total alkalinity. The transfer of the Moored Autonomous pCO2 (MAPCO2) technology to a commercial partner made it accessible to the larger scientific community, leading to MAPCO2 systems that provide air-sea CO2 observations beyond the TAO array to the Surface Ocean CO2 Observing Network, the Global Ocean Acidification Observing Network, OceanSITES, the Research Moored Array for African-Asian-Australian Monsoon Analysis and Prediction, Australia’s Integrated Marine Observing System, the European Integrated Carbon Observation System, and others.
Autonomous time series of air-sea CO2 observations have been used extensively to quantify and determine the drivers of subdiurnal to interannual variability in surface seawater pCO2 and CO2 flux in the subtropical Pacific (Sutton et al., 2017; Chen et al., 2021), equatorial Pacific (Sutton et al., 2014a; Pittman et al., 2022), Bay of Bengal (Ye et al., 2022), Southern Ocean (Shadwick et al., 2015; Pardo et al., 2019), and coastal (Xue et al., 2016; Reimer et al., 2017; Fassbender et al., 2018; Chen and Hu, 2019) and coral reef ecosystems (Drupp et al., 2011, 2013; Massaro et al., 2012; Terlouw et al., 2019). These data have been used to develop upper-ocean carbon budgets, which revealed evidence that calcifying organisms play an important role in the biological pump in the northeastern Pacific (Fassbender et al., 2016) and showed how seasonal processes and episodic events control the timing of winter mixing and carbon export in the northwestern Pacific (Fassbender et al., 2017). High-frequency, autonomous time series also provide the opportunity to observe ocean response to the passing of rare or infrequent episodic events. Surface ocean pCO2 observations from buoys have been used to assess the impact of tropical cyclones (Bond et al., 2011; Wada et al., 2013; Ye et al., 2019) and iron deposition from volcanic eruptions (Hamme et al., 2010) on upper ocean carbon.
UNIQUE APPLICATIONS OF OCEAN TIME SERIES
One of the unique values of ocean time series is their resource as a long-term, historical baseline (Figure 1a). Process studies are often co-located with existing time-series assets to place the conditions encountered during short field campaigns in the context of local variability and change over longer time periods. Importantly, ocean time series not only serve today’s research questions but also will be a resource for understanding phenomena not yet known in a rapidly changing ocean. In the two decades since PMEL first established a buoy-based air-sea CO2 observing network, ocean acidification and marine heatwaves have emerged as growing threats to marine ecosystems (Bednaršek et al., 2022). The historical data from these time series are now being applied to assess carbonate chemistry in coral reef ecosystems (Courtney et al., 2016; Melendez et al., 2020, 2022) and biogeochemical responses to marine heatwaves (Siedlecki et al., 2016; Lilly et al., 2019; Mogen et al., 2022). In response to these emerging research needs, PMEL began to augment autonomous air-sea CO2 time series on surface buoys with additional biogeochemical sensors to better capture these processes (Sutton et al., 2016).
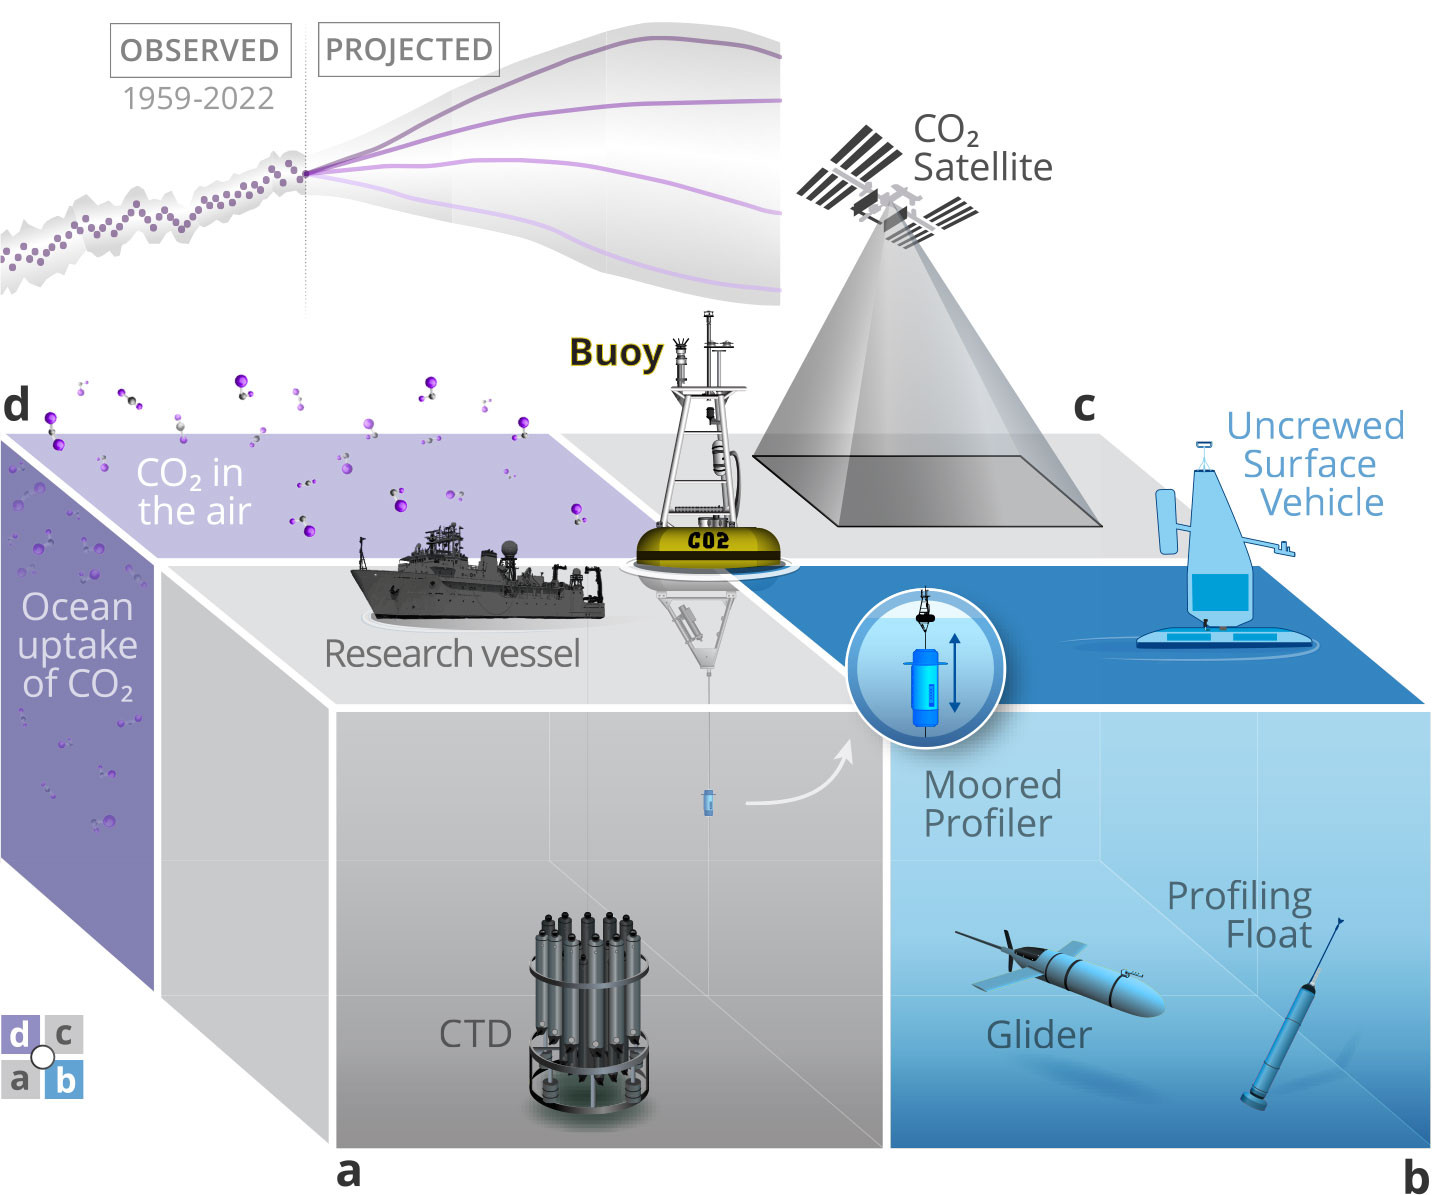
FIGURE 1. Schematic representation (not to scale) of the unique applications of autonomous air-sea CO2 and ocean acidification time series on moored buoys: (a) historical baseline, (b) technology testbed, (c) validation, and (d) tracking the ocean response to CO2 emissions and future mitigation efforts (also depicted as a time series of observed and projected global ocean CO2 uptake). > High res figure
|
Existing high-frequency time-series observations of known quality are also leveraged as a shared resource for developing and evaluating new observing technologies, such as moored profilers and floats (Figure 1b), and they have provided critical data sets for constraining the measurement uncertainty of new sensors (Fassbender et al., 2015; Chu et al., 2020). Experience with designing and maintaining MAPCO2 systems on buoys also facilitated the integration of modified air-sea CO2 technology on moving autonomous platforms (Sabine et al., 2020). Uncrewed surface vehicles are now expanding air-sea CO2 observing capabilities to regions that have been historically difficult to measure, such as the Gulf Stream during harsh winter conditions (Nickford et al., 2022) and the Southern Ocean (Monteiro et al., 2015; Sutton et al., 2021; Nicholson et al., 2022), where new observations are being used to constrain uncertainties in CO2 flux estimates and assess the mechanisms driving flux.
Satellite and model validations also rely on in situ observing time series (Figure 1c). Along with air-sea CO2 measurements, bulk estimates of CO2 flux require wind speed, which is often retrieved from satellite-based products. The resulting estimated CO2 flux can vary significantly depending on choice of wind speed product. Buoy-based in situ wind speed measurements have been key to assessing how the bias of these different wind speed products impact flux estimates in different regions (Sutton et al., 2017; Chiodi et al., 2019). In situ air-sea CO2 observations were also necessary to validate an anomalous atmospheric CO2 signal measured by the Orbiting Carbon Observatory-2 satellite during the early stages of the 2015–2016 El Niño event (Chatterjee et al., 2017). This unique view of the full temporal behavior at key locations is also an asset for validation of models and predictive algorithms. High-frequency autonomous data are used to evaluate temporal variability in regional to global predictions of pCO2 (Rödenbeck et al., 2013; Joshi et al., 2022; Sharp et al., 2022) and to constrain (Torres et al., 2021) and evaluate simulated diurnal variability in models (Kwiatkowski et al., 2022).
Finally, long-term air-sea CO2 observations support the growing need to track the ocean response to CO2 emissions and eventual mitigation (Figure 1d). These data are supplied to the Surface Ocean CO2 Atlas, which is used to constrain annual ocean CO2 flux estimates in regular climate assessments such as the Global Carbon Budget. Improved constraint of the background ocean CO2 sink is essential for tracking future impact of mitigation efforts, such as CO2 removal technologies and approaches. The COVID pandemic and resulting reduction in CO2 emissions provided a case study for detectability of the effect of reduced atmospheric CO2 on surface ocean pCO2 and pH, resulting in the finding that atmospheric CO2 reductions would have to be four times what occurred during the COVID pandemic in order to observe a detectable change in air-sea CO2 (Lovenduski et al., 2021).
EMERGING INDICATORS OF CHANGING OCEAN CARBONATE CHEMISTRY
The PMEL autonomous air-sea CO2 time series are currently operating on 33 buoys, 21 of which also include surface seawater pH measurements for observing ocean acidification (Figure 2). Most of these time series are located in the Pacific Ocean and were primarily initiated through partnerships within PMEL and with regional colleagues. PMEL also assisted colleagues in Australia to establish the first autonomous air-sea CO2 time series in the Great Barrier Reef (now expanded into a network of buoys in Australian coastal waters) and colleagues in South Korea to establish ocean acidification time series in western Pacific coral reef ecosystems. Further geographic distribution of autonomous time series is leveraged by European-led observations using different pCO2 sensors in the North and tropical Atlantic. In the PMEL-led network, 15 of the buoys are located in the open ocean, 12 in temperate and subtropical coastal systems, and six in coral reef ecosystems. Of the dozen sites that have been discontinued since the start of the program, 80% are coastal and coral reef locations, highlighting the challenge of maintaining sustained support for long-term time series in coastal ecosystems.
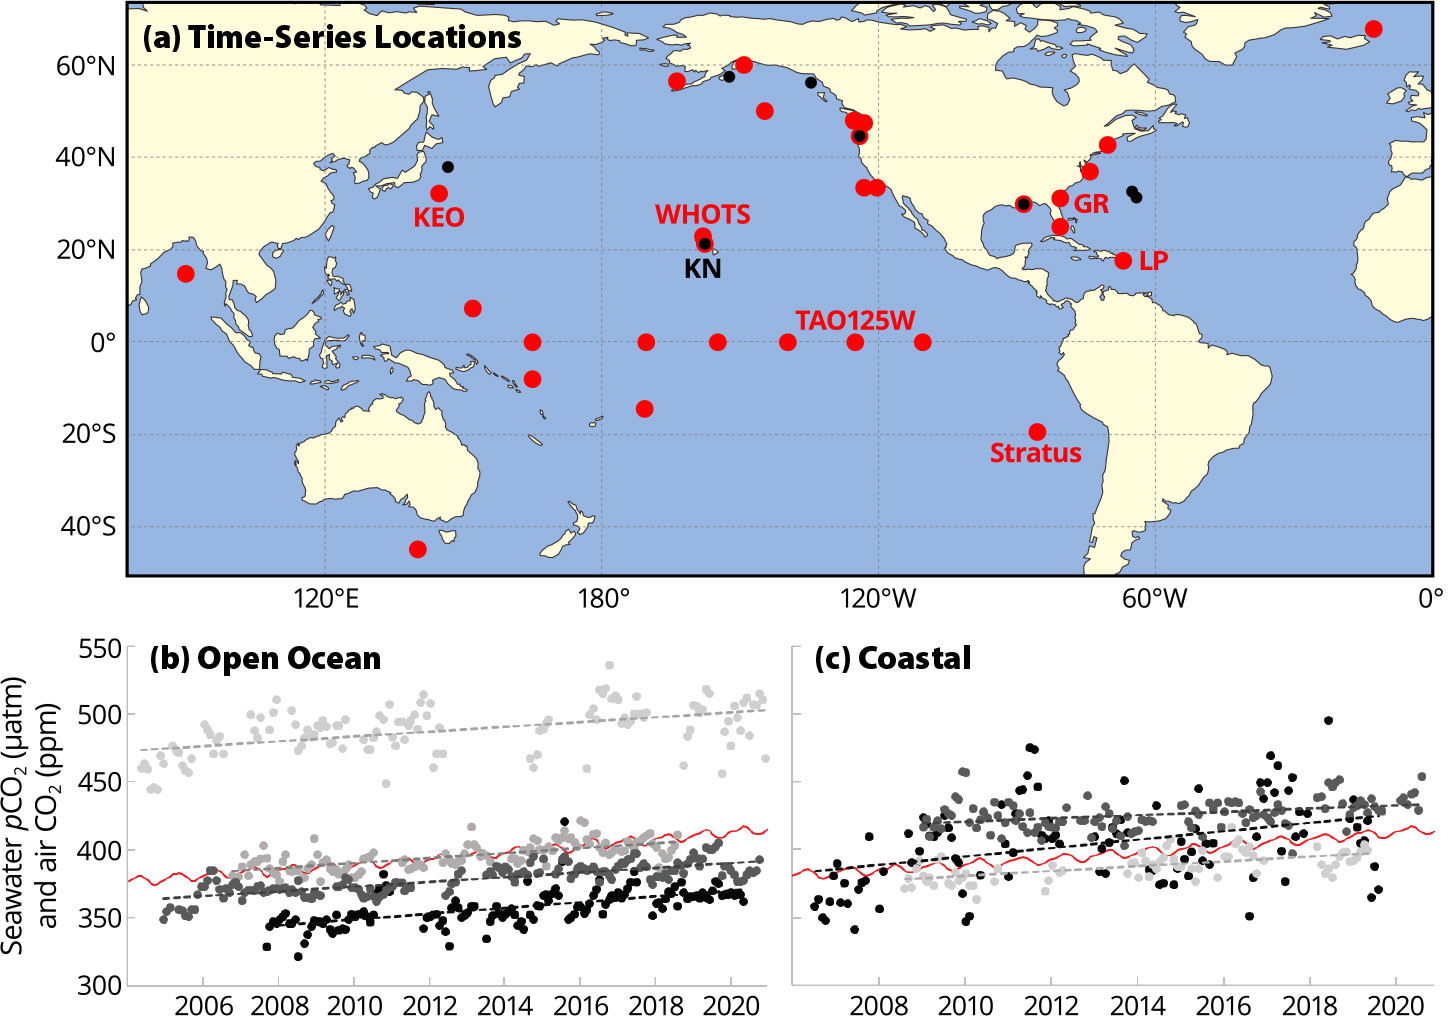
FIGURE 2. (a) Operational (red) and discontinued (black) air-sea CO2 and ocean acidification buoy time-series sites led by PMEL. (b) Trends (lines) of de-seasoned monthly means (circles) of surface seawater pCO2 measured at open ocean buoy time series. From dark to light: PMEL Kuroshio Extension Observatory (KEO) buoy, Woods Hole Oceanographic Institution (WHOI) Stratus buoy (Stratus), National Data Buoy Center (NDBC) TAO equatorial buoy at 125oW (TAO125W), and the WHOI Hawai‘i Ocean Time-series buoy (WHOTS). Mauna Loa Observatory monthly mean CO2 is also shown in red (Lan et al., 2022). (c) Same as panel b but measured at coastal buoy time series. From dark to light: NDBC buoy in Gray’s Reef National Marine Sanctuary (GR), Caribbean Coastal Ocean Observing System La Parguera buoy in Puerto Rico (LP), and the discontinued University of Hawai‘i Kilo Nalu buoy (KN). > High res figure
|
The PMEL network represents over half of the world’s long-term (at least 10 years) ocean carbonate chemistry time series currently collecting and providing publicly available data at subseasonal timescales from ships or buoys. Records of this length and sampling frequency are particularly useful for evaluating trends in surface ocean carbonate chemistry (Sutton et al., 2019, 2022). There is increasing demand for understanding how ocean acidification is progressing in different regions, with ocean acidification and seawater pH being included as indicators tracked by the WMO and the United Nations. Like the Mauna Loa Observatory atmospheric CO2 record, open ocean surface carbonate chemistry time series can help characterize the background climate signal, tracking whether the ocean is keeping pace with atmospheric CO2 trends. The open ocean sites in the PMEL network include the world’s longest record of air-sea CO2 measured from a buoy, recorded at the TAO equatorial buoy at 125°W (Figure 2) since 2004. For time series long enough to detect a statistically significant trend, surface seawater pCO2 rates of change are similar at several locations across the Pacific (Figure 2b). However, trends in coastal regions are more variable (Figure 2c) because ocean acidification co-occurs with natural processes that may enhance variability and with human-caused processes such as eutrophication and marine heatwaves. This complicates the efforts of coastal communities seeking to understand how these changes may collectively impact local marine resources and ecosystems.
Long-term trends are one common metric for understanding ocean change. Another emerging application of high-frequency autonomous time-series observations is development of exposure metrics, such as identifying when and where conditions cross biologically relevant thresholds or fall outside the bounds of pre-industrial natural variability (Sutton et al., 2016). Figure 3 shows an example from the US West Coast where three-hourly PMEL surface ocean carbonate chemistry observations are used to identify how many days per year aragonite saturation falls below pre-industrial conditions. The method for determining pre-industrial bounds of variability is described in detail in Sutton et al.(2016), which assumes that the seawater pCO2 increase since pre-industrial times at these locations has been equivalent to atmospheric CO2 increase, but that variability has not changed significantly. Assessing this metric over a decade reveals significant interannual variability in how often the California Current Ecosystem (CCE) is exposed to conditions to which its organisms are not adapted and that may be harmful to their survival. Because of lower overall variability compared to the northern CCE, the southern CCE locations have longer exposure to conditions that did not exist in pre-industrial times. In some years, conditions at all sites rarely exceed pre-industrial natural variability, and in the highest exposure years, pre-industrial conditions are exceeded up to 40% of the year. Building a record of these types of metrics over time will help to assess interannual drivers of exposure, including how aragonite saturation conditions may impact fisheries and ecosystem health. Regular reporting of ocean acidification metrics can also be an effective outreach and education tool for communicating ocean acidification status to decision-makers and the general public.
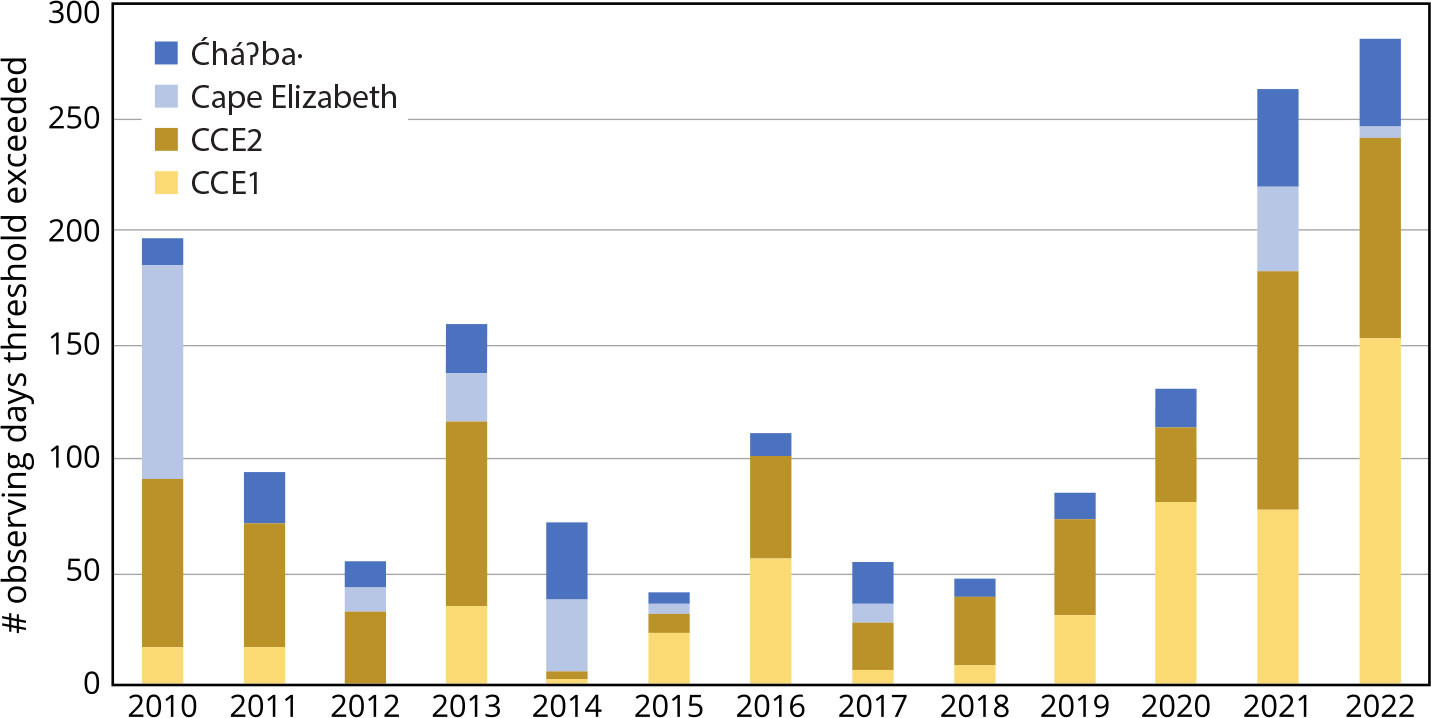
FIGURE 3. Number of observing days per year that aragonite saturation state falls below the pre-industrial bounds of variability in the California Current Ecosystem (CCE), following methodology of Sutton et al. (2016). The University of Washington Ćháʔba· (dark blue) and NDBC Cape Elizabeth (light blue) buoys are located in the northern CCE, and the Scripps Institution of Oceanography CCE2 (brown) and CCE1 (yellow) buoys are located in the southern CCE. > High res figure
|
TRANSITIONING AUTONOMOUS OCEAN CARBON OBSERVING FROM EXPERIMENTAL TO SUSTAINED
What started, in many cases, as research projects or technology development demonstrations has evolved into a network of sustained air-sea CO2 and ocean acidification time series equipped surface buoys. This has required sustained funding for the carbon observations that are primarily supported by NOAA’s Global Ocean Monitoring and Observing (GOMO) program and Ocean Acidification Program (OAP), as well as sustained funding from a variety of state, federal, and international sources that supports collaborators who maintain the moored buoys. In most cases, short-term research funding has materialized into long-term support as it becomes widely accepted that ocean climate records provide unique capabilities (Figure 1) that complement other approaches within the global ocean observing system (Speich et al., 2019). The longer time series are maintained, the more timescales they characterize and the more valuable they become.
PMEL has worked with >100 scientists and engineers to build and maintain this network over the past two decades. These partnerships have worked for many reasons, including having a shared vision and commitment to long-term time series and their societal applications (Musielewicz et al., 2023, in this issue). In the transition from research project to sustained network, publishing transparent methods (e.g., Sutton et al., 2014b) and dedicating ample time to data quality control, management, synthesis, and access (e.g., Sutton et al., 2019) have been key to demonstrating measurement quality sufficient for inclusion in regular climate products and assessments. Establishing operational elements, like standard quality assurance and data quality control procedures, is essential for providing trustworthy climate records, and this up-front investment in time eventually leads to more research and innovation opportunities.
In the next couple of decades, the ocean times-series community will face several new challenges. Many time series rely on aging technology, including the ships that make the time-series measurements or service the buoys. Autonomous observing technology requires regular updates and replacements as key elements and components become obsolete. Without a significant reduction in cost of autonomous ocean carbon sensors, building capacity in regions without access to funding and research infrastructure will continue to be challenging. Addressing knowledge gaps on the physical and biogeochemical drivers of biological productivity and ecosystem health will require sensor development and the integration of physical, chemical, and biological data. To fully constrain ocean carbonate chemistry, two carbon parameters are necessary to directly monitor ocean acidification. Carbon sensors currently available measure pCO2 and pH, but the covariance of these two parameters make them a non-ideal pairing for predicting the rest of the carbonate system. Sensor development and transfer to commercial production is needed to make autonomous dissolved inorganic carbon and total alkalinity measurements more available. Expanding ocean forecasting capabilities in order to predict ocean acidification impacts will require advancements in modeling and high-quality real-time data and derived products for data assimilation.
These challenges can be overcome but need to be rapidly addressed in order to meet ocean carbon observing requirements over the next decade (Aricò et al., 2021). Continued and enhanced ocean carbon observations are foundational to improved understanding of the ocean response to acidification and to development of potential ocean-based solutions for mitigating and adapting to climate change. They must be sustained and expanded to quantify and track changes in the ocean CO2 sink and the progression of ocean acidification from local to global scales. Over the past two decades, autonomous time series have proven to be an important component of the ocean observing system. Looking to the future, autonomous time series are capable of providing unique insights into ocean change that will be necessary for guiding complex decisions faced by society.
ACKNOWLEDGMENTS
We would like to acknowledge the dedication and expertise of the more than 100 partners who have contributed to the PMEL air-sea CO2 and ocean acidification times-series network over the last two decades, especially those who have fostered those partnerships through providing excellent support for the sensors, buoy equipment, and data: Stacy Maenner, Sylvia Musielewicz, Randy Bott, John (Oz) Osborne, Sean Dougherty, Roman Battisti, Alex Kozyr, Kevin O’Brien, Noah Lawrence-Slavas, Chris Meinig, Pat McLain, and Colin Detrich. We thank NOAA GOMO and OAP for providing the funding that supports the PMEL air-sea CO2 and ocean acidification time series, and in some cases for providing funding to PMEL partners to maintain the buoys. These time series would not exist without the work of our partners who secure additional funding and leveraged services, such as ship time, from dozens of other sources that keep the buoy platforms operational. These PIs who manage the projects and people who maintain current and past time-series buoys include: Andreas Andersson, Nick Bates, Valerie Brown, Wei-Jun Cai, Meghan Cronin, Jessica Cross, Eric DeCarlo, Jorge Corridor, Stephen Cucullu, Ian Enochs, Burke Hales, Rudi Hermes, Stephan Howden, Charity Lee, Derek Manzello, Shannon McArthur, Michael McPhaden, Melissa Meléndez, Natalie Monacci, Jan Newton, Scott Noakes, Jae Hoon Noh, Chris O’Brien, Mark Ohman, Sólveig Ólafsdóttir, Al Pluddemann, Joseph Salisbury, Uwe Send, Elizabeth Shadwick, Bronte Tilbrook, Thomas Trull, Doug Vandemark, Robert Weller, and Chip Young. This is PMEL contribution 5476.
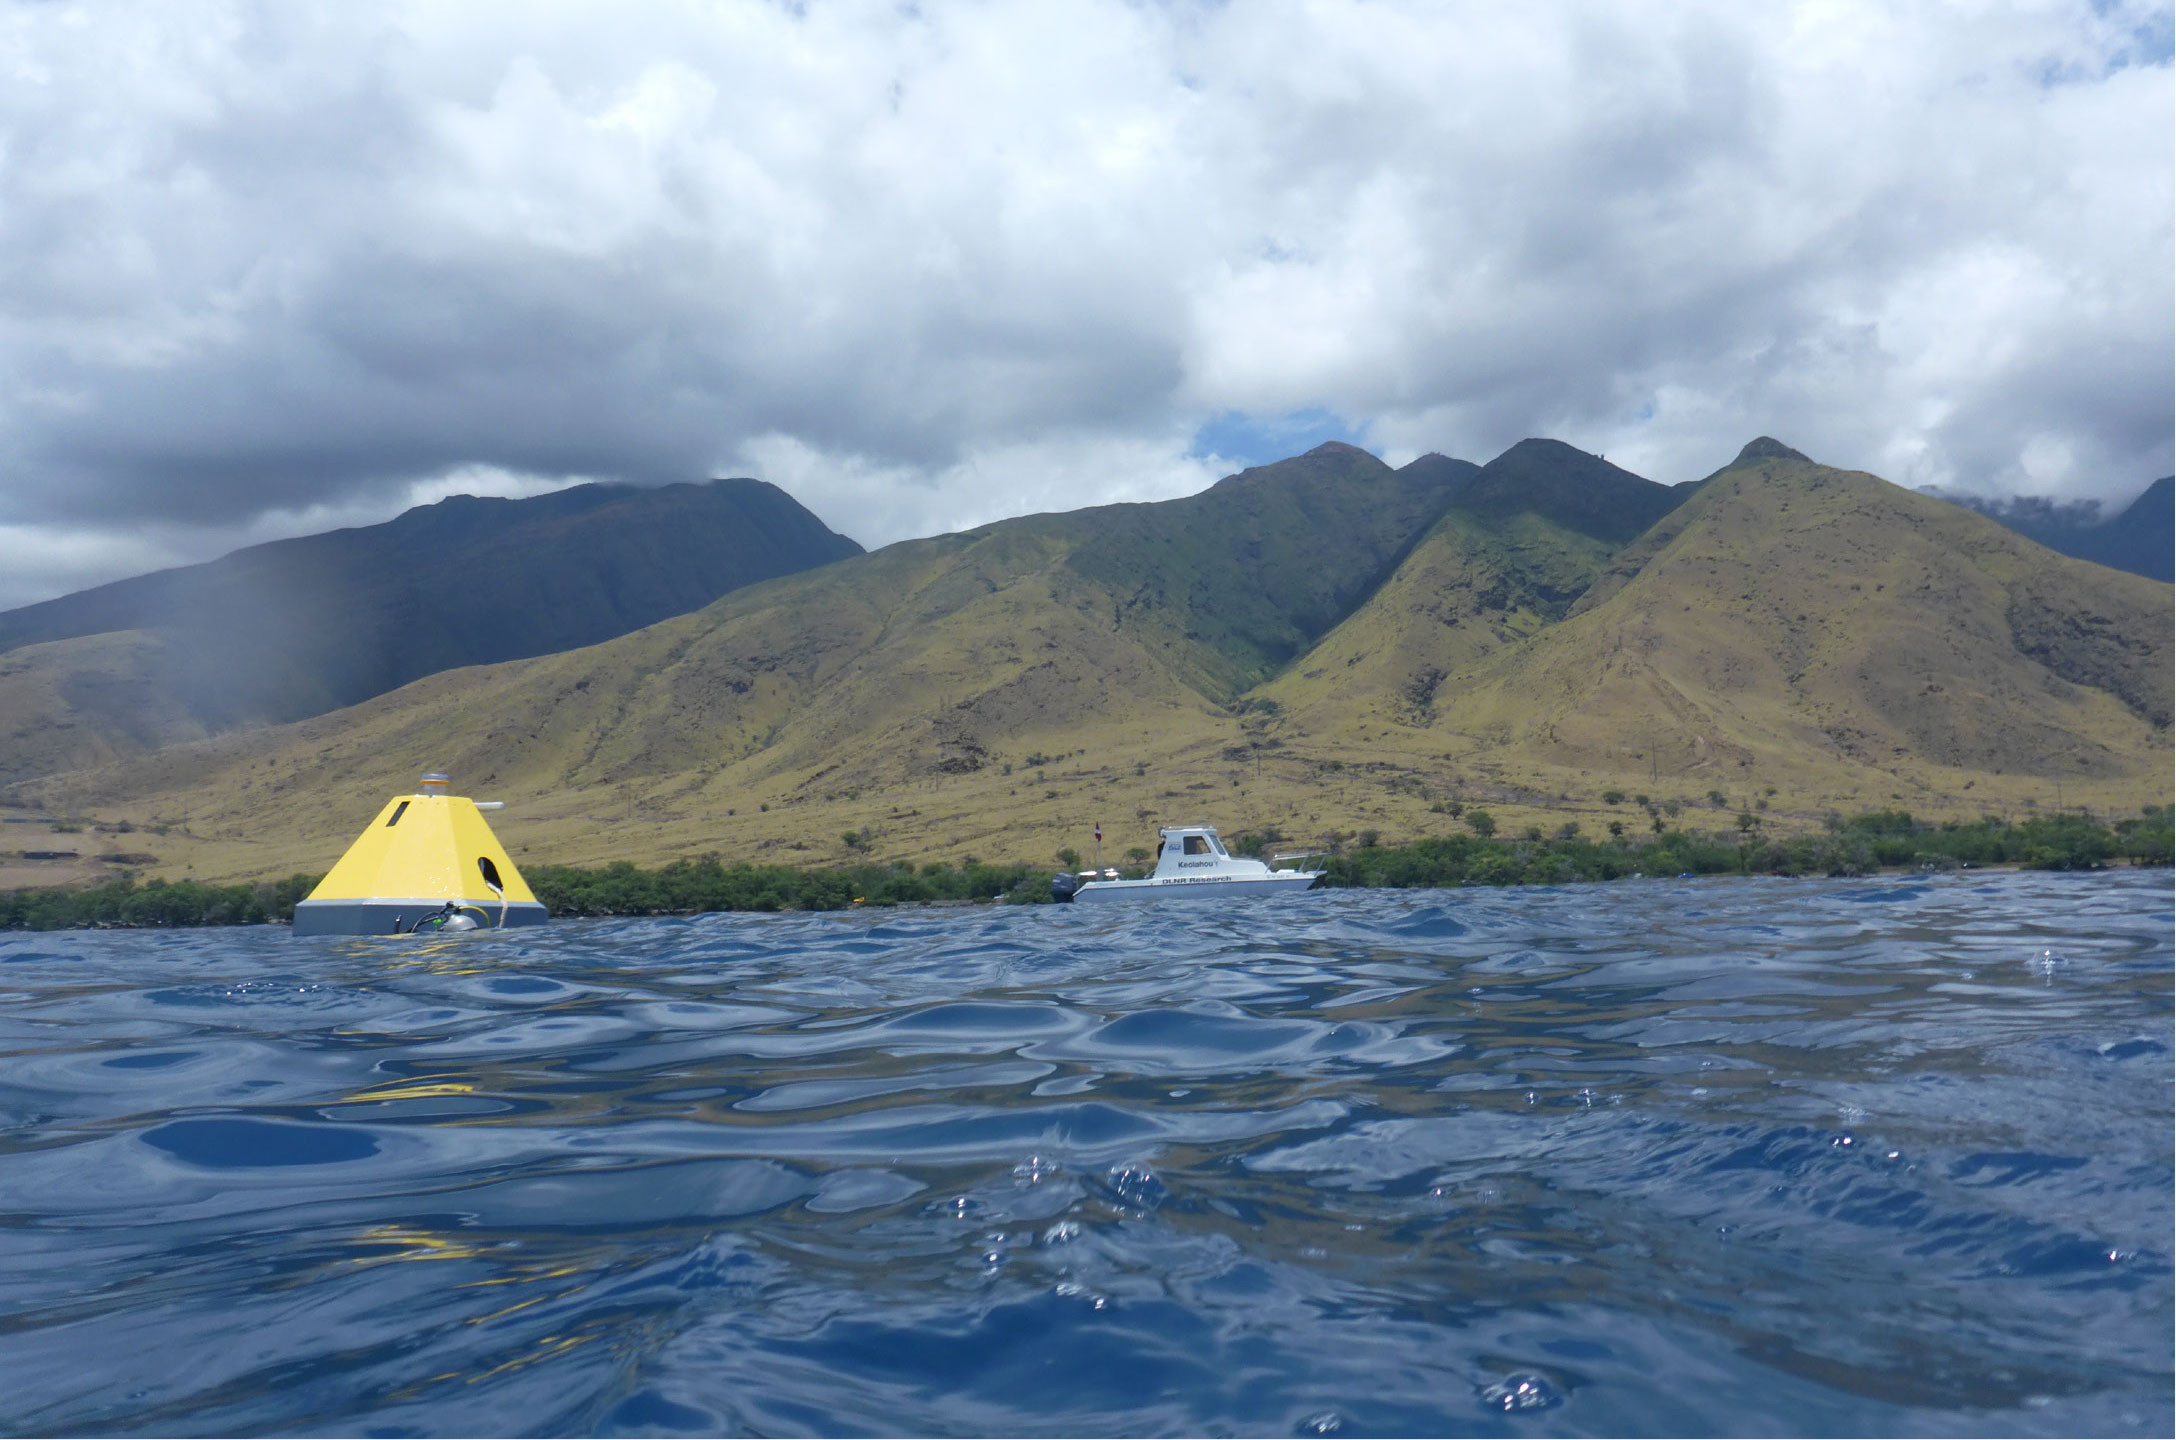
University of Hawai‘i ocean acidification buoy deployed off of Olowalu, Maui, in June 2023. Photo credit: Amy Markel. > High res figure
|

