Full Text
Introduction
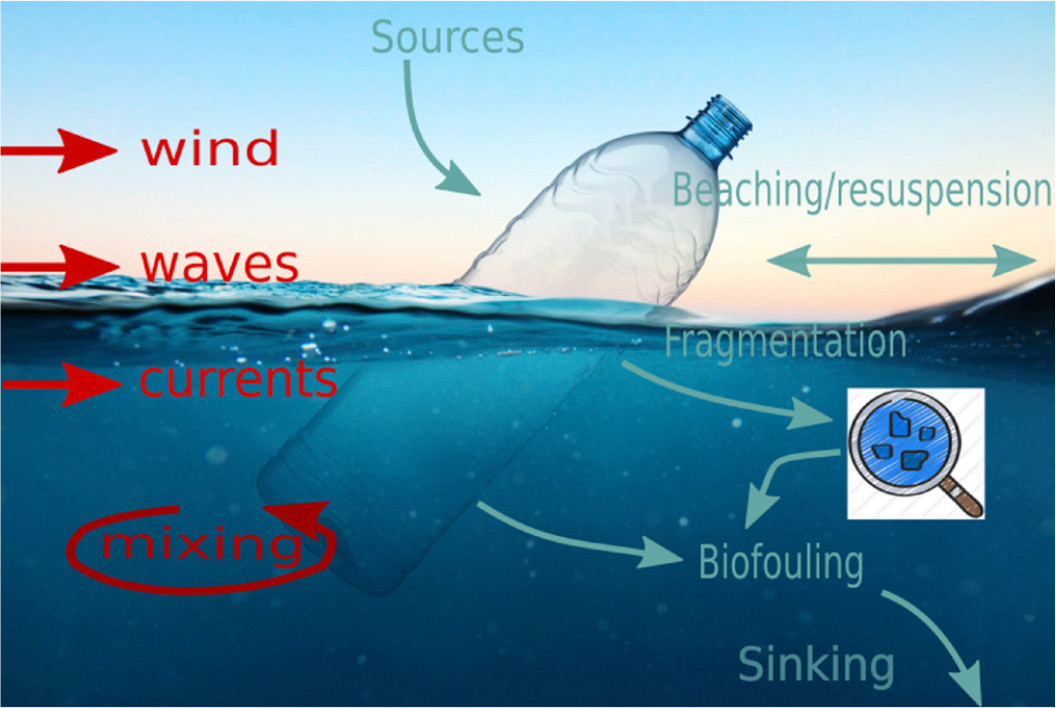
The accumulation of plastic debris in the ocean is now recognized as a major environmental problem, with consequences directly affecting not only marine ecosystems but also human well-being. Human activities create plastic litter, much of which is either directly discharged into the ocean or transported to the sea via inland pathways (e.g., rivers, lakes, wastewater treatment plants). Once in the ocean, plastics are further transported and transformed by processes such as ocean currents, winds and waves, water dispersion, fragmentation, biofouling, sinking, and beaching (Figure 1).
|
|
Assessing the particle size, concentration, and distribution of plastic pollution in the ocean is a prerequisite for managing and protecting marine ecosystems. The sizes of plastic litter in the sea vary widely, from nanometers to meters, posing great challenges for monitoring and modeling. Because it is costly and complex to monitor seaborne plastics, there are large spatial and temporal gaps in monitoring data that hamper modeling of their distribution and the processes acting upon them.
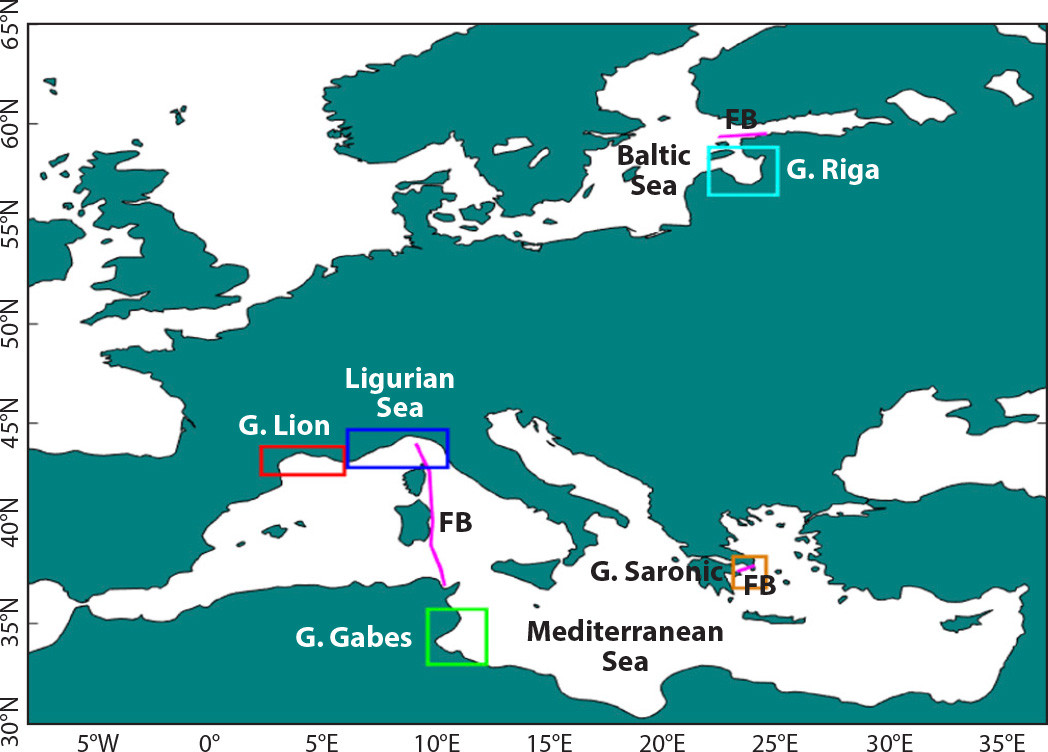
In this paper, we discuss recent progress in developing realistic marine plastic modeling capacity, including mapping plastic sources from land, cost-effective microplastic monitoring, and advanced micro- and macroplastic basin-scale models and their validation for the semi-enclosed Baltic and Mediterranean Seas (Figure 2). Most of the progress is attributed to the plastic modeling team in EU H2020 project CLAIM (Cleaning Litter by Developing and Applying Innovative Methods in European Seas).
|
|
Marine Plastic Source Mapping
The dominant sources of plastics emissions are land-based, such as those emitted from tire wear, painting, laundry (microplastics with particle size <5 mm), and mismanaged bags and bottles (macroplastics). Global plastic litter riverine inputs to the sea have been derived from a regression model based on river mouth plastic concentration measurements and an estimate of mismanaged plastics (Lebreton et al., 2017). This data set, however, has higher uncertainty in regional seas where few river mouth plastic measurements are available, for example, the Baltic Sea. The CLAIM team developed specific methods for mapping microplastic discharges from tire wear and household microplastics from laundry and personal care and cosmetic products. Microplastic emissions on land and discharges to the sea were estimated using socioeconomic statistics in European countries, including population density, the number of motor vehicles per country, the distribution and purification capacity of sewage systems and wastewater treatment plants, and geological data (catchment and river distribution and linkages).
Microplastic Observations in the Sea
Marine plastic models require reliable and consistent observations for calibration. Current plastic observations in the sea are measured with different methods that are usually not comparable due to the lack of common monitoring standards. The CLAIM team analyzed 27 microplastic observation data sets to quantify data uncertainties and check consistency among different Baltic Sea data sets (She et al., 2022). It was found that even replicated samples have uncertainties around 40%–56%. In addition, fewer existing data sets contain particle sizes <100 μm.
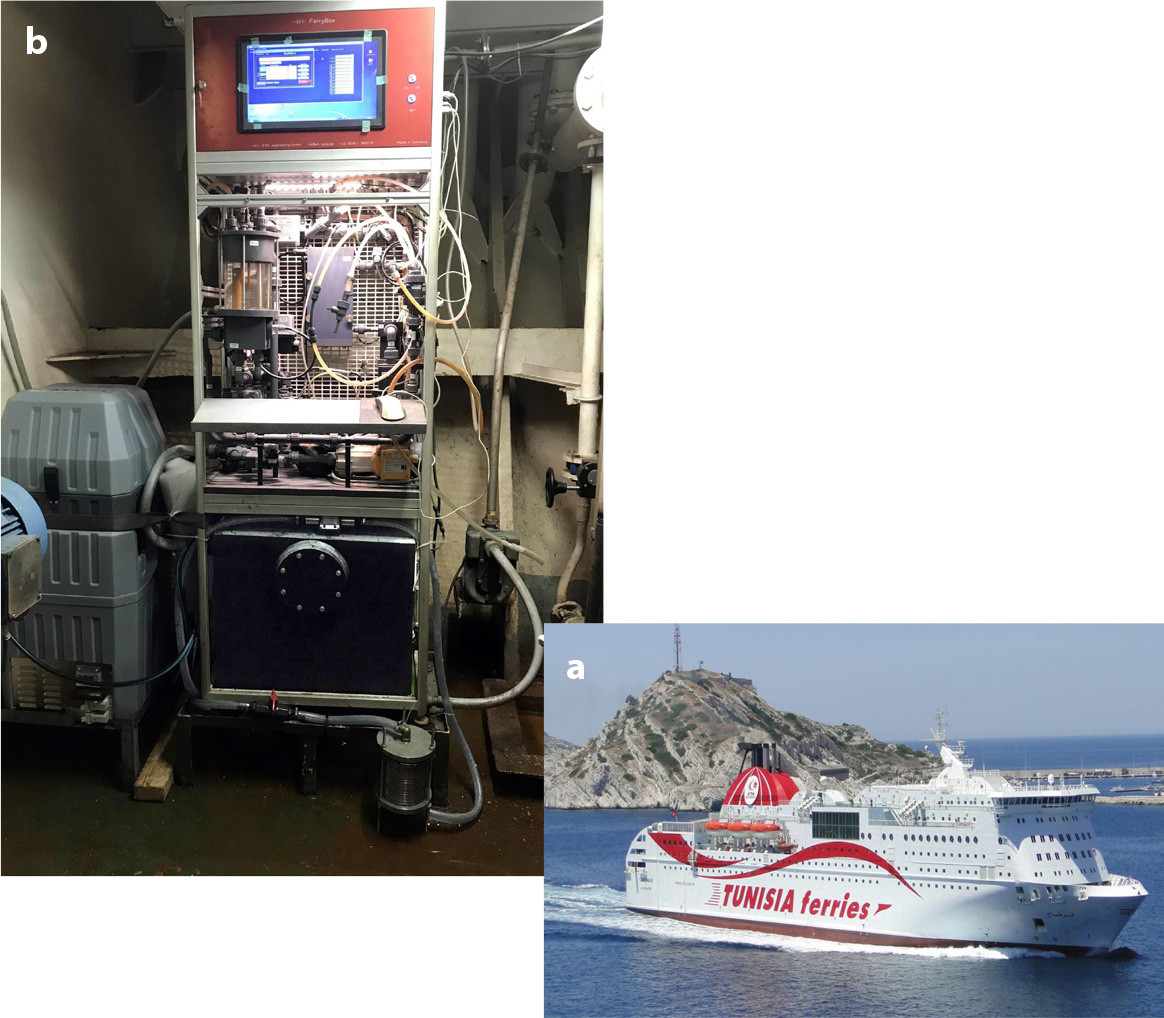
Recent developments show that the FerryBox system used for ocean physical and biogeochemical monitoring can provide cost-effective and autonomous microplastic measurements. In addition, FerryBox systems can provide measurements for multiple particle size ranges. To avoid contamination from plastic parts in the filtering system, the CLAIM team developed a stainless steel passive seawater flow-through filtering system for sampling plastic particles using FerryBox systems on ships of opportunity (Figure 3).
|
|
The instruments were deployed from the ferry C/F Carthage during a trip from Tunis to Genoa, the research vessel Salme in the Baltic Sea, and the sailing vessel Marie Galante in the Saronic Gulf. These test deployments resulted in collection of 65 samples and proved that the system can be configured to sample effectively both in open seas and coastal areas.
Marine Plastic Modeling and Assessment
After they reach the sea, plastics are dispersed by winds, ocean currents, and waves. Plastics heavier than seawater sink to the seabed, while lighter ones float. The movement of plastic litter in the sea can be simulated by using numerical models; however, successful modeling of the transport of microplastics in a three-dimensional ocean has only been recently reported (Mountford and Morales Maqueda, 2019).
A major challenge in microplastic modeling is simulating the removal of lighter particles from the water column in order to maintain the observed microplastic concentration in the ocean. A major mechanism for removing plastic from the surface ocean is biofouling. In this process, marine organisms grow on the plastic particles, making them heavier so that they gradually sink. Earlier modeling (Mountford and Morales Maqueda, 2019; Schernewski et al., 2020) did not resolve this process but rather led to excessive unrealistic estimates of microplastic concentrations in the water column. The CLAIM team explicitly parameterized biofouling-induced sinking in its models. Biofilm growth was calculated as a function of ecological and environmental parameters, derived from biogeochemical models. For the Baltic Sea, chlorophyll a concentration was used to calculate biofilm growth (Murawski et al., 2022), while for the Mediterranean Sea, algae concentration was used (Tsiaras et al., 2021).
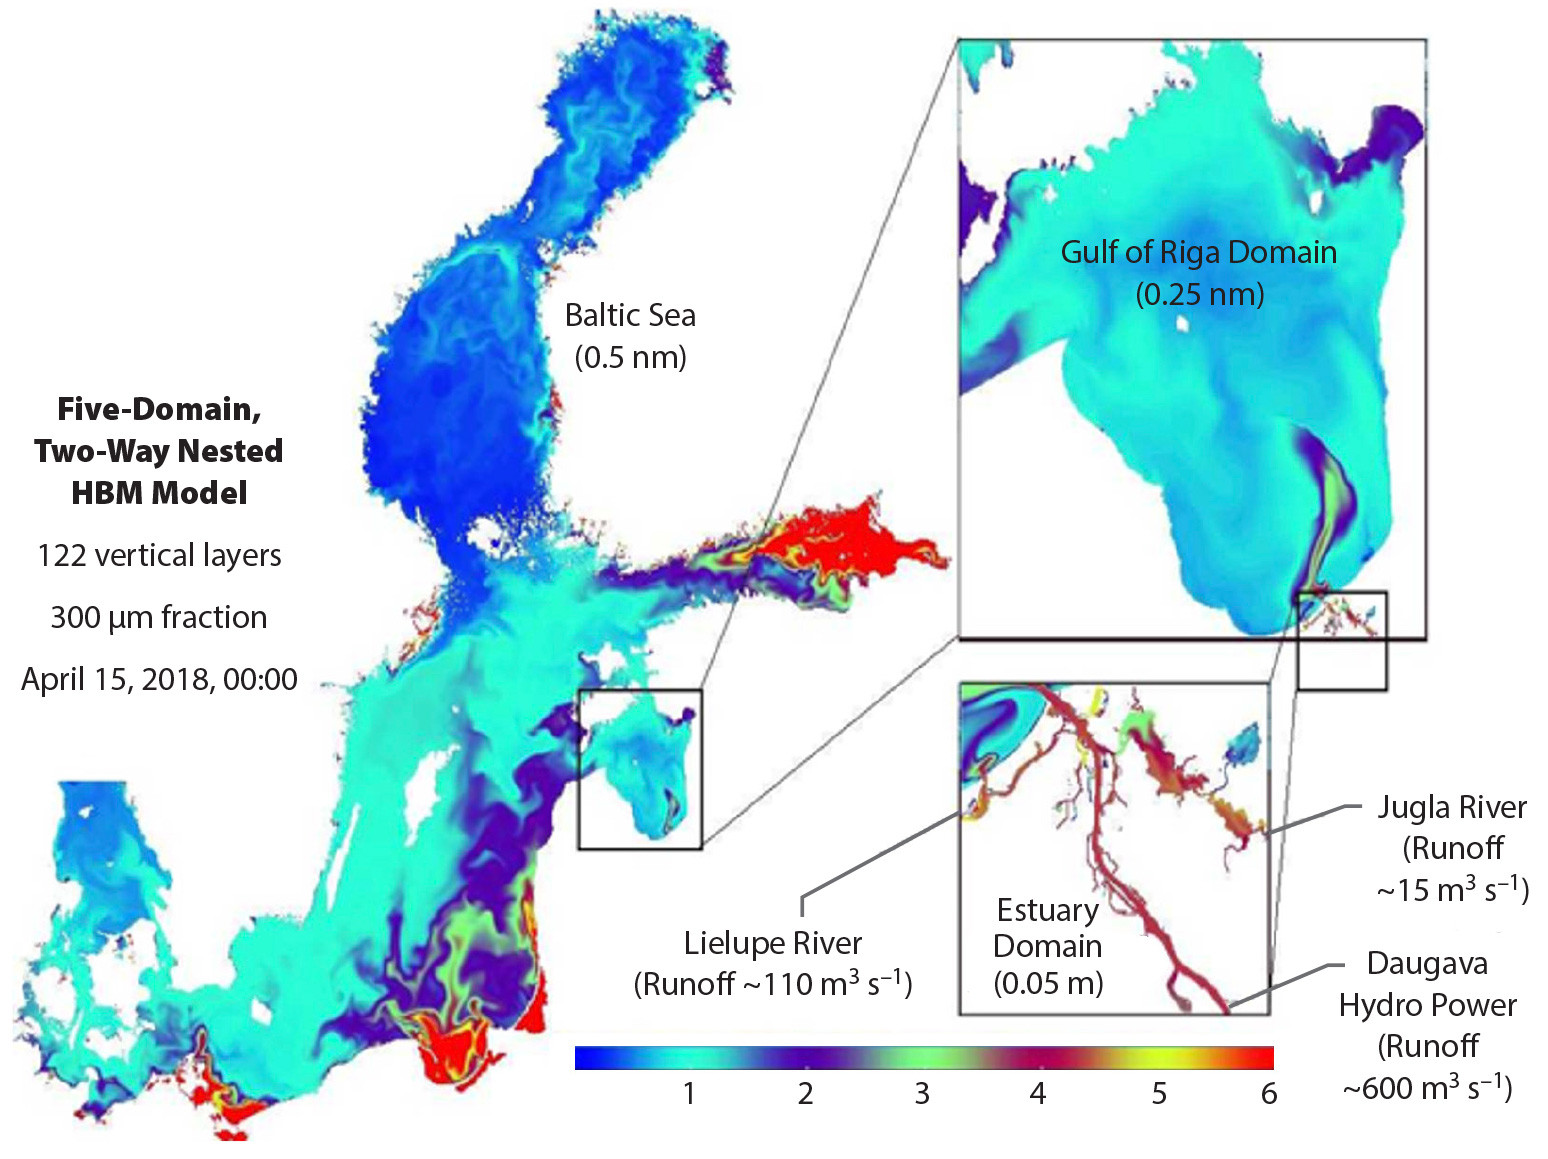
Another modeling challenge is to resolve plastic transport in the riverine-estuarine-coastal sea continuum. Inland rivers, lakes, and coastal lagoons play a significant role in the accumulation of plastic litter, and they act as a buffer zone in the pathway of plastic litter to the sea. High-resolution models are needed to resolve the dynamics in the estuarine-coastal continuum. In the Baltic, key areas were modeled with resolutions up to 90 m (Figure 4) to simulate the transition of microplastics from inland waters to the open sea, while also accounting for retention in rivers/lakes (Frishfelds et al., 2022). In the Mediterranean, high-resolution (~800 m) models were implemented in four coastal areas (Figure 1; Tsiaras et al., 2022). The fine-resolution models produced better results than the basin-scale models (Figure 5).
|
|
|
|
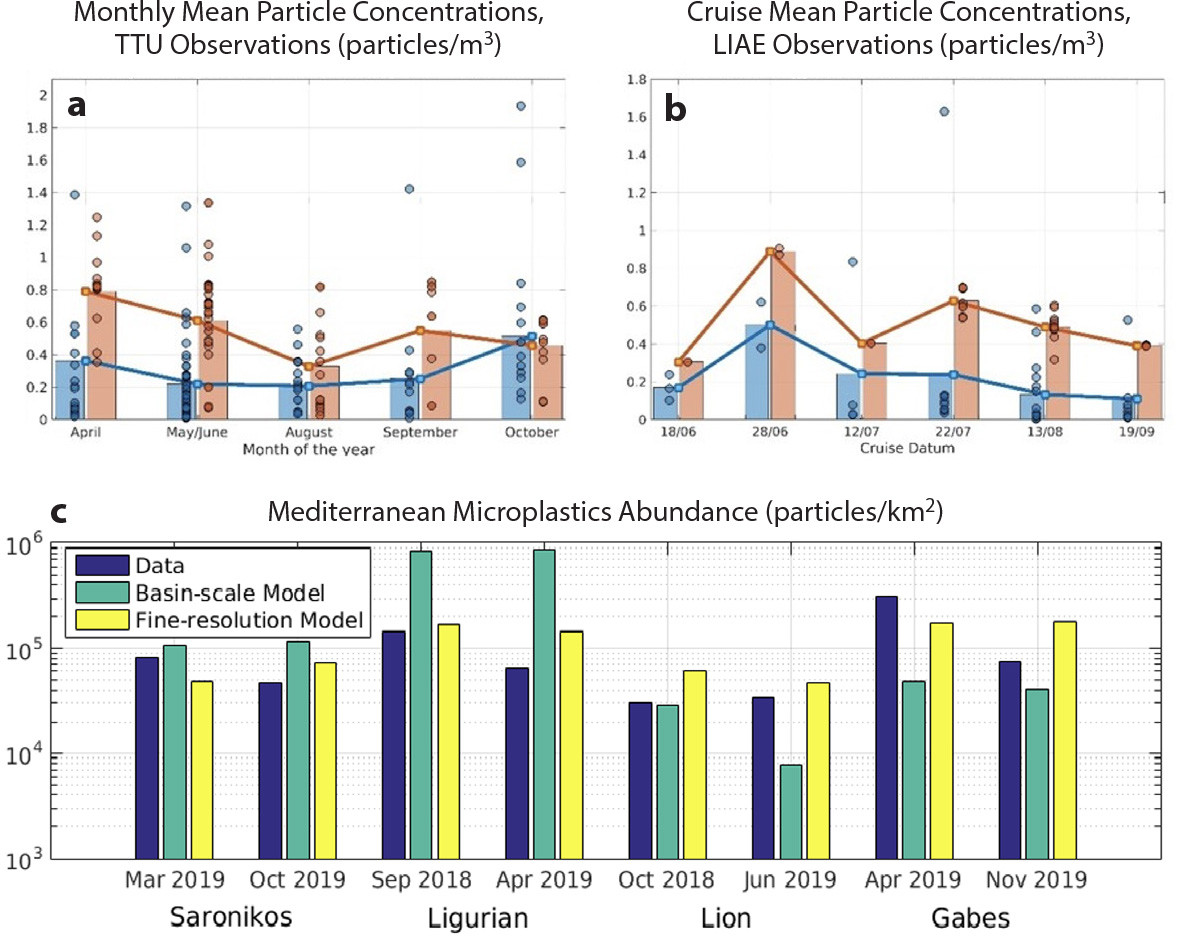
The models developed by the CLAIM team have been applied to simulate microplastics of varying sizes in the Baltic (5, 42, and 300 µm) and in the Mediterranean (50, 200, 350, 500, 1,000, and 2,000 µm). Multiple categories of objects (e.g., bottles, bags, foam) were also included in macroplastic transport models, where wind drag is a significant transport mechanism. When calibrated and validated against available observations, all the models exhibited reasonable skill in reconstructing major climatological spatial patterns for both micro- and macroplastics in the Baltic and Mediterranean Seas, although simulated concentrations in some subregions were still under- or overestimated. Correlations between model data and observations were statistically significant. Figure 5 provides one example.
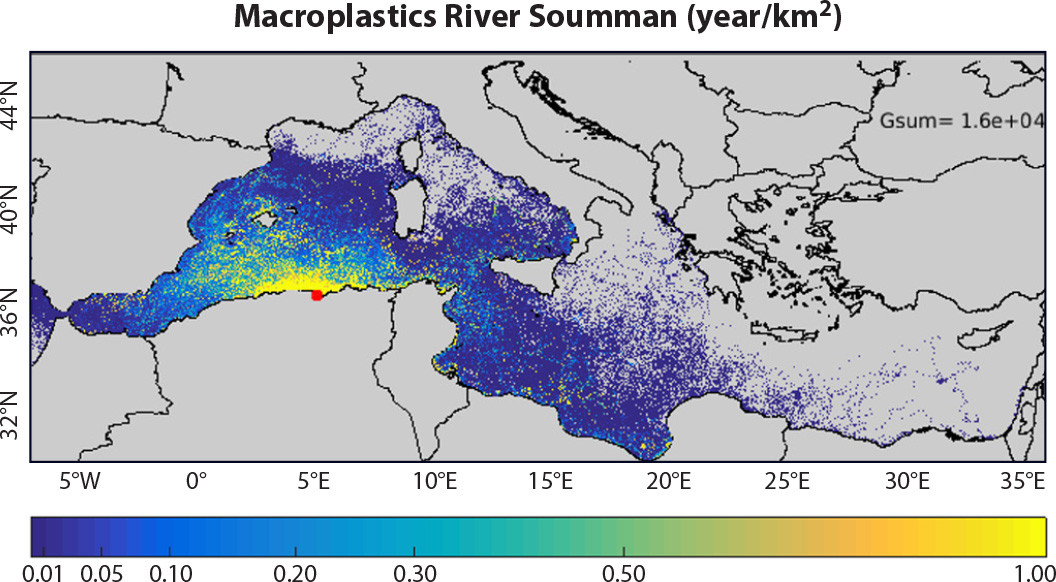
Model outputs can be used to identify ecologically or commercially important areas that are potentially threatened by plastic pollution (e.g., Hatzonikolakis et al., 2022), and modeling tools can be used, by means of scenario simulations, to evaluate the impacts of cleanup activities and management plans for mitigating plastic pollution. An important observation is that pollution plumes from many sources contribute to the streams of plastics that are transported by oceanographic processes. Therefore, mapping of plumes of different plastic fractions is a central task when planning cleanup efforts (Christensen et al., 2021). We concluded from our investigations that pollution plumes are highly variable and directional and cannot be described by a simple distance relationship. Figure 6 shows simulated macroplastic pollution plumes in the Mediterranean.
|
|
Recommendations for Future Research
Successful development of realistic marine plastic modeling capacity requires accurate plastic source mapping; sufficient, reliable, and consistent observations; and improved parameterizations.
For monitoring microplastics, common technical standards are needed for sampling and analysis methods to make the data intercomparable, with standards established for mesh size, sampling error, false-zero samples, lack of representativity, and clogging. Cost-effective monitoring capabilities for a wide range of particle sizes and macroplastics are needed. The FerryBox monitoring instrument has been effectively operated for the CLAIM project on several cruises in the Baltic and Mediterranean Seas, as well as during a six-month monitoring period on board a Kiel-Oslo Ferry (van Bavel et al., 2020). It is one of the proven technical solutions and is therefore recommended for wider applications. Better field sampling analysis technology is needed to improve cost effectiveness and timeliness. Large observational gaps exist, especially at the mouths of rivers. Observations related to vertical dynamics, for example, biofouling and resulting sinking and macroplastic fragmentation, are essential for improving the models, but are currently scarce.
For source mapping, we recommend considering individual wastewater treatment plants’ cleanup capacity. The size spectrum of microplastic particles needs updating, and improved river retention estimates are needed. Extreme events such as flooding have large impacts on transport of land litter to the sea, but are currently not included in source mapping.
To improve microplastic modeling, major knowledge gaps need to be filled, such as quantifying the processes related to biofouling, resuspension of plastics in the seabed, and macroplastic fragmentation into small particles. For macroplastic modeling, principal uncertainties are the varying wind drag coefficients for different plastic objects, the seasonal dynamics of sinking/breakdown, and beaching/resuspension processes, including fragmentation. Dedicated field experiments may provide new knowledge needed for improving the models. For future model validation and calibration, more coordinated and sustained observation programs are required as well as experiments targeting key processes listed above. Although submesoscale eddies may play an important role in transport of plastics (e.g., Mishra et al., 2022), they are not well resolved in current models.