Introduction
Over the past several decades, ship-based Doppler radars have been used to probe tropical precipitation systems. The first shipborne radars were deployed in 1974 during GATE (GARP Atlantic Tropical Experiment; GARP was the Global Atmospheric Research Program). For GATE, four ships were outfitted with 5 cm wavelength (C-band) reflectivity-only radars, implying the radars only measured the intensity of precipitation as opposed to Doppler velocity measurements. A wealth of new findings regarding the structure and organization of tropical convection emerged from GATE (e.g., Houze, 1977), even though antenna scanning was not stabilized for ship motions (a technique in which the radar antenna position is dynamically corrected in real time for rapid changes in the roll and pitch of the ship).
The first deployment of ship-based, stabilized Doppler radars took place 15 years later in TOGA COARE (Tropical Ocean-Coupled Ocean Atmosphere Research Experiment). TOGA COARE utilized two Doppler radars, the MIT C-band and the so-called TOGA C-band radar (now the NASA-TOGA radar) to provide new information about rainfall and convection over the Western Pacific Warm Pool (Demott and Rutledge, 1998; Rickenbach and Rutledge, 1998). Following TOGA COARE, many field projects benefited from the use of ship-based Doppler radars. During the late 1990s through about 2010, the C-band Doppler radar on NOAA Ship Ronald H. Brown was a workhorse for ship-based Doppler deployments. However, in 2013, NOAA decided to remove the C-band radar from Ronald H. Brown and donate it to Colorado State University (CSU) with the understanding it would be “resurrected” and utilized again aboard ships for research and education purposes. Subsequently, CSU obtained funding from the National Science Foundation to build SEA-POL, specifically to enable quick and economical deployment on ships within the UNOLS global class fleet such as Roger Revelle and Thomas G. Thompson, as well as Ronald H. Brown.
This study reports on the design, construction, and capabilities of SEA-POL, and its first deployment in the Salinity Processes in the Upper-ocean Regional Study (SPURS-2) carried out in late fall 2017 on board Roger Revelle. SPURS-2 targeted convective systems and rainfall in the Eastern Pacific Intertropical Convergence Zone (ITCZ). We first describe the development of SEA-POL and installation and operation aboard R/V Roger Revelle. Highlights include acquisition of polarimetric-based rain maps to identify freshwater “puddles” on the ocean’s surface that were of particular interest to the SPURS-2 oceanographers.
Description of the SEA-POL Radar
The design and construction of SEA-POL was centered on building a radar that would be both mechanically and electrically rugged to accommodate deployment on ships operating in difficult marine environments. The system includes two components from the original Ronald H. Brown radar, the C-band magnetron transmitter and the antenna positioner (or pedestal), which was completely rebuilt down to the last nut and bolt. All other components were either supplied by commercial vendors or designed and built in-house at CSU. The 5.65 GHz (C-band) operating frequency is optimal for ship-based operations because its physical size, including the antenna, radome, and pedestal assembly, is small enough to permit rapid deployment and installation on the host ship while still providing high resolution for sampling convective precipitation. Components of the radar that are exposed to the environment were designed to withstand sea spray and high humidity conditions. The radar is designed to accept prime power sources available both on land (208V) and at sea (480V).
Figure 1 shows a schematic illustration of SEA-POL. The radar shelter uses a standard-sized seatainer to house the radar transmitter, signal processor, data recording system, and computers and displays for monitoring SEA-POL in real time. In SPURS-2, we established remote monitors and computers in the main computer lab of Roger Revelle to provide more user space for science staff running the radar in real time. Working in the computer lab also allowed staff to avoid walking to and from the radar during rough seas and/or foul weather. The remote displays also included a camera so that radar engineers and scientists could monitor the antenna’s real-time movements. The radar shelter is cooled using a marine-rated air conditioning system.
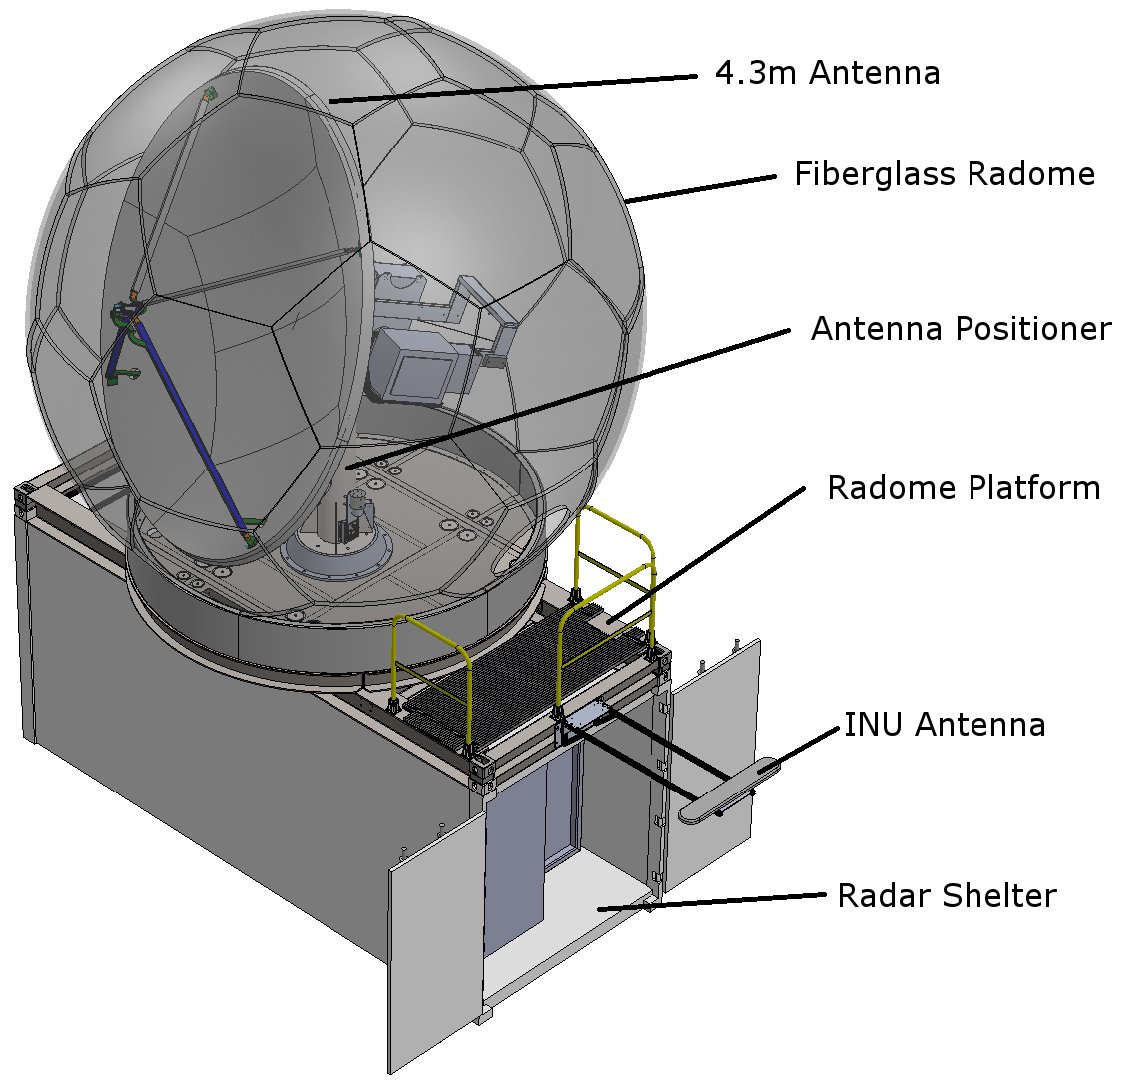
Figure 1. Computer-generated schematic of the main components of the SEA-POL radar. A fiberglass radome houses the radar antenna and pedestal as well as various electrical components. The entire assembly is affixed to the radar shelter seatainer by a custom design rigid interface (the radar platform). The radar shelter houses the radar transmitter, data displays, and the data recording system. A large marine quality air conditioning unit cools the radar shelter. > High res figure
|
The radar shelter is a modified shipping container, which permits ease of handling by routinely available dockside equipment. The radar platform was designed such that the antenna, radome, and pedestal could be rigidly and solidly attached to the top of the radar shelter. The entire radar is shipped in three standard sized seatainers, one providing the radar shelter and two custom-built seatainers that house the fully disassembled radome, antenna and pedestal, spare parts, test equipment, tools, and safety gear. The radar platform is designed as a platform container, so this part also ships like a seatainer on a truck or aboard a ship. Dockside assembly and disassembly of the radar require three to four days each, and a crane is needed for assembly. For the SPURS-2 deployment, commercial trucking used flat beds to deliver the radar to the pier next to Roger Revelle where it was then assembled and lifted onto the ship in two crane lifts, first the radar shelter and then the fully assembled radome, antenna, pedestal, and platform. Within two hours of being placed on the ship, the radar is ready for operation.
SEA-POL’s 4.3 m diameter reflector antenna features an advanced, dual polarization (H and V) feed horn that generates a narrow beam of outgoing radiation to provide high-resolution imagery of the precipitation that SEA-POL observes. The antenna “dish” reflector can be disassembled into five pieces to fit within the 2.5 m maximum allowed width inside one of the seatainers. The two-axis antenna positioner (pedestal) allows positioning of the antenna in azimuth and elevation. Elevation travel is from −8° to +85°, with continuous rotation in azimuth. Servo amplifiers accept commands from the radar controller to move the antenna at speeds up to 30° s–1 so that large volumes of the atmosphere can be scanned quickly. The drives are tuned for high accelerations and quick response times, permitting the dynamic repositioning required for antenna stabilization at sea. An inertial navigation unit (INU; mounted on the antenna positioner) senses the pitch and roll of the radar platform at a frequency of 100 Hz. Ship heading is also recorded. This information is used to offset the scanning plane of the radar (due to ship’s roll and pitch) by adjusting the elevation axis on a continuous basis to maintain a “fixed” elevation angle as the antenna sweeps across a storm. When the antenna is moving up or down in the vertical to “cut through” a convective storm, the azimuth pointing angle of the antenna is also corrected for ship motion. The antenna and positioner are enclosed within a fiberglass radome, which has a truncated icosahedron geometry comprising pentagonal and hexagonal panels that are bolted together. This permits the large diameter radome (5.5 m at the equatorial point) to be broken down for transport into pieces small enough to fit inside a seatainer. The outside of the radome is covered with hydrophobic paint to reduce formation of water films that can lead to attenuation and distortion of dual-polarization parameters. The interior of the radome includes a dehydrator to keep moisture off important components, essential for operations in the tropics. The integrated radar shelter, radar platform, positioner, antenna, radome, INU, and dual-GPS receivers form a mechanically solid unit that is affixed to the deck of the research ship, mating to preexisting seatainer anchor positions. The entire assembly is rated to sustain winds in excess of 100 kts, much stronger than winds expected to be intentionally encountered in tropics. However, because SEA-POL is also designed to operate on land, such high wind speeds are possible.
Figure 2 shows the installation for the SPURS-2 cruise on Roger Revelle. The radar was installed on the forward 02 deck of the ship. This configuration differs significantly from previous radar installations, where the radar shelter was mounted on the deck with the antenna, pedestal, and positioner placed atop the ship’s bridge. There are several reasons for this difference. First, when the National Science Foundation was considering funding the SEA-POL development, we were asked to design an installation that would be economical and adaptable to various ships within the UNOLS fleet. This precluded mounting the antenna atop the bridge, as each ship would have to be fitted with a special platform to accept the radar antenna at a cost of approximately $200,000. In addition, sensitive electronics are located on the antenna positioner within the radome, and it is important that radar engineers be able to access these components at sea, access not generally available atop the ship’s bridge when the ship is underway. The installation on the forward 02 deck provides quick access to these components through a custom designed radome hatch. Furthermore, if the antenna were mounted atop the bridge, the waveguide run would be unnecessarily long, meaning increased two-way loss that would reduce radar sensitivity (a channeled metallic “waveguide” carries radio-frequency power from the transmitter to the antenna as well as power received at the antenna back to the receiver, which is many orders of magnitude less than the transmit power).
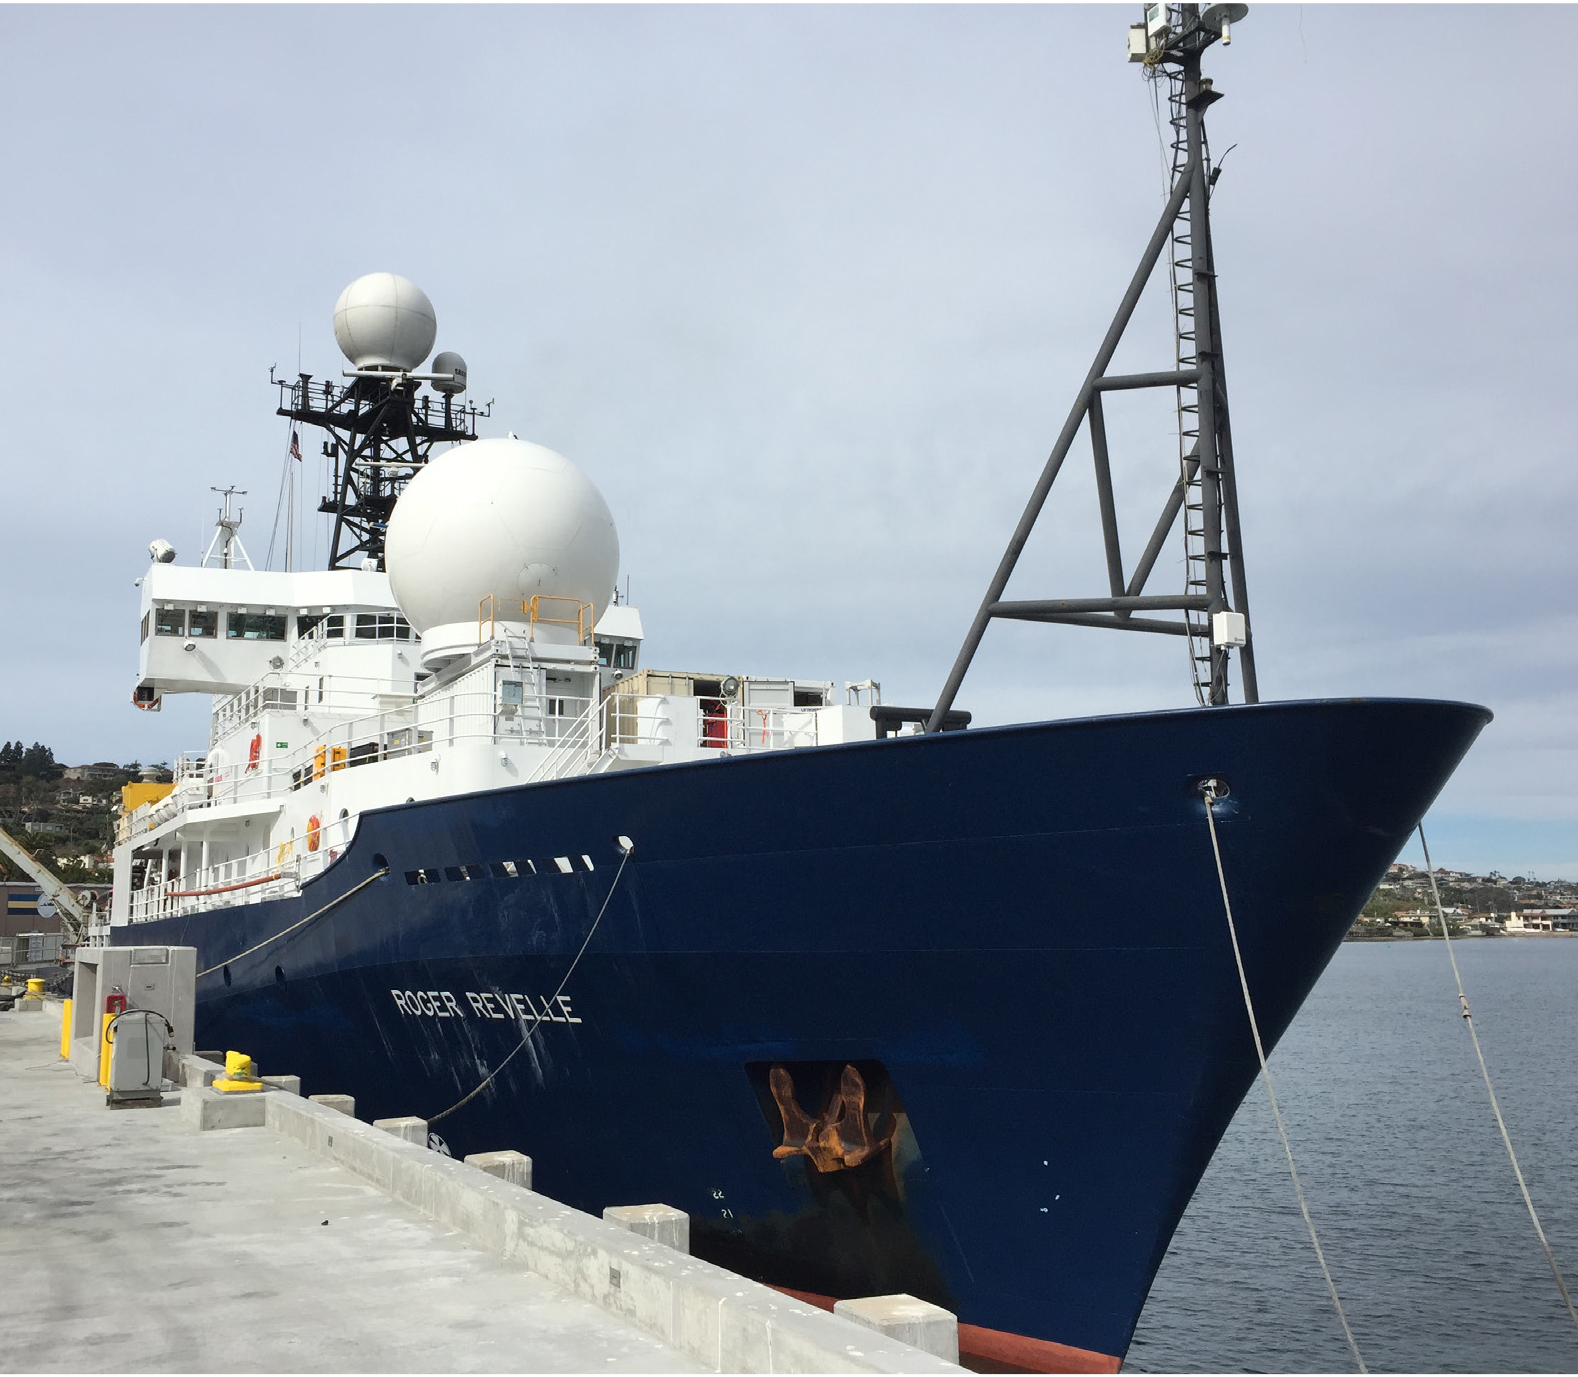
Figure 2. The SEA-POL radar installed on the forward 02 deck of R/V Roger Revelle ready for the SPURS-2 deployment, showing the radome and radar seatainer. Though the radome blocked the view from the ship’s bridge to some extent, it was not considered a hindrance to navigational safety. > High res figure
|
The main drawback of this new installation is that the radar transmitter cannot operate over a full 360° azimuthal swath, as the transmitter must be disabled over a 120° sector centered aft to avoid illuminating the ship’s bridge with RF energy. Hence, the realizable sector is 240°, centered on the ship’s bow. This one-third reduction in the area covered by SEA-POL is not considered to be a hindrance to collecting statistically robust data while underway, and the ship can always be turned to “face” interesting weather using its bow thrusters, provided this maneuver does not interfere with measurements being done by other scientists over the side. In addition to the measurements of reflectivity, Doppler velocity and spectral width (which provides a measurement of in-cloud turbulence due to small-scale Doppler velocity variations), SEA-POL collects measurements of differential reflectivity (Zdr), co-polar correlation coefficient at zero lag (ρhv), and differential phase (ϕdp). Differential reflectivity provides basic information on particle shape and phase, and it can be broadly understood as a ratio of the power returned at horizontal polarization to vertical polarization. Differential phase is sensitive to non-spherical particles. Therefore, in mixed phase precipitation, differential phase (and its derivative with range, specific differential phase, Kdp) is sensitive only to oblate-shaped rain and not to quasi-spherical hail and graupel (soft hail). In oblate (flattened) raindrops, the H-wave phase lags that of the V-wave. This difference in phase is measured as a phase shift between the H and V waves, resulting in the differential phase measurement. In ice regions, positive Kdp can distinguish pristine, oriented ice from aggregates (Kennedy and Rutledge, 2011). The co-polar correlation coefficient is sensitive to mixed phase processes, and is an excellent variable for identifying melting regions (bright bands). For a complete description of polarimetric radar variables, see Bringi and Chandrasekar (2001). Another significant advantage of a dual-polarized radar is that the polarimetric fields can be used for calibration purposes (of reflectivity Z, based on Kdp; Ryzhkov et al., 2005) and attenuation correction (based on ϕdp; Bringi and Chandrasekar, 2001). Data quality is further improved by eliminating second trip and non-meteorological echo such as sea clutter. These are many of the reasons for developing a polarimetric-capable radar for deployment on ships.
Some discussion regarding the impact of ship motions on the SEA-POL polarimetric measurements is warranted, namely Zdr and ϕdp (and its derived quantity Kdp). It is well known that ground-based radar polarimetric measurements are impacted when precipitation particles are viewed at increasing elevation angle. The same principle applies to a ship, further compounded by the rolling and pitching of the ship, so we undertook a theoretical study to investigate the impact of ship motions on the polarimetric variables. Two examples serve to illustrate the impact of ship motion on rotating the horizontal and vertical transmit polarization bases: first, envision the radar scanning perpendicular to the long axis of the ship and the ship pitching up or down, and second, envision the ship rolling to port or starboard and viewing precipitation directly ahead of the ship. Apart from these simple geometrical examples, any combination of viewing angle, roll angle, and pitch angle may be realized.
To anticipate the magnitude of roll and pitch angles for rough seas and therefore potential impact on SEA-POL’s polarization measurements, we examined roll and pitch data from the GasEx cruise of Ronald H. Brown, conducted in the Southern Ocean during austral winter in 2008. Under 40 kt winds, the extreme values of pitch and roll were 16.5° and 24°, respectively. However, the frequency distributions of roll and pitch indicated that these extreme values were encountered less than 5% of the time (for a 24-hour period during a highly disturbed period). So, in nearly all seas states encountered by SEA-POL, our calculations indicate that the errors in Zdr and Kdp are so small that SEA-POL can collect polarimetric data of high quality at sea. Indeed, the magnitudes of the polarimetric variables collected during the SPURS-2 cruise were entirely reasonable over a range of sea states.
“The critical contribution to the SPURS-2 cruise by SEA-POL was to map rainfall, with special interest paid to the establishment of ‘freshwater lenses’ that form when compact rain cells dispense their precipitation to the ocean’s surface.”
Mapping Rainfall with SEA-POL
The critical contribution to the SPURS-2 cruise by SEA-POL was to map rainfall, with special interest paid to the establishment of “freshwater lenses” that form when compact rain cells dispense their precipitation to the ocean’s surface. The distribution of rainfall around the ship, intensity (rain rate), and rain accumulations were of fundamental interest to the SPURS-2 oceanographic component. Oceanographers then used other instruments to measure the reduction in salinity, with special attention to documenting the timeframe over which the salinity gradient mixed out, as a function of wind speed and other factors (Drushka et al., 2019, in this issue). Custom radar scans were designed to produce rain maps extending 125 km from the ship with a temporal resolution of five minutes.
To collect the rain mapping data, the 240° sector was scanned at several different elevation angles. These data, in their native polar coordinates, were first quality controlled using SEA-POL differential phase and correlation coefficient measurements to remove spurious data associated with low signal-to-noise returns. The fields of reflectivity, Z, and differential reflectivity, Zdr, were then corrected for attenuation. Both scattering and absorption (primarily by rain compared to ice) contribute to attenuation. Once the data were quality controlled and attenuation corrected, the resultant fields were interpolated to a Cartesian grid for further processing.
Gridded rain rates were determined by using radar reflectivity (Z) as well as two of SEA-POL’s polarimetric variables, differential reflectivity and differential phase. Differential reflectivity is defined as a log ratio of the return power at horizontal polarization to vertical polarization. Because raindrops deform into oblate spheroids, Zdr in moderate to heavy rain is typically 1–4 dB (Zdr = 10 log10 (PHH/PVV) where PHH is the received power at H polarization and PVV is the received power at V polarization, typically measured along a beam of radar data at 150 m intervals). Ice particles, like graupel, by virtue of being more spherical (or isotropic scatterers), have Zdr values near zero. An important parameter for rain mapping, specific differential phase (Kdp), is derived from the measured field, differential phase. Kdp is derived by first filtering the differential phase field since it is an inherently noisy measurement. After filtering, Kdp is derived by multiplying the range derivative of the smoothed differential phase field by a factor of one-half. This factor accounts for the fact that the phase shift occurs when the waves propagate out and back from precipitation targets. Phase shifts only occur in media that have oblate targets, like raindrops. In ice, the phase shift is zero or very small because the physical structures of spherical particles or even of oblate ice particles have a low dielectric response to microwave energy (the same physical process applies to Zdr). Typical values of Kdp at C-band in moderate to heavy rain are 2°–4° km–1. Kdp is a function of both particle oblateness and total water content. Note that a large value of Kdp can be due mainly to oblateness, or for the case of near spherical drops, to liquid water content (mass of water per unit volume). The latter is frequently observed in the tropics, where convective cells often contain a large concentration of small drops with large liquid water contents, leading to heavy rainfall.
The sophisticated algorithm used to estimate rain rates as a function of range and azimuth around SEA-POL, shown in Figure 3, was developed over the course of several years of research at CSU (Thompson et al., 2018). This algorithm is “tuned” for tropical precipitation, as the basis for the algorithm consisted of applying sophisticated scattering software to tropical drop size distribution (DSD). The algorithm is applied to each Cartesian grid point. The decision tree begins by examining the value of Kdp measured by SEA-POL. The value of 0.3° km–1 is considered to be the smallest value that can be accurately measured by SEA-POL. If Kdp <0.3° km–1, the rain estimate defaults to either a power law estimate relating reflectivity to rain rate (light rain; so-called Z-R estimator) or an R-Z-Zdr (moderate rain) estimator. Note that in this algorithm, differential reflectivity is used in linear form (ζdr; ζdr = 10(Zdr/10)) to provide more precision in the estimator. Given the range of intensities in tropical rainfall, the latter estimator is used most frequently. When the Z-R estimator is used, two forms of this equation are introduced to discriminate between convective (heavy) and stratiform (light) rainfall that often have distinctly different DSDs. For heavier convective rainfall where sufficient differential reflectivity and differential phase occur, the R-Kdp-ζdr is utilized. This particular estimator requires a bit more explanation. Consider the case when Kdp is large and Zdr is slightly positive. In this situation, because R is inversely proportional to Zdr in this estimator, R is increased due to high liquid water contents reflected in the measurement of Kdp. On the other hand, for the same Kdp but large Zdr, R is decreased, as there is a larger contribution to Kdp from particle oblateness and less from liquid water content. It is interesting to note that the R-Kdp-ζdr was triggered at only 5% of the SEA-POL grid points for the entire SPURS-2 cruise, yet those rain amounts contributed nearly 50% of the total rain volume observed. The polarimetric estimators from SEA-POL provide robust rain estimates, afforded by taking the dual-polarization capability to sea. Details of the workings of this rainfall algorithm can be found in Thompson et al. (2018).
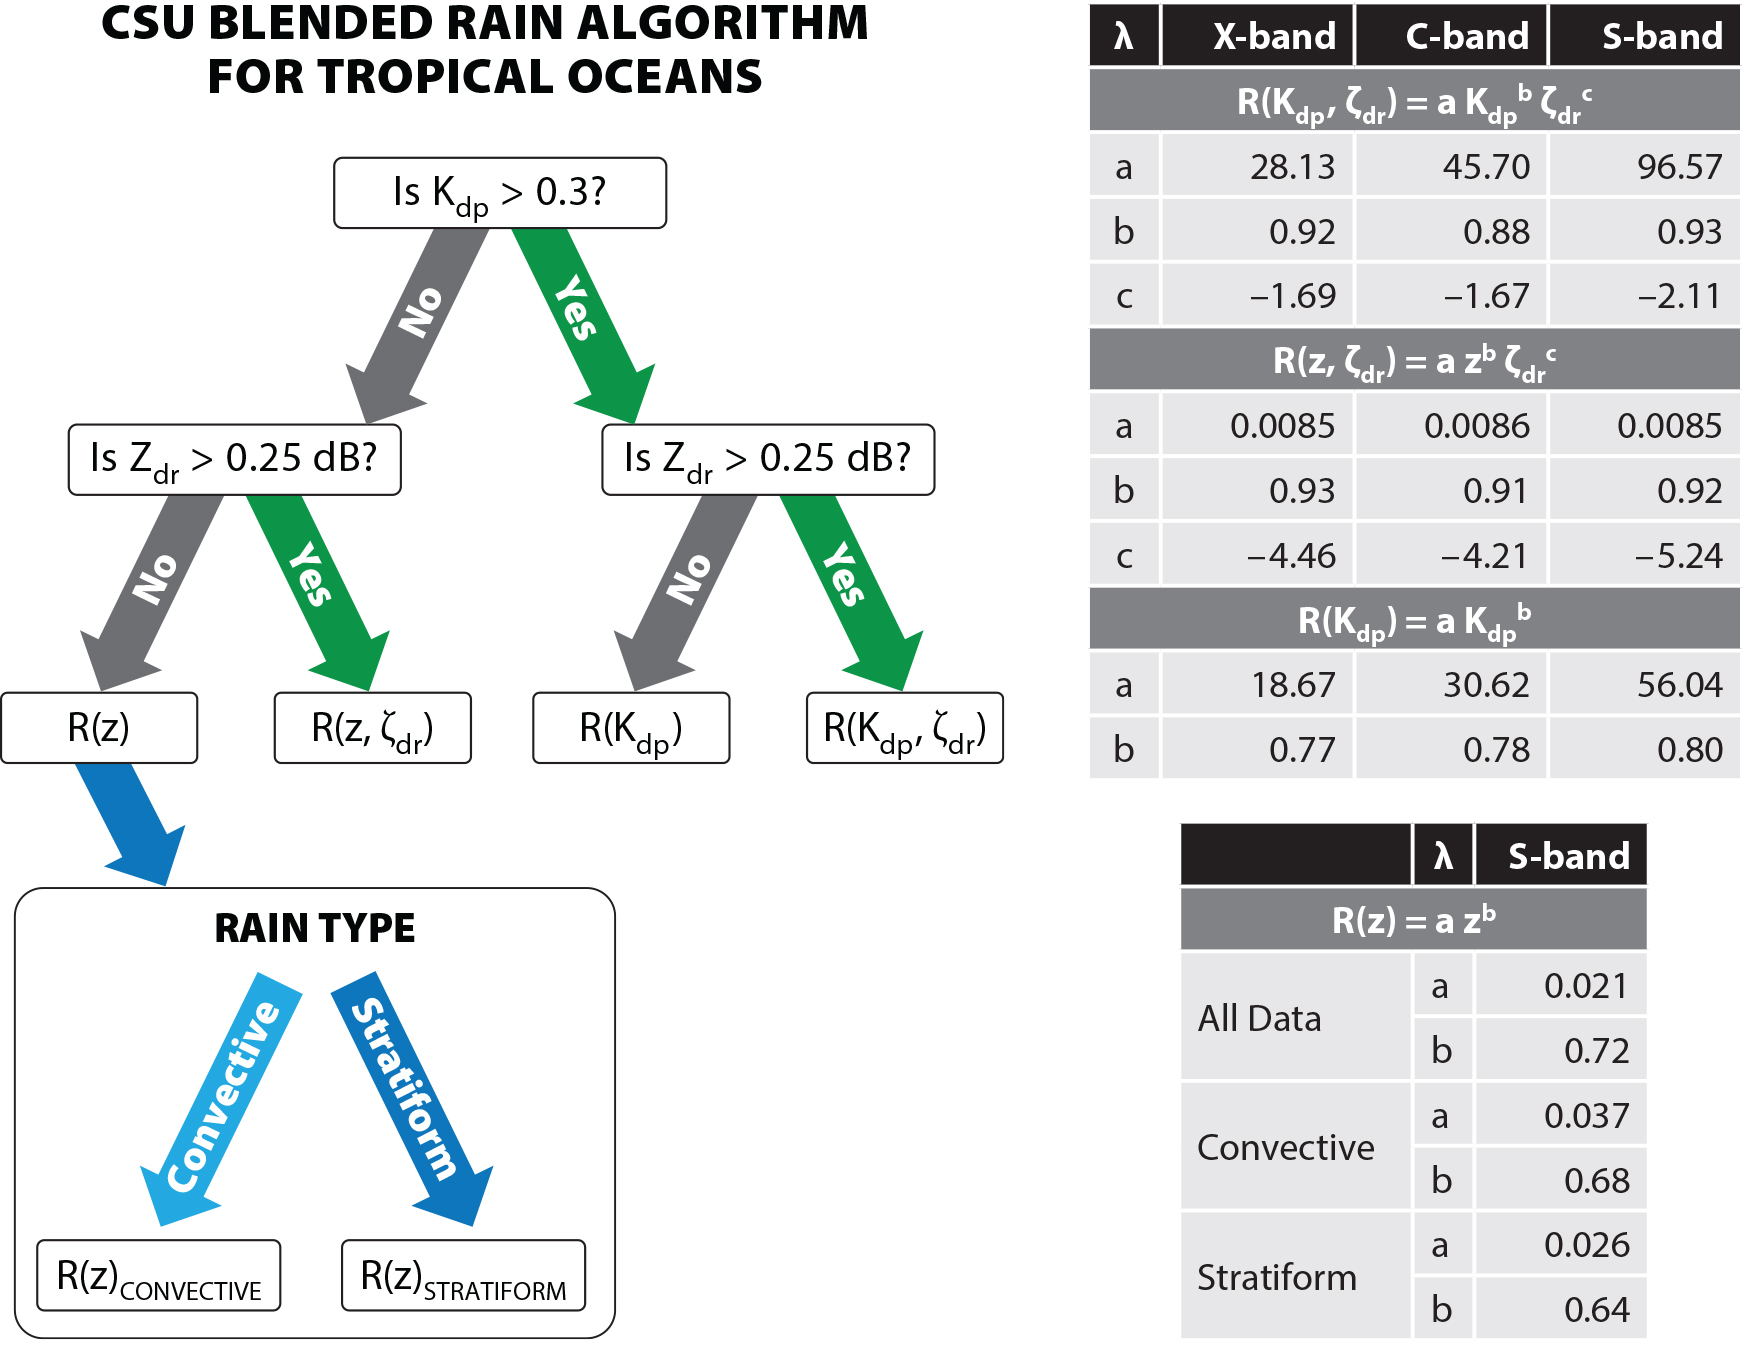
Figure 3. Logic for the CSU rain mapping algorithm for tropical ocean regions. See text for explanation of the logic structure. > High res figure
|
Figure 4 provides an example of the central output of the algorithm, showing instantaneous rain rates, rain accumulation maps, and the “age” of rain at the surface. These fields were displayed in near real time on a large monitor in the ship’s main lab so that oceanographers would be aware of the rainfall patterns and intensities around the ship. The time lag between acquiring the raw data and displaying the final fields illustrated in Figure 4 was approximately two minutes.
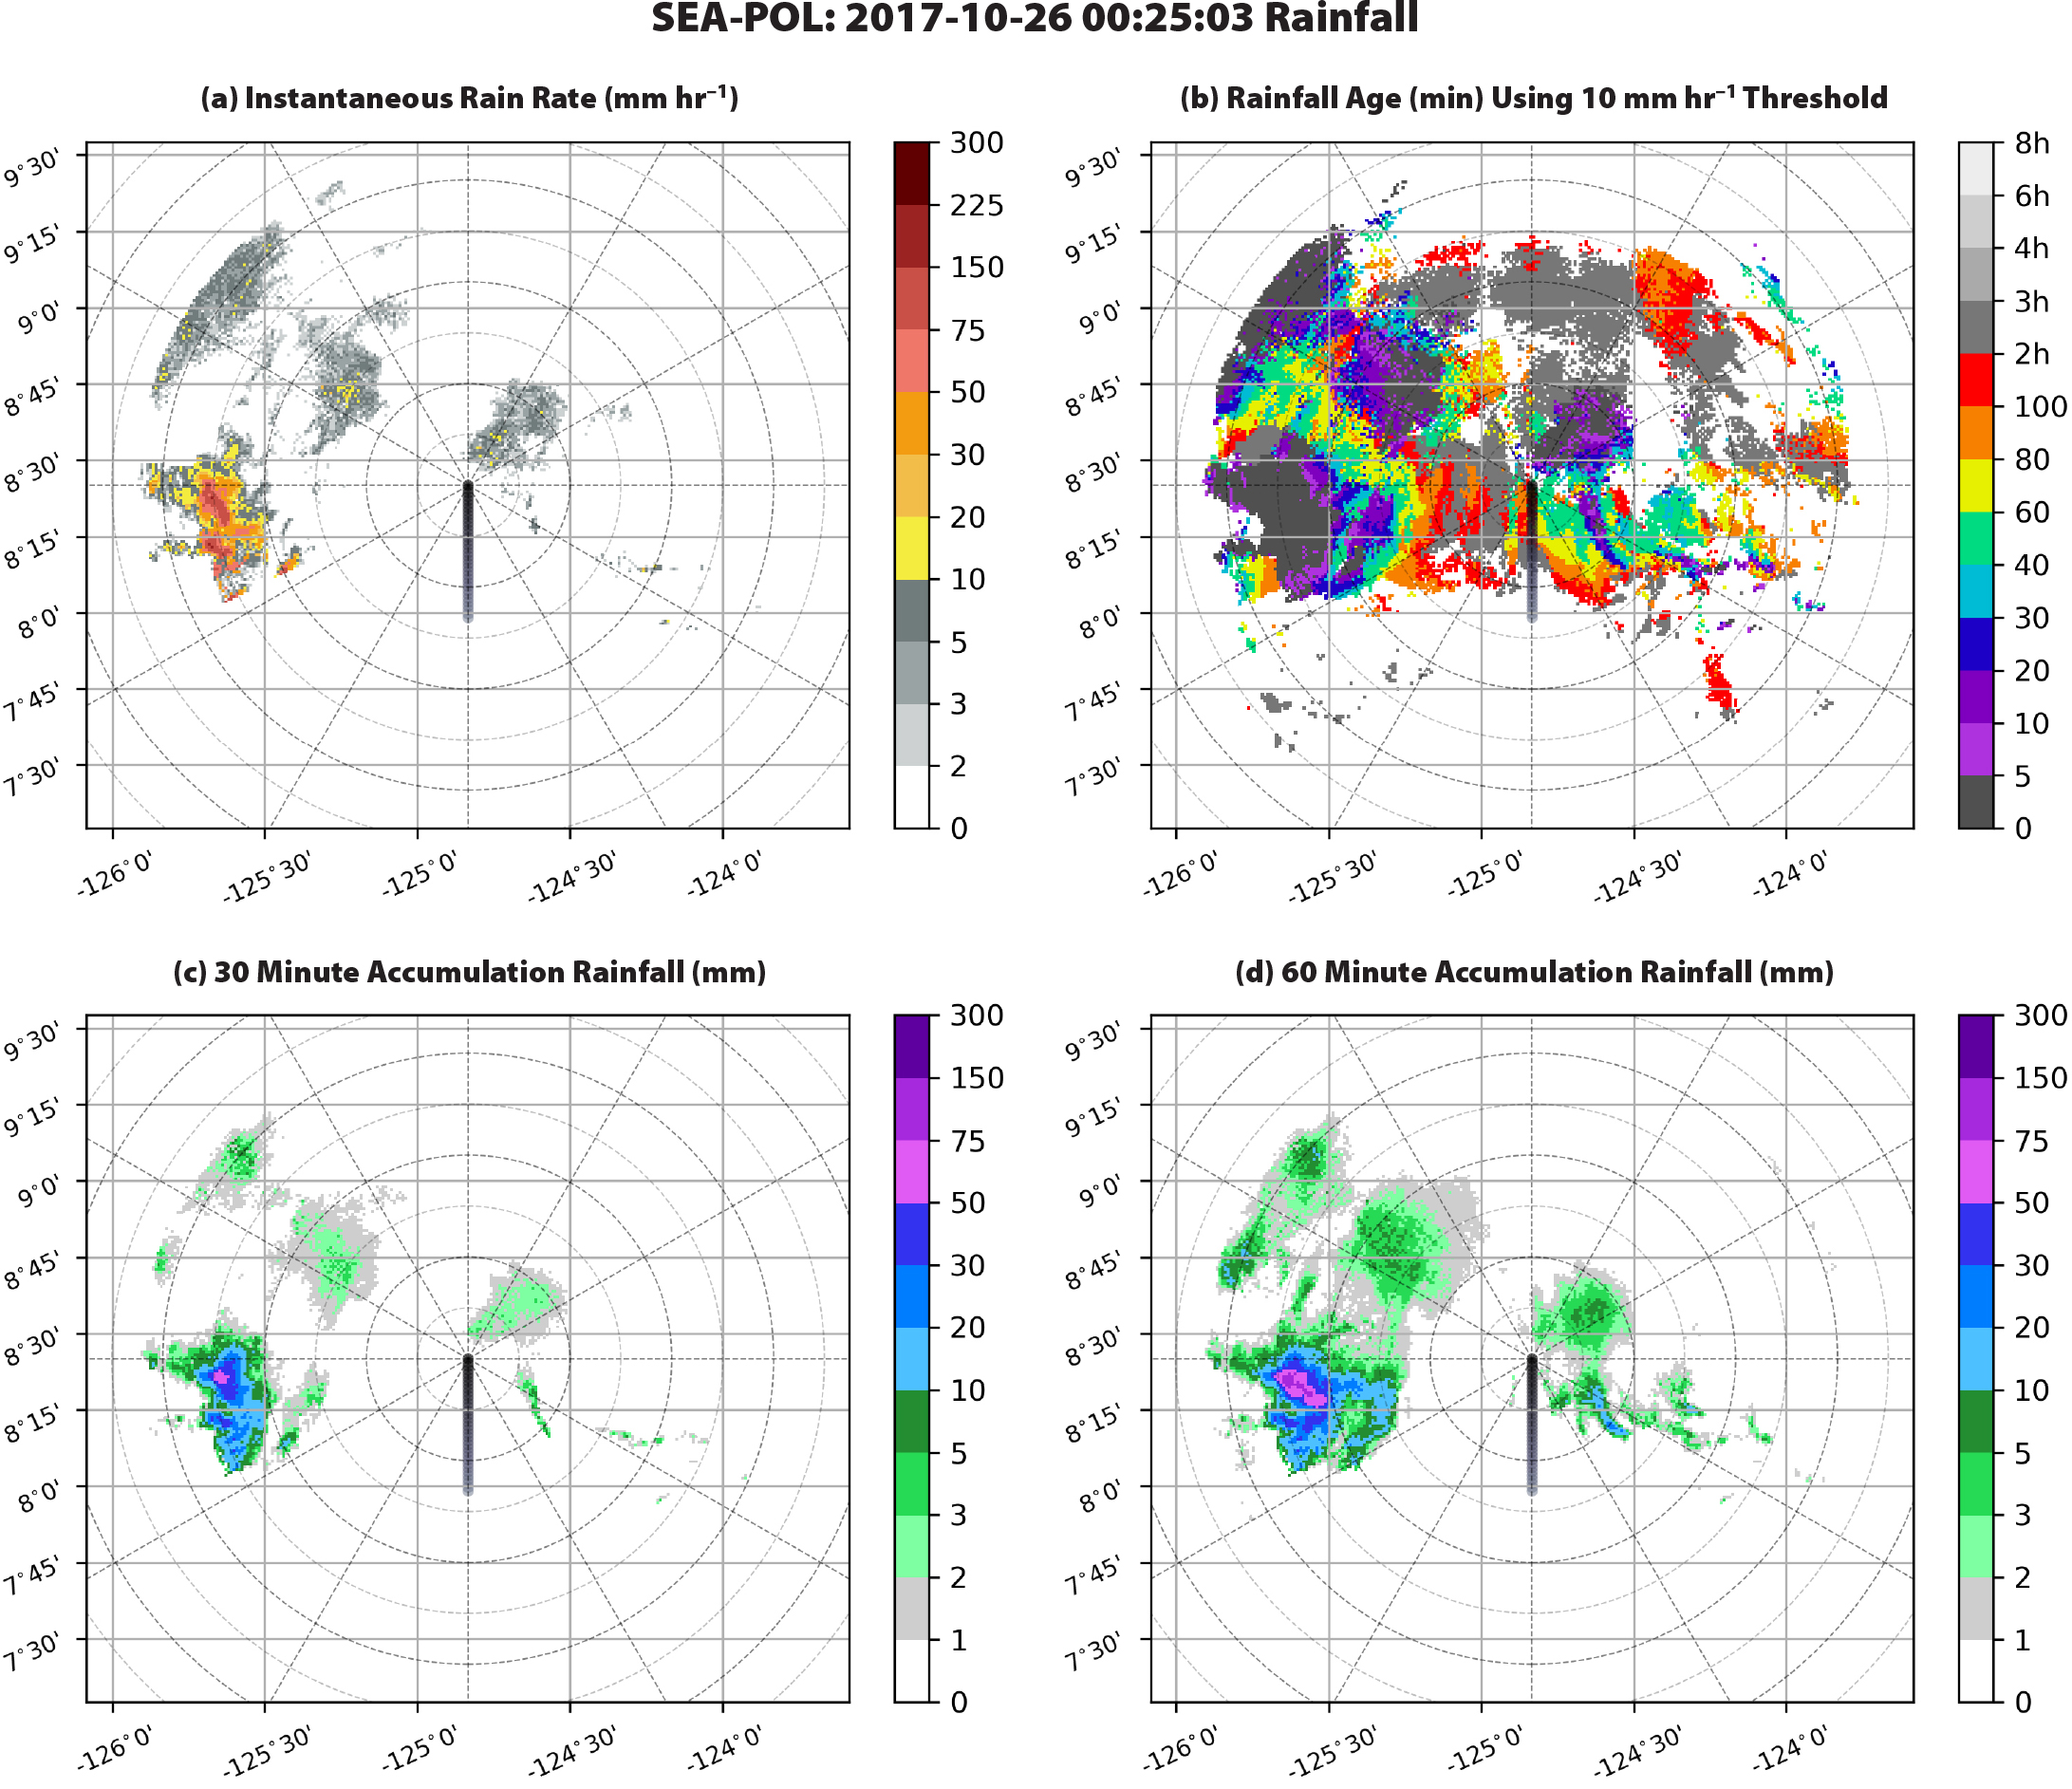
Figure 4. Outputs from the SEA-POL rain algorithm. Panel a displays the instantaneous rain rate in mm hr–1. Panel b shows the age of rain on the ocean’s surface for initial rain rates exceeding 10 mm hr–1. Panel c shows the rainfall accumulation in mm for the previous 30 minutes. Panel d is for a 60-minute accumulation period. These maps were updated after every five minute rain volume scan, and the grid was adjusted for movement of the ship. Range rings are shown at intervals of 10 nm. This example is from October 26, 2017. > High res figure
|
Discussion and Conclusions
This short study serves to illustrate the unique aspects of the CSU SEA-POL radar. For the first time, the US research community deployed a dual-polarimetric weather radar on a ship. In addition to providing high-quality rain mapping, SEA-POL can also examine the structure of tropical precipitation via its polarimetric variables. These variables serve as inputs to so-called hydrometeor identification (HID) algorithms that reveal the distribution of particle types in precipitating clouds (such as heavy rain, light rain, graupel, aggregates, and pristine ice). Dolan et al. (2013) present an example of a C-band HID algorithm. Now a deployable asset, capable of operating on ships and on land, SEA-POL just completed another successful deployment as part of the US Office of Naval Research-funded Propagation of Intra-Seasonal Tropical OscillatioNs (PISTON) campaign in the Western Pacific.