Global and National Needs for Marine Biodiversity Data
Marine biodiversity and the ecosystem services provided by numerous species bolster human health and well-being in several ways (Barbier, 2017; Salomon and Dahms, 2018). To achieve effective conservation and sustainable societal development, it is important to both assess the state of the ocean’s biological and ecosystem resources and predict how these resources will change across time, space, and levels of biological organization. Yet, our ability to gauge the state of marine resources is limited to a handful of locations where data have been collected repeatedly for decades (e.g., Taylor et al., 2012; Thompson et al., 2019). Thus, our understanding of the status and trends of marine biodiversity at national and global scales is lacking in great measure because there are many data gaps in observations of species and their distribution and abundance (Kot et al., 2010; UNESCO, 2016; Muller-Karger et al., 2018a).
Observational data can be used by the public, governments, researchers, and the private sector to answer questions about marine species and how they are changing over time. Answering these questions requires establishing global programs for the systematic collection of biological and ecosystem observations concurrently with environmental variables, following a minimum set of best practices. Such an approach is articulated by the Marine Biodiversity Observation Network (MBON) and the Biology and Ecosystems Panel of the Global Ocean Observing System (GOOS Bio-Eco) (Miloslavich et al., 2018; Muller-Karger et al., 2018b). Coordination of observation methods as well as curation, storage, and mechanisms for distribution of data are critical activities for informing local and national governments about the state of marine ecosystems to enable ecosystem-based management and to design effective policy frameworks. At the international level, standardized observations and open-access data support progress toward the 2030 targets of the UN Sustainable Development Goals (General Assembly resolution 70/1, 2015) and the post-2020 targets of the Convention on Biological Diversity (2020; CBD POST2020/PREP/2/1). They also support the Intergovernmental Science-Policy Platform on Biodiversity and Ecosystem Services assessments (IPBES, 2019) as well as negotiations of the international community for conservation and sustainable use of marine biodiversity in areas beyond national jurisdictions (General Assembly Resolution 72/249).
The Census of Marine Life, which concluded in 2010, enhanced our knowledge about the status of marine biodiversity and clarified the importance of clear-cut, systematic, and sustainable approaches to observing and monitoring biological communities across different levels and scales. In May 2010, the US National Oceanographic Partnership Program (NOPP), the NOPP Biodiversity Interagency Working Group, and seven US federal agency cosponsors convened a workshop titled “Attaining an Operational Marine Biodiversity Observation Network (MBON)” to assess existing monitoring efforts, resources, and needs toward establishing such a systematic observing approach for marine biodiversity (Duffy et al., 2013).
The workshop examined biodiversity monitoring methods and recommended approaches for observing biodiversity in estuarine and nearshore regions, coral reefs, the deep sea (pelagic realm and benthic seabed), and continental shelves. Specific suggestions were made for siting monitoring activities, building on existing facilities and programs, leveraging data sets and observing systems, integrating across existing systems, and incorporating transformative ideas and technologies to better address biodiversity data and information needs. Participants noted that (1) integration of data collected by ongoing monitoring efforts was insufficient; (2) assembly and synthesis of existing programs and data would be necessary to identify trends and gaps in taxonomic, spatial, and temporal coverage; and (3) innovative approaches for data discovery and methods to dynamically interrelate data sets and add value to existing monitoring data were needed.
Organizations providing data and metadata in standardized ways using open and findable, accessible, interoperable, and reusable (FAIR) guiding principles (Wilkinson et al., 2016) will meet the data demands of the global marine observing community. Policy-level indicators (measurable information used to reflect the status of and monitor progress toward goals) provide a roadmap to drive data collection. They show where data and information gaps exist in assessing global biodiversity change and provide a direct link from data collection to development of these indicators while using the essential variables to guide that development (Benson et al., 2018).
However, data practitioners face a multitude of challenges when it comes to managing biological data. The heterogeneity in biological data collection, documentation, and analysis means that each data set requires unique handling. Because a variety of metadata and data standards, vocabularies, and ontologies exist for biological data, choosing the one(s) that best fits the data, methodology, and management goals can be a time-consuming process and may not result in a clear decision. Standards do not always fit the data perfectly or are missing controlled vocabularies for terms leading to differing use and limiting reuse. Social challenges still exist with sharing data, with data providers requiring embargoes on releasing data, concerns about not receiving proper credit, and lack of incentives for sharing data. Finally, data practitioners lack time and resources to devote to learning new standards and performing data transformation.
Here, we describe the ways the MBON, GOOS Bio-Eco, and the Ocean Biodiversity Information System (OBIS) are partnering to address the needs of data practitioners managing biological data by collaborating with local partners, developing standardized and reusable field sampling and data processing protocols, sharing data openly with globally integrated resources, and crafting a workflow for data and biodiversity products that is FAIR.
Partnerships Lead to Improved Data Management
Data management cannot be handled by a single person or organization due to the breadth of knowledge the process requires. Thus, data management requires participation and engagement from across agencies and jurisdictions. Given that US MBONs are supported by the National Oceanic and Atmospheric Administration (NOAA), the National Aeronautics and Space Administration (NASA), the Bureau of Ocean Energy Management (BOEM), and the Office of Naval Research (ONR), management of MBON data also requires engagement from these organizations.
Each MBON has a regional network of institutions that can build support for and provide input on data management needs. The MBON partnerships described in Chavez et al. (2021, in this issue) work to ensure that data management processes are robust, meet stakeholder needs, and can be shared throughout the network.
MBON data management practices also contribute to and are informed by international partnerships and networks such as the collaboration between MBON, GOOS Bio-Eco, and OBIS (Benson et al., 2018; Canonico et al., 2019). For instance, major elements of GOOS, including the Bio-Eco panel, some of the GOOS Ocean Observing Regional Alliances, and other ocean observing systems, have adopted Darwin Core as the standard for biological observations. Darwin Core is a standard glossary of terms used for sharing and integration of biological diversity data (Wieczorek et al., 2012). It was originally designed for natural history collections, but its use and applicability have expanded with its adoption by global biodiversity data aggregator repositories like OBIS and the Global Biodiversity Information Facility (GBIF), providing an example for US MBON and US Geological Survey’s Ocean Biodiversity Information System-USA (OBIS-USA) to follow. Darwin Core’s processes are being implemented in other countries as well through efforts like the MBON Pole to Pole of the Americas (Canonico et al., 2019; Montes et al., 2021, in this issue).
Rationale for Standardized Data
One primary MBON goal is to understand how and why biodiversity is changing over local to global domains. To achieve this goal requires integration of data from multiple sites and is facilitated by standardization of the data. Benefits derived from data standardization include increased data reuse and improved findability, accessibility, and interoperability—it makes data FAIRer. Implementation of data standardization facilitates aggregation of data sets originally intended for local assessments into broader spatial and temporal integrations. These integrations are key for understanding patterns that occur across regions and even globally, and identify responses of biological communities to local, regional, and large-scale natural and human drivers. MBON standardization helps integrate data from different groups and databases, and it improves analyses in the context of historical legacy data. Applying FAIR principles also facilitates integration of biodiversity observations with multi-platform Earth observation data and therefore enhances our understanding of biodiversity and ecosystem change.
While not an accurate metric of use, data download statistics serve as a gauge of interest in both the data and the data platform. For example, unique downloads of one of the MBON data sets increased by two orders of magnitude once the data were standardized and shared with the globally integrated resources of OBIS and GBIF.
Metrics for tracking data reuse are difficult to quantify, but they provide a measure of how useful and important a set of observations are for scientific, management, or policy applications. GBIF is furthest along in providing a full picture of reuse with its implementation of advanced data citation tracking capabilities that include minting a digital object identifier (DOI) for each user-specified unique spatial or taxonomic data download from its system. In other words, a DOI is minted that references all the data from different sources that were generated by a specific search on the platform. GBIF can then track use of the DOIs across peer-reviewed publications and downstream uses of those publications. For instance, data that were downloaded from GBIF (Warren et al., 2018) were used in a special report of the Intergovernmental Panel on Climate Change focusing on the impacts of global warming of 1.5°C (Hoegh-Guldberg et al., 2018). The report highlighted the value of reuse of data for analyses at broad spatial scales and for keeping track of how the data were collected and accessed and by whom. Assigning DOIs to individual data sets yields the additional benefit of acknowledging data contributors, thus further incentivizing data sharing.
Furthermore, standardizing and sharing of data as well as code for producing visualizations, indicators, and synthesis products optimizes resources by reducing duplication of effort. When data, metadata, code, and knowledge are shared freely using standards, groups working on similar issues can employ existing technical infrastructure. Analyses or indicator workflows can then be crafted using openly accessible and machine-readable methods, and code can easily be shared and re-run as new data are made available. These practices greatly accelerate the analysis-to-knowledge process. Standardized workflows, in turn, facilitate reproducibility of scientific results and accelerate collaborative research (Poisot et al., 2019). The data mobilization community can be informed more quickly of data gaps and target data sets that will help fill those gaps. We can then begin to see a collaborative, interactive, knowledge development cycle to hasten our understanding of marine biodiversity.
Types of MBON-Supported Data
MBON-managed data take many forms but can be sorted into a few generalized types based on underlying data structures. This grouping should be considered when choosing software and systems.
Satellite Data
Satellite remote sensing can provide context for in situ observations and a means of scaling and visualizing changes in biodiversity in space and time. Its synoptic oceanographic context provides a basis for assessing and managing in situ observations; detecting sampling gaps; analyzing spatiotemporal variability, including the geographic footprints of extreme events; and linking changes in biodiversity to short and long-term environmental change. Biodiversity research often utilizes several types of satellite data that allow direct and indirect assessments that include studies of plankton functional types, changes in benthic foundation species, and changes in pelagic habitat type (see Kavanaugh et al., 2021, in this issue). Dynamic satellite seascape mapping, a novel satellite product developed by MBON, is becoming widely adopted by the biodiversity research community (Kavanaugh et al., 2016, 2018). Satellite seascape maps are constructed using a machine-learning classification of surface habitats based on dynamic fields of satellite and modeled data (Kavanaugh et al., 2016). NOAA currently generates satellite seascape maps and distributes them operationally for public use by NOAA CoastWatch (https://coastwatch.noaa.gov/cw/) using interoperable web services. CoastWatch also provides a web-based platform for visualization and analysis of seascape data to facilitate the adoption of seascape maps in biodiversity applications (https://coastwatch.noaa.gov/cw_html/cwViewer.html#). As part of MBON efforts, seascapes are being examined for their utility in describing biogeographic patterns of habitat relevant to multiple trophic levels including phytoplankton, zooplankton, and fisheries (e.g., Montes et al., 2020; Kavanaugh et al., 2021, in this issue). Seascape data can be utilized to derive indices for identifying changes in habitat extent and representation within management units where habitat is highly variable over time (such as fronts or hotspots) or where there are highly productive areas relevant to fisheries.
Taxa Observations
Taxa observations are identifications of a species at any level of the taxonomic hierarchy that are collected on a single date and with one or more measurements, usually with latitude and longitude coordinates included. Specifically, minimum requirements for uploading taxa observations into OBIS and GBIF include: (1) scientific name (at any level of the taxonomic hierarchy, including Operational Taxonomic Units and Amplicon Sequence Variants from metagenomic surveys) vetted, where possible, against taxonomic libraries such as the World Register of Marine Species (WoRMS, https://www.marinespecies.org/); (2) date of collection; (3) geographic coordinates of observations; and (4) compliance with the Darwin Core standard (Wieczorek et al., 2012).
For MBON purposes, taxa observations are generally collected as part of sampling events (e.g., research cruises, transects) and include measurements such as temperature and salinity as well as taxa data such as abundance, length, and weight that can be included in the Darwin Core extended measurement or fact extension (De Pooter et al., 2017). Data collection methodologies that include taxa observations are animal tracking, abundance measures, net casts, eDNA, visual surveys, and quadrats, among many others.
Generally, sampling events are the primary way in situ biological observations are collected and can be interrelated, grouped under parent events, or arranged as a sequence of events in time (De Pooter et al., 2017). Sampling events can have spatiotemporal coverage as a point, line, area, or volume of space and can span any finite length of time. In general, sampling events will have at minimum a location and time.
In the authors’ experience, challenges with taxa observation data include heterogeneity in data collection and documentation, difficulty in taxonomic identifications and reliably matching those identifications to taxonomic authorities (i.e., WoRMS), and the significant investment required for integrating multiple data sets for broad spatial and temporal analyses.
Generalized MBON Data Flow
MBON data processing involves several steps to ensure that data are FAIR and shared using standards, and that data are incorporated from all projects associated with MBON. The workflow starts from field data on the left and end-user products on the right (Figure 1). At each stage of the process, the data increase in accessibility and interoperability until they are synthesized into a visualization intended to allow users to understand them quickly and efficiently. MBON members are expected to provide the widest practical access to data collected. They agree to ensure alignment of biological data to the Darwin Core standard (http://rs.tdwg.org/dwc/terms/index.htm and http://rs.tdwg.org/dwc/) and adherence of metadata to the International Organization for Standardization (ISO) 19115 family of geospatial metadata standards that have been endorsed by the Federal Geographic Data Committee (International Organization for Standardization, 2014). In the United States, it is recommended that data collected and mobilized by MBON be submitted by the project to an ERDDAP (a data server that provides a method for downloading gridded and tabular data in multiple formats; Simons, 2020) or comparable server that enables ingestion to the MBON Portal as well as OBIS.
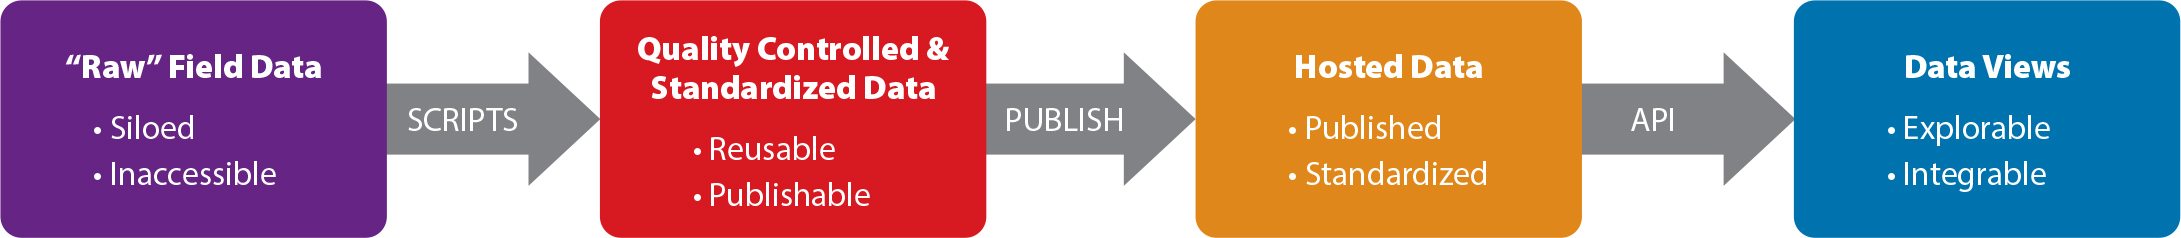
Figure 1. Marine Biodiversity Observation Network (MBON) data follow a generalized flow that ensures adherence to appropriate data and metadata standards and accessibility in machine readable ways for reproducibility and open access. API = Application programming interface. > High res figure
|
As we follow data through this generalized flow, the data must first be quality controlled to ensure consistency and accuracy. All data fields must be defined and provide as much context as possible using ISO 19115 metadata. Once the data have passed through this stage, they can be shared via data package repositories like Data Observation Network for Earth (DataONE) Portal, Environmental Data Initiative Data Portal, or MBON Portal. In the United States, projects are required to archive data packages at the NOAA National Centers for Environmental Information (NCEI). At this point, the data are findable and accessible but are not fully integrated with other data sets. Integration is made possible by using a data standard. Darwin Core is the global standard for taxa observation biological data used by major national and international programs like OBIS, GBIF, and the Atlas of Living Australia (Wieczorek et al., 2012). Standardization has increased FAIR-ness by allowing data to be searched and selected across multiple data sets and permitting extraction of subsets specific to user needs. As raw field data are restructured, organized, and ingested into a system, the data served over an application programming interface (API) are available for exploration through software and for visualization and analysis.
Implementation of this process requires participation from several groups working in concert to move data from the raw, siloed form to the end user products necessary for knowledge sharing and decision-making. In the United States, the US Integrated Ocean Observing System (IOOS) Regional Associations serve as one possible intermediary group between observers and OBIS-USA, facilitating movement of data from one stage in Figure 1 to the next.
For example, the Gulf of Mexico Coastal Ocean Observing System (GCOOS) worked with US MBON projects to document, standardize, and share MBON mobilized data via ERDDAP with the global community. GCOOS data managers invested time and resources to understand and implement Darwin Core and performed this work on regional data sets, improving accessibility for information on coral reef fish (see Ault et al., 2019, entries in supplementary materials) and coral monitoring (see Porter and Stoessel, 2020, listings in supplementary materials) in the Florida Keys and Dry Tortugas National Park, Key West, Florida. Unique downloads of these data have reached about 6,000 from GBIF alone. The data are now included in analyses published in 22 different publications.
The IOOS Central and Northern California Observing System (CeNCOOS) coordinated collaboration among three different institutions that operate volunteer programs, performing effort-based beach surveys to identify beach cast marine mammal and bird carcasses on different stretches of the California coast. These valuable data were collected in similar fashions, but because the three groups recorded their observations using identifying codes and data formats developed in-house, it was not possible to aggregate them to provide a picture of ecosystem health over the entire coast. Disparate database codes used by each group for observations such as species identification and carcass condition contained nuances that needed discussion and agreement. To ease the initial burden on the three organizations, they were not immediately required to change their in-house databases, but rather tables were developed to translate each data set to the standard upon upload to the aggregated database. The CeNCOOS-led collaboration enabled combination of all three databases into a single ERDDAP data set for serving via the CeNCOOS data portal. The standardization required substantial effort, but the rewards include the possibility of automation of data ingestion, fewer reporting errors, more timely development of coast-wide ecosystem indicators, and the ability to standardize to Darwin Core to allow more widespread use of the data.
Similar to CenCOOS, the Alaska Ocean Observing System quality controlled, standardized, and shared data collected by the Alaska Marine Biodiversity Observation Network. Original data were made accessible via DataONE, and standardized data were archived at NCEI and then shared with OBIS and GBIF. Data were also made accessible via the MBON Portal. AMBON has shared data sets on fish (Mueter et al., 2019), benthic epifauna (Iken and Canino, 2020, 2021), marine birds (Kuletz et al., 2020), and mammals (Stafford et al., 2020; see supplementary materials for data sets referenced in this sentence). A benthic epifauna data set that was shared to OBIS on March 21, 2021, already had 550 unique downloads from OBIS by May 14, 2021.
The Santa Barbara Coastal Long Term Ecological Research program (SBC LTER) offers another example of the MBON processing workflow. Data collected for the SBC LTER Kelp Forest Reef Fish Abundance program (see SBC MBON and Reed, 2018, in supplementary materials) were standardized using Darwin Core and made available to OBIS and GBIF. These data had been downloaded almost 4,000 times by the time of this writing (May 14, 2021). Peer-reviewed publications using these data showcase the power of sharing with such a strategy of standardization (e.g., Hastings et al., 2020; Lin et al., 2021).
Figure 2 illustrates the generalized data flow being carried out successfully by MBON, but there is still work to be done. Data sets from the demonstration MBON projects are still at different stages in the generalized data flow process (Figure 3) and need concerted effort to ensure they move through each step and meet the FAIR requirements. This work is vital to understanding the state of our ocean at national, regional, and global scales.
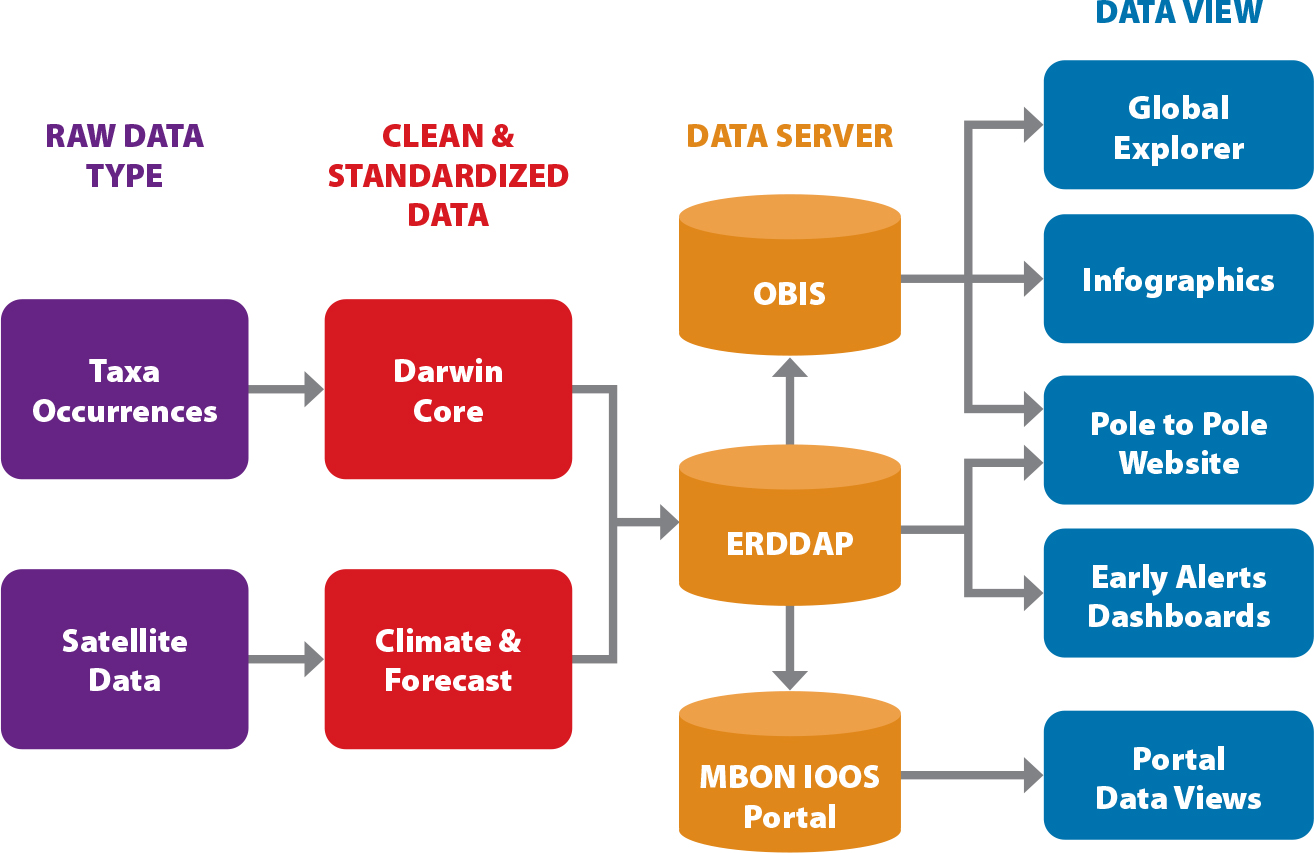
Figure 2. Starting from the left of the diagram above, raw data of different types are cleaned, standardized, hosted, and made into data products for end users. On the right are data-driven products designed to address specific user stories from MBON end users. The Global Explorer was developed to display a global map of biodiversity status indicators for each regional Exclusive Economic Zone. The Climate and Forecast standard (https://cfconventions.org/) is most often used with physical oceanographic data and the Network Common Data Form (NetCDF) format. OBIS = Ocean Biodiversity Information System. IOOS = Integrated Ocean Observing System. > High res figure
|
Figure 3. Four different data servers and the number of MBON data sets on each server. At each server, the data sets are currently at different stages along the generalized data flow process pipeline, with differing levels of maturity. NCEI = National Centers for Environmental Information. OBIS = Ocean Biodiversity Information System. GBIF = Global Biodiversity Information Facility. > High res figure
|
A major challenge for the marine biological community is to develop a processing workflow for each of the GOOS Bio-Eco Essential Ocean Variables (variables identified by GOOS Expert Panels as being critical for understanding the ocean environment). MBON is facilitating communication within the marine biological observing community to adopt the data processing strategy outlined above, and the efforts of MBON can be seen in all the new and legacy data sets that are helping to inform about Essential Ocean Variables (EOVs; Figure 4). As more data are standardized and made accessible through integrated data resources like OBIS, updated analyses can be conducted and refined. Continuous integration of new data means that analyses can be replicated and improved, creating faster flows of data into knowledge processes.
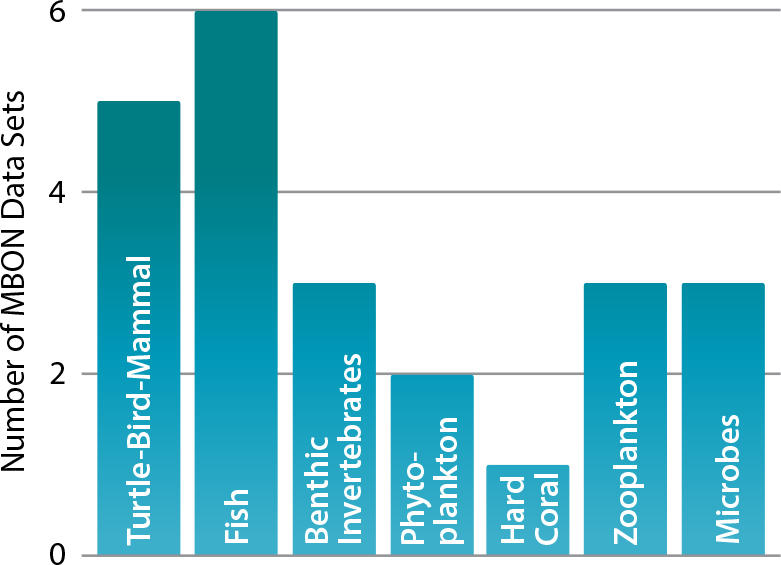
Figure 4. MBON managed and collected data contribute to the Global Ocean Observing System Essential Ocean Variables (EOVs) identified by the marine biological community as the most important variables that need to be measured to understand changes in ocean biology and ecosystems. MBON data contribute to this enterprise by making accessible new and legacy data necessary for understanding the status and trends of the EOVs. > High res figure
|
Although researchers have a role to play in the data management process, they can become overwhelmed by the challenges associated with it. Following the MBON generalized data flow process provides researchers with a template to follow, and there are partnerships they can pursue for help in navigating it (e.g., IOOS Regional Associations). Also, there are a few helpful steps researchers can take prior to beginning data collection. First is to consider aligning data documentation to a targeted data standard format. For example, data collection for a taxonomic observation should follow the Darwin Core format to ease the transformation into the Darwin Core standard. If that is not possible, researchers should consider using a consistent format throughout data collection that is targeted for machine readability, such as formatting data spreadsheets with columns in the same order and with the same titles and in long rather than wide format. Researchers can consider publishing the raw data format alongside any code or protocol used to transform the data. By publishing these files, other researchers can reuse the raw format and transformation scripts. Lastly, researchers should consider including data management as part of research funding budgets.
Uses of Managed MBON Data
User-friendly, online tools are needed to ensure ecosystem and biodiversity data are available for resource managers, scientists, educators, and the public. However, ensuring these data are readily available and easily digestible is both challenging and costly. MBON has demonstrated a model for collaboration with NOAA’s National Marine Sanctuary and Integrated Ecosystem Assessment programs, MBON Pole to Pole researchers, and the MBON Portal to develop web-based, interactive tools to explore and better understand environmental change across habitats and entire ecosystems as well as the responses of living resources within them to multiple drivers.
US IOOS has committed to continue development of the MBON Portal (https://mbon.ioos.us/), which emerged from the demonstration effort as a platform where users can search and download real-time, delayed mode, and historical data for in situ and remotely sensed physical, chemical, and biological observations. The portal allows users to compare data sets across regions and disciplines; generate and share custom data views; link to information about protocols, methods, and best practices for biological observing; and access a full suite of interactive infographics and other tools for research and management applications.
Interactive Infographics
MBON data have been incorporated into infographics that are used by the NOAA National Marine Sanctuaries and the NOAA Integrated Ecosystem Assessment Program deployed around the United States. The infographics provide views of status and trends of different variables, making the information available for the public.
The NOAA Southeast Fisheries Science Center has been conducting visual surveys of reef fish species in the Florida Keys since 1978, and, more recently, in the Dry Tortugas National Park and the Southeast Florida region. These data represent a key monitoring baseline for coral reef fish species in South Florida and were targeted for mobilization by the US MBON. Before the reef visual census data were incorporated into the infographics, they were aligned to Darwin Core and shared via OBIS and ERDDAP (Figure 5). Data used in the infographics come from multiple API sources, including OBIS and ERDDAP. Visualization of the data is accomplished using R-markdown documents with embedded R and Python code (Figure 6). The website is built into static HTML, JavaScript, and CSS files that can be easily and cheaply served from practically any web server.

Figure 5. Data flow from raw reef visual census data into an interactive infographic on reef health. OBIS = Ocean Biodiversity Information System. API = Application programming interface. > High res figure
|
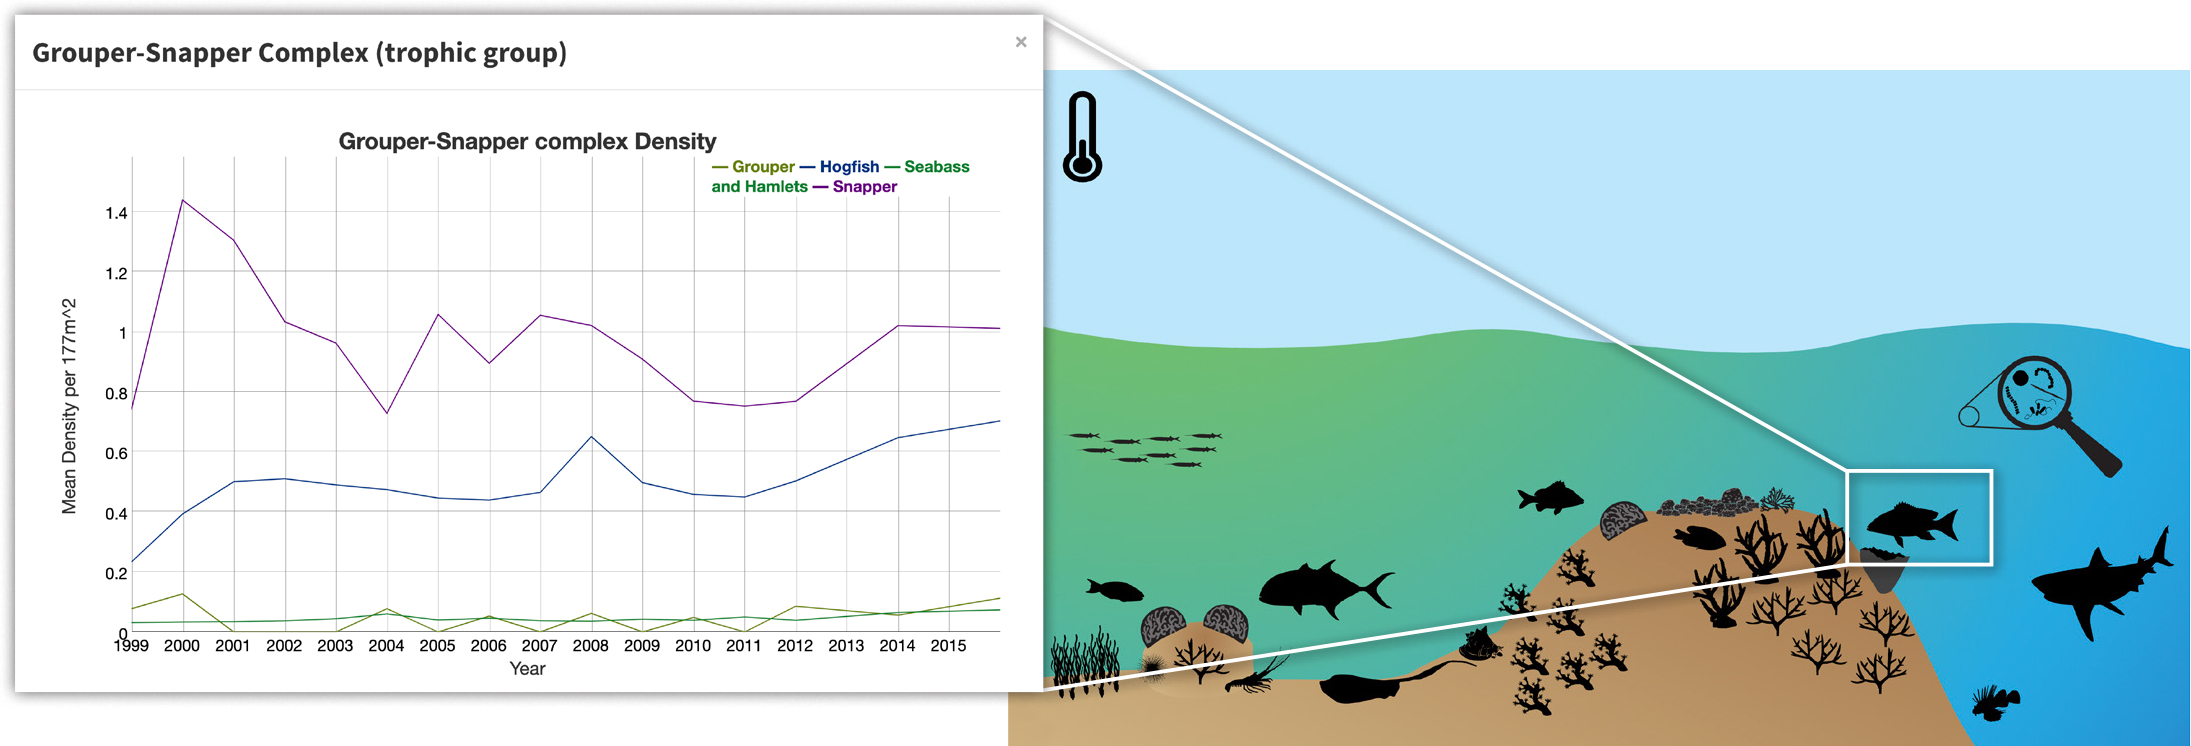
Figure 6. NOAA Southeast Fisheries Science Center reef visual census monitoring data are incorporated here into a Florida Keys National Marine Sanctuary interactive infographic for exploring status and trends of different biological variables. > High res figure
|
Early Alert Dashboards
Satellite time-series data provide a globally consistent view of ocean color-based bioindicators that can be used to assess the ecosystem status of a region within a global context. Although time series of satellite data are available globally, the challenge of converting the three-dimensional time series into a metric for a given region of interest was improved by the MBON data management best practices (Figure 7). Additionally, ERDDAP includes two features that have reduced delays and streamlined the data processing for early alert dashboards. First, the delivery of images through ERDDAP’s API simplifies inserting these images directly into a Grafana dashboard. Second, using the spatial subsetting features of ERDDAP reduces the time it takes for time series to be pulled from satellite data. The combination of these factors allows managers and stakeholders to get up-to-date overviews of the status of their managed region as well as notification of unusual events in real time to inform management actions. Data-driven dashboards use MBON satellite and in situ environmental data to provide a near-real-time view of the Florida Keys (Key West, Florida) and Flower Garden Banks National Marine Sanctuaries (100 nautical miles offshore of Galveston, Texas; Figure 8). These data-driven dashboards are powered by an ERDDAP and Graphite backend and use Grafana to create data visualizations. Additionally, email alerts based on indicators like sea surface temperature have been created to notify managers of unusual events as they happen.

Figure 7. MBON data management workflows streamline satellite data inclusion in data-driven dashboards. API = Application programming interface. > High res figure
|

Figure 8. MBON Early Alert Dashboards provide managers and stakeholders with an overview of satellite time series in their region of interest and include optional email alerts for unusual events in real time. This screenshot shows recent satellite images alongside time series (sea surface temperature (SST), chlorophyll-a, algal bloom index), providing natural resource managers a view of near-real-time anomalous events. > High res figure
|
IOOS MBON Portal
The Fisheries Ecology Division of the NOAA National Marine Fisheries Service (NMFS) Southwest Fisheries Science Center has been conducting a trawl survey within the California Current since 1983 targeting rockfish (Sebastes spp.) recruitment indices. These data represent an important time series for epipelagic micronekton (active swimming organisms between 2 cm and 10 cm) within the California Current and were targeted for mobilization by MBON (Field et al., 2019). Although the data were already accessible via ERDDAP, they were aligned to Darwin Core to facilitate sharing to the global user community of OBIS and GBIF as well as integrated into the MBON Portal (Figure 9).
Once the data were in the MBON Portal, an MBON Portal Data View was created using a variety of diversity metrics that can be combined into a comparison chart along with environmental data such as the Group for High Resolution Sea Surface Temperature Level 4 Multiscale Ultrahigh Resolution Global Foundation Sea Surface Temperature Analysis (Figure 10). The functionality in this data view provides a unique integration of diversity metrics from different subsets of the data, including environmental data, that researchers or managers can manipulate in order to assess changes over time. The data view was based on analyses from Santora et al. (2017) that found ocean temperatures drive certain aspects of biodiversity and that offers an example of how the MBON Portal can be used to replicate published analyses.

Figure 9. The NOAA National Marine Fisheries Service Southwest Fisheries Science Center Rockfish Recruitment data set is included in the MBON data flow and incorporated into an MBON Portal Data View. OBIS = Ocean Biodiversity Information System. API = Application Programming Interface. > High res figure
|
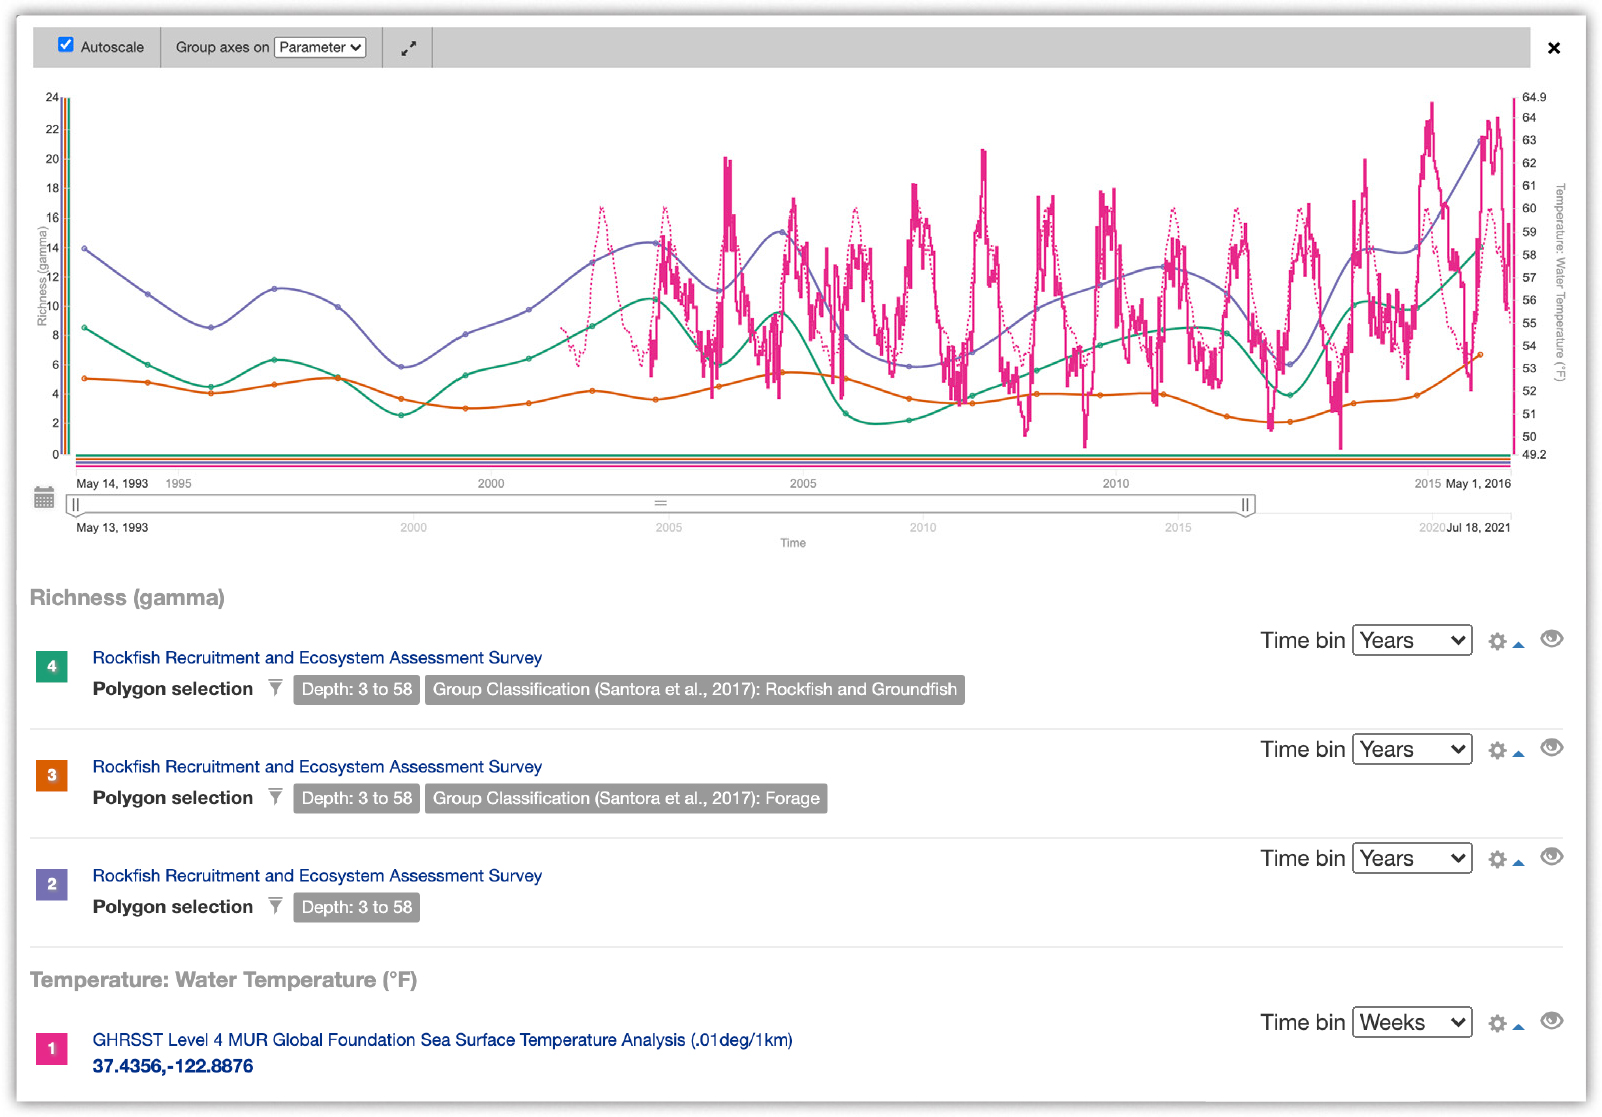
Figure 10. NOAA National Marine Fisheries Service Southwest Fisheries Science Center Rockfish Recruitment Survey data are included in the MBON Portal, which analyzes and displays a variety of species diversity metrics with environmental data in a comparison chart. > High res figure
|
Data Viewer of the MBON Pole to Pole Program
Similar to the early alert dashboards, the MBON Pole to Pole program provides an online interactive map with locations of monitoring sites highlighted and with clickable markers that allow users to visualize and download satellite data and OBIS records for a particular site. This tool enables data collectors and researchers to access satellite remote-sensing observations binned at 1–4 km pixel resolution and at weekly intervals as maps, time-series plots, and data tables (e.g., CSV). As a result, synoptic measurements of sea surface temperature (SST), chlorophyll-a (CHL), and seascape fields are now being utilized by MBON Pole to Pole participants monitoring biological communities of rocky intertidal zones, subtidal coral and rocky reef habitats, and sandy beaches to examine seasonal and interannual changes around these ecosystems and how such changes drive shifts in their communities. These observations are being matched with in situ temperature and atmospheric records to, for example, confirm the occurrence of anomalous conditions within regional settings like marine heatwaves or higher-than-average river discharge events that can impact intertidal macro-invertebrate and reef communities.
The MBON Pole to Pole visualizations were developed following the MBON data process described in Figure 11. ERDDAP’s web map feeds a data visualization protocol for each of the MBON Pole to Pole sites (Figure 12). The website is built into a static site using open source tools from R (R Core Team, 2021), and the data are hosted in ERDDAP. By following the MBON data best practices, the MBON Pole to Pole site can be constructed and hosted using free web services such as Travis Continuous Integration (a framework that does automated processing and deployment of code, https://www.travis-ci.com/) and GitHub Actions deployment services and GitHub Pages site hosting. The site’s architecture relies on multiple functions under the leaflet (Cheng et al., 2021) and tidyverse (Wickham et al. 2019) R packages (e.g., ggplot2, dplyr) and others like rerddap (Chamberlain, 2021) that enable access to ERDDAP services with a single line of code. By updating a simple CSV table listing, all monitoring locations with corresponding geographic coordinates hosted at the project’s Github repository, remote-sensing products, and occurrences from OBIS for new monitoring sites can be easily produced (thus generating corresponding SST, CHL, and seascape maps, time-series plots, and data tables of both satellite fields and OBIS occurrences as well as maps of OBIS occurrences within the monitoring area) as more members join the network. Updating the CSV table requires minimal computing skills and no software license costs. The addition of new monitoring sites will automatically run a program routine that queries gridded satellite products from ERDDAP and generates the maps, time-series plots, and data tables, all via Travis Continuous Integration.

Figure 11. MBON Pole to Pole of the Americas website relies on data that follows the MBON data process for satellite data, streamlining the process for inclusion of data in web visualizations. API = Application programming interface. > High res figure
|
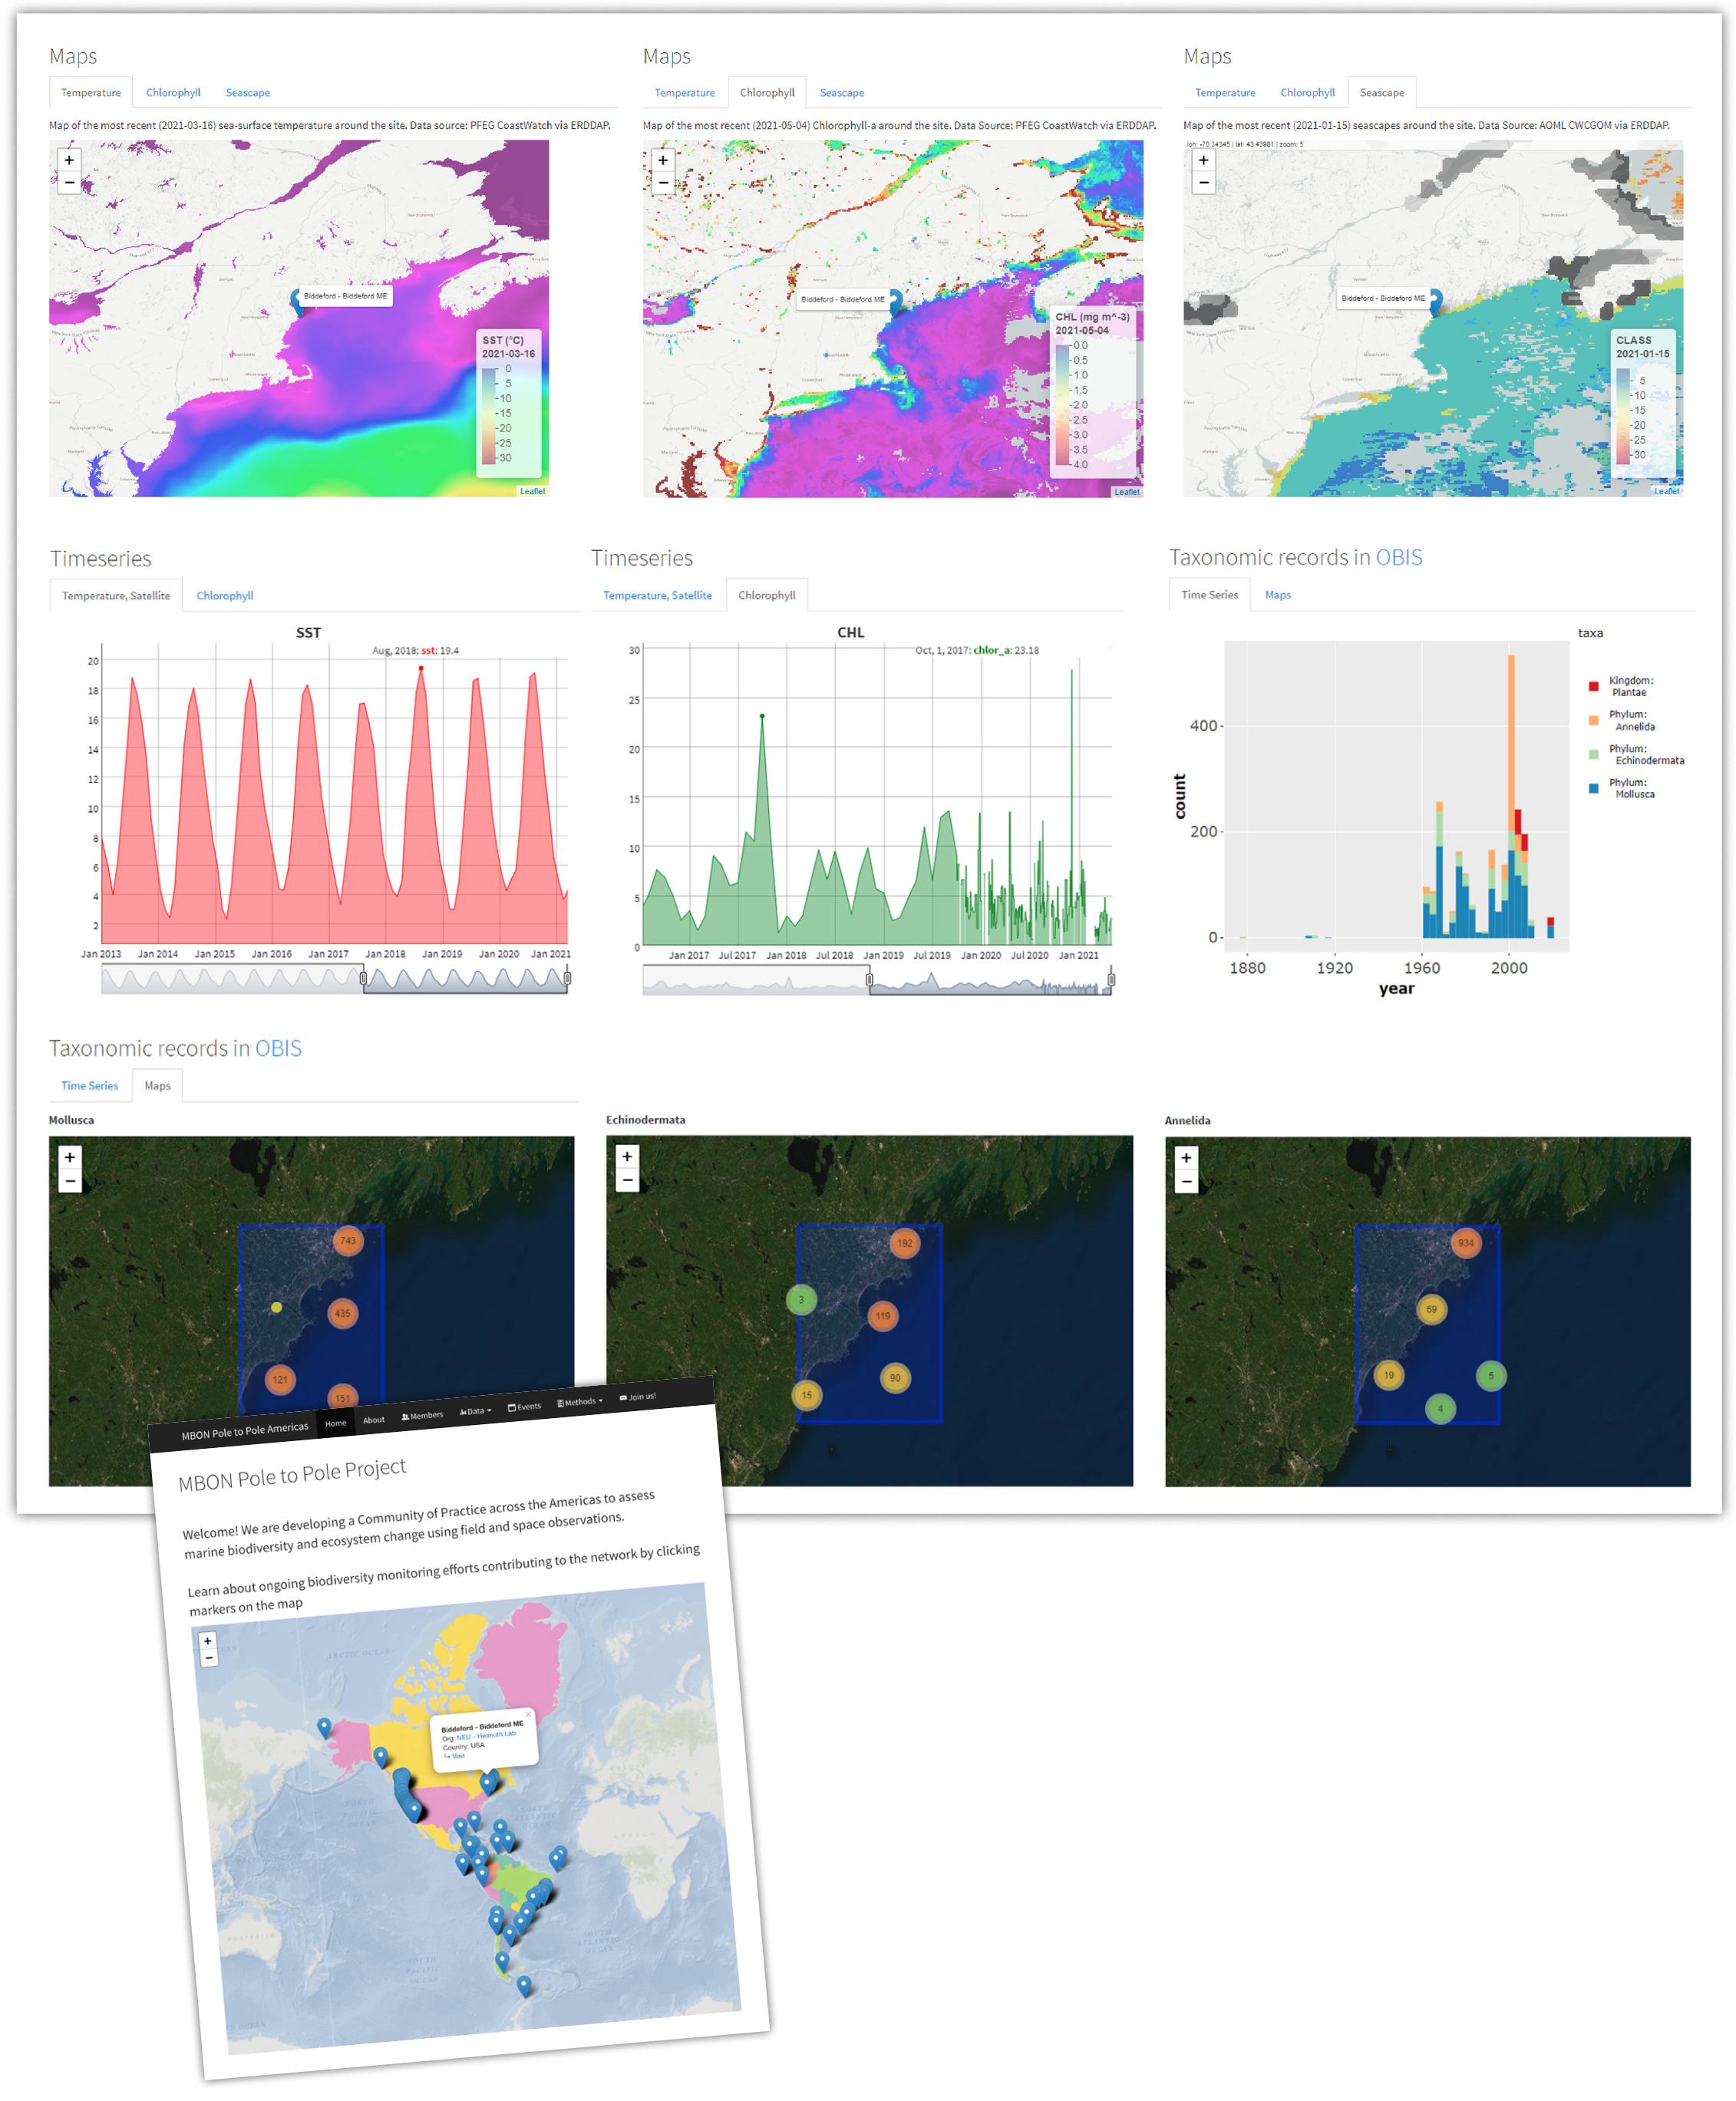
Figure 12. MBON Pole to Pole of the Americas data view for the monitoring station at Biddeford, Maine. By clicking on the site marker, the user can access dynamic maps of sea surface temperature (SST), chlorophyll-a (CHL), seascapes, and interactive time-series plots of SST and CHL that allow manual adjustment of the time span of the series. Tables with SST and CHL records for each site can be downloaded. The site also includes a time-series plot, available in OBIS, that shows the number of records aggregated per phylum and their geographic locations within a 0.25 × 0.25 degree box centered at the monitoring site. > High res figure
|
Future Directions
The next round of US MBON projects will bring opportunities for clarifying, improving, and expediting the MBON processing workflow. While many data collection methodologies are straightforward to work into the flow diagram shown in Figure 2, others such as environmental DNA and imaging flow cytometry will need thoughtful applications of standards and work within the standards and domain communities to produce the most logical harmonized products possible. Examining the workflow for places where automation could be implemented could yield efficiencies in both time and money associated with data management. Continuing to build partnerships and networks may help alleviate the social challenges that come with data sharing. Finally, work remains in building ontologies for biological concepts, improving processing scripts for data standardization, and speeding up the data collection-to-sharing timeframe.
OBIS has implemented functionality in its API for accessing measurement or fact data that are being shared. Darwin Core allows measurements such as length, weight, and abundance, and this information can be accessed using the OBIS API. Work is currently underway to improve use of vocabularies for harmonizing term use and better understanding of the measurements shared this way. For example, a term like fish length may mean standard length, fork length, or other methods of determining length, and by linking to a controlled vocabulary in the data that defines these terms explicitly facilitates better reuse of the data.
Globally shared data and information management strategies are fundamental for handling and enabling use of the extensive historical and rapidly growing amount of data. Standardized, coherent, consistent, practical, and feasible data and information management strategies are now possible to serve the operational requirements for knowledge about coastal and marine life from the surface to the bottom of the sea. Governments, academia, and the private sector can collaborate in adopting these standards and ensuring sufficient resources are available to support information management.
Using the generalized data flow outlined here, MBON has ensured the data are FAIR. MBON data management has led to cleaned and harmonized data products that speed up the data-to-knowledge process and produce interactive visualizations that managers can use to make science transparent to the public. Underpinning all of this work is a robust network of data providers, managers, and users exemplified by the regional, national, and international collaborations working to meet the needs for understanding and safeguarding our valuable public resources.
Acknowledgments
Any use of trade, firm, or product names is for descriptive purposes only and does not imply endorsement by the US Government. JT was funded by the NOAA Atlantic Oceanographic and Meteorological Laboratory and NOAA OceanWatch, and by the University of Miami’s Cooperative Institute for Marine and Atmospheric Studies [Award #NA15OAR4320064].