Introduction
The Atlantic Meridional Overturning Circulation (AMOC) consists of a complex set of currents that move warm, saline water northward and return cold, fresh water southward. This exchange of water masses is critical to many societally relevant processes, including global meridional heat transport (MHT; Ganachaud and Wunsch, 2003), winter climate over northern Europe (Palter, 2015), the latitude of the Intertropical Convergence Zone (Moreno-Chamarro et al., 2020), and anthropogenic carbon sequestration (Brown et al., 2021), and is a major source of inter-model uncertainty in transient global temperature response (Bellomo et al., 2021).
Oceanographers have traditionally defined the AMOC in depth coordinates because much of the northward flow in the subtropical North Atlantic is contained in the upper layers, and the southward flow in the lower layers. If one assumes that the mass budget of the Atlantic/Arctic flow is closed by neglecting the net flow through Bering Strait (Woodgate, 2018) and net precipitation, runoff, and evaporation in the North Atlantic (Kanzow et al., 2007), then the depth where the currents shift from net northward to net southward corresponds to the depth of maximum overturning. The sum of the meridional velocity above the depth of maximum overturning is then equal to the maximum in the AMOC stream function. Mathematically, this equates to:

where v is the meridional velocity (m s–1), x is the zonal direction, y is the meridional direction, z is the vertical direction, and t is time. There is historical precedent for this depth space definition—oceanographers have measured the AMOC for decades in the subtropical North Atlantic, where strong thermal stratification provides enough baroclinicity in the water column that the warm northward limb of the AMOC can flow directly over the cold southward limb (Figure 1). The longest direct estimates of the AMOC are from a repeat hydrographic line across 25°N that has been occupied since 1957 (Hall and Bryden, 1982), and the first continuous observations of the AMOC have been made since 2004 at the RAPID mooring array across 26.5°N (Cunningham et al., 2007).
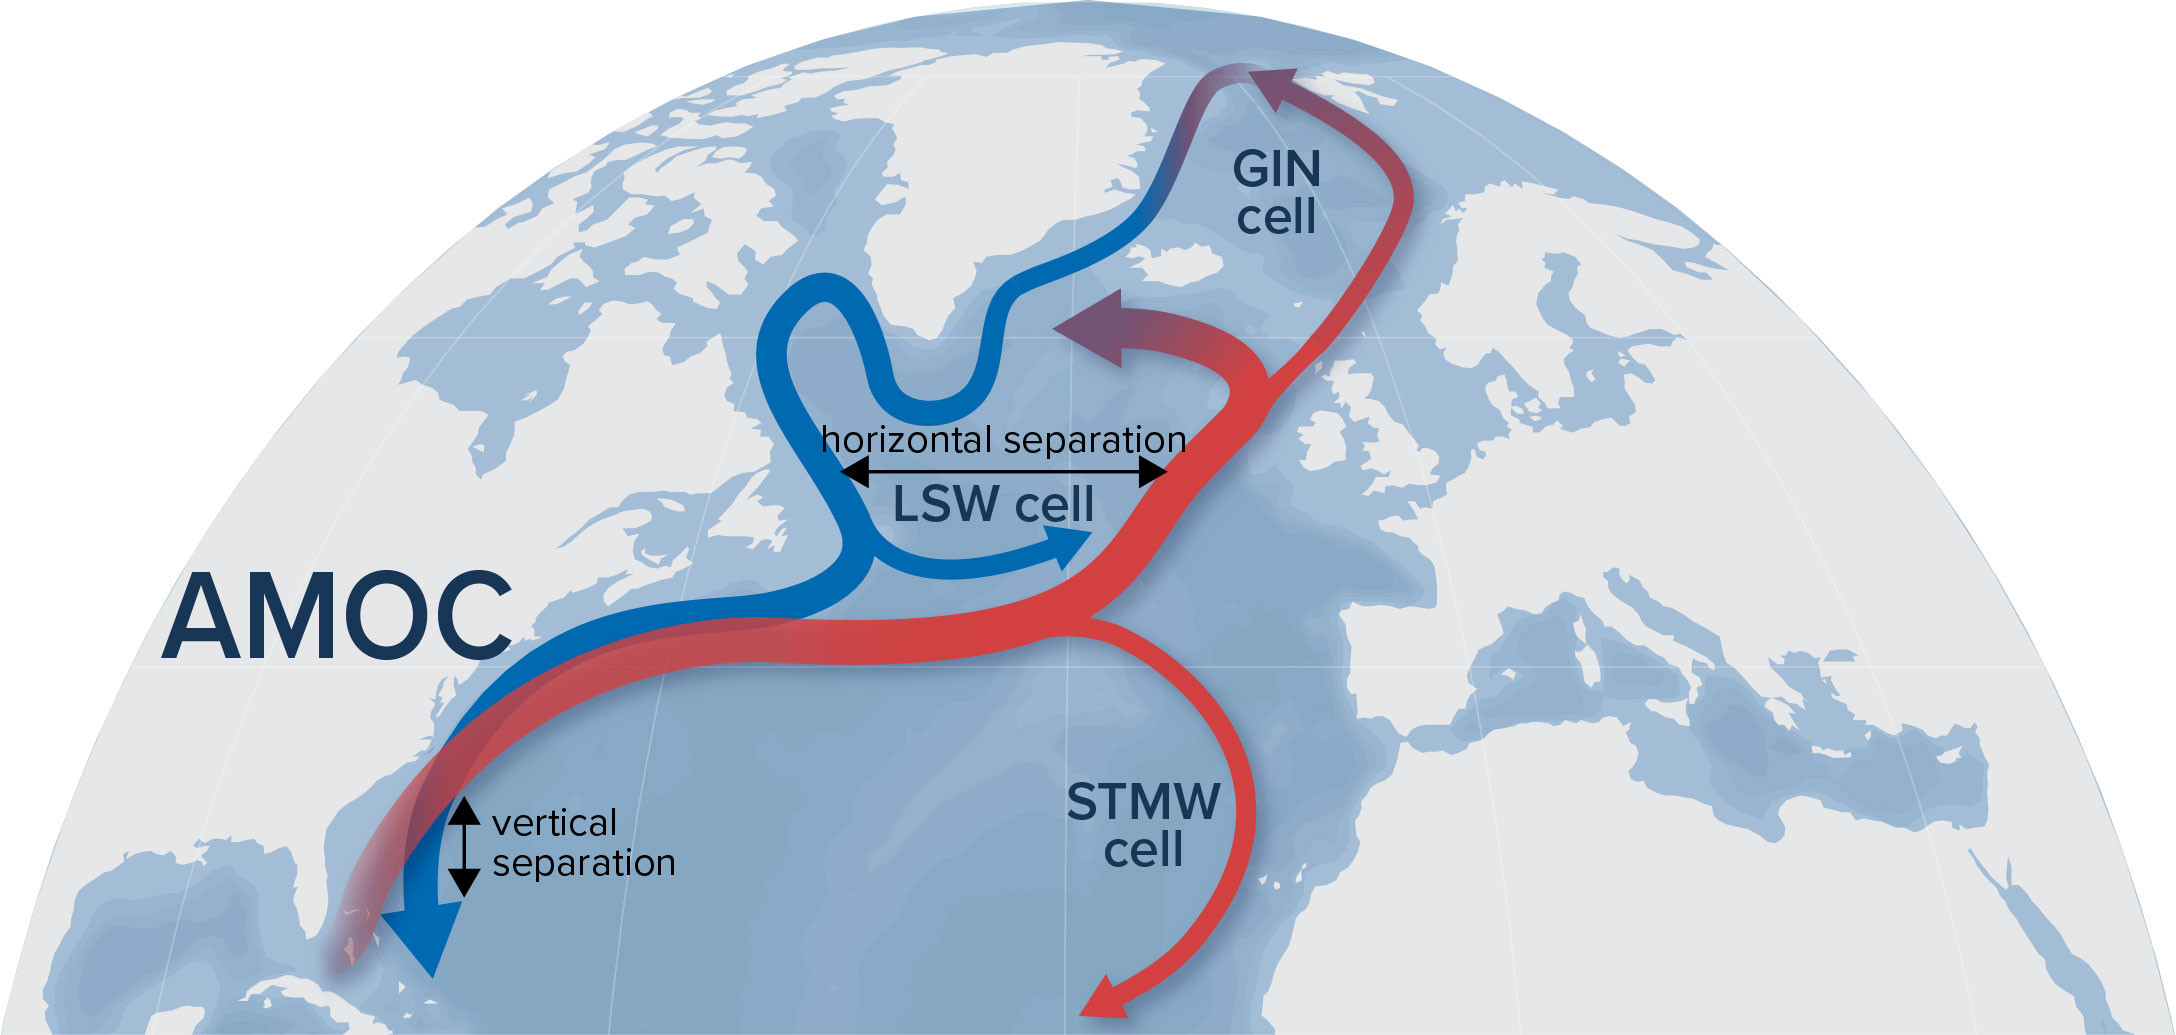
FIGURE 1. A simplified schematic representation of the Atlantic Meridional Overturning Circulation (AMOC) emphasizing the separation of the northward (red) and southward (blue) limbs vertically in the subtropics and horizontally in the subpolar gyre and Nordic Seas. Note that this figure does not depict the interior pathways of the southward limb (e.g., Bower et al., 2009) and minimizes the recirculation of subtropical and subpolar waters in their respective gyres. The three cells apparent in the density space stream function (Figure 2b) are shown: Greenland, Iceland, and Norwegian Seas (GIN) cell, Labrador Sea Water (LSW) cell, and Subtropical Mode Water (STMW) cell. > High res figure
|
But this focus on the subtropical North Atlantic has led to a definition of the AMOC that emphasizes its vertical dependency, despite the AMOC shifting to a horizontal circulation pattern further north (Zhang and Thomas, 2021). In the subpolar North Atlantic and Nordic Seas, reduced vertical stratification does not permit opposing currents to flow directly over one another, and instead, the northward limb of the AMOC flows along the eastern side of the basin while the southward limb flows along the western side (Figure 1). At these latitudes, the Overturning in the Subpolar North Atlantic Program (OSNAP) array defines the AMOC in density coordinates because the isopycnals are strongly zonally sloped, and the northward and southward limbs no longer flow at different depth levels (Lozier et al., 2019). Thus, when the meridional velocities are zonally summed in density classes, the northward and southward limbs remain apparent, even at high latitudes where the canonical “conveyor belt” lies on its side. Mathematically, this can be expressed as:

where the meridional velocities are summed over the thickness of density classes (ρ) rather than depth classes (z). Density (ρ) is typically defined as neutral density (McDougall, 1987) or σ2 (referenced to 2,000 m depth) to reduce the effect of nonlinearities in the equation of state for seawater, though sometimes σθ (referenced to the surface) is used for practical purposes (Li et al., 2017). The advantage of density coordinates is that water flows along isopycnals rather than along depth surfaces, and thus the AMOC in density space is more continuous and aligned with the physical flow. In addition, density coordinates isolate the transformation of water masses from lighter to heavier densities, a process that is important in the high-latitude North Atlantic, where waters are transformed continuously around the boundary currents, and waters of different densities tend to flow at the same depth level. At high latitudes, the oceanic MHT is accomplished more by the horizontal circulation than the vertical overturning (Spall, 2004). Thus, more of the North Atlantic circulation is retained when the AMOC is defined in density coordinates.
The importance of the density-space AMOC has previously been identified in Zhang (2010), and much of the physical oceanographic community has since shifted toward using density coordinates (e.g., Marshall and Speer, 2012; Kwon and Frankignoul, 2014; Jackson and Petit, 2022). Yet, many continue to use depth coordinates, leading to the development of parallel literatures using different coordinate systems to measure the same phenomenon. A 2019 Journal of Geophysical Research: Oceans special issue on the AMOC illustrated this dichotomy, with reviews using both density and/or depth coordinates (Little et al., 2019; Jackson et al., 2019; Johnson et al., 2019; Weijer et al., 2019; Hirschi et al., 2020). Though both definitions are valid perspectives on the same underlying flow field and thus one might expect them to vary coherently, recent modeling results indicate that they are not coherent, especially at high latitudes. Biastoch et al. (2021) report that the linear trends of the AMOC stream function in the VIKING model are twice as strong and located 20° further north in density coordinates than they are in depth coordinates. Furthermore, Årthun et al. (2023) find that the Nordic Seas AMOC simulated in the CESM-Large Ensemble stabilizes and partly recovers after 2050 when calculated in density coordinates but continues to decline after 2050 in depth coordinates. These results highlight that essential components of the AMOC literature may be sensitive to the coordinate system used to calculate them.
Scientific Gain
The AMOC is typically depicted as a stream function to more easily visualize the three-dimensional velocity field (Figure 2). This process of zonally integrating the velocity fields into a two-dimensional stream function inevitably leads to information being lost, but doing so in density coordinates results in less information loss than doing so in depth coordinates. To demonstrate this point, we use an example stream function calculated from the forced hindcast model HYCOM that has been shown to reliably reconstruct the observed AMOC structure (Xu et al., 2016). The depth space stream function (Figure 2a) presents the AMOC as one large overturning cell covering all depths and all latitudes with a peak near 35°N. In contrast, the density-space stream function (Figure 2b,c) identifies three overturning cells:
- A light overturning cell in the subtropical North Atlantic (σ2 = 31.50–34.75 kg m–3 and 0°–40°N) that depicts the formation of Subtropical Mode Water (STMW).
- An intermediate overturning cell spanning all latitudes but with a peak in the subpolar gyre (σ2 = 35.80–37.06 kg m–3, 20°S–60°N) that depicts the formation of Labrador Sea Water (LSW) in the Labrador and Irminger Seas. Note that not all models show a maximum of this cell in the subpolar North Atlantic.
- A dense overturning cell in the Greenland, Iceland, and Norwegian (GIN) Seas (σ2 = 37.06–37.30 kg m–3, 60°–75°N) that depicts the formation of the densest water masses north of the Greenland-Scotland Ridge.
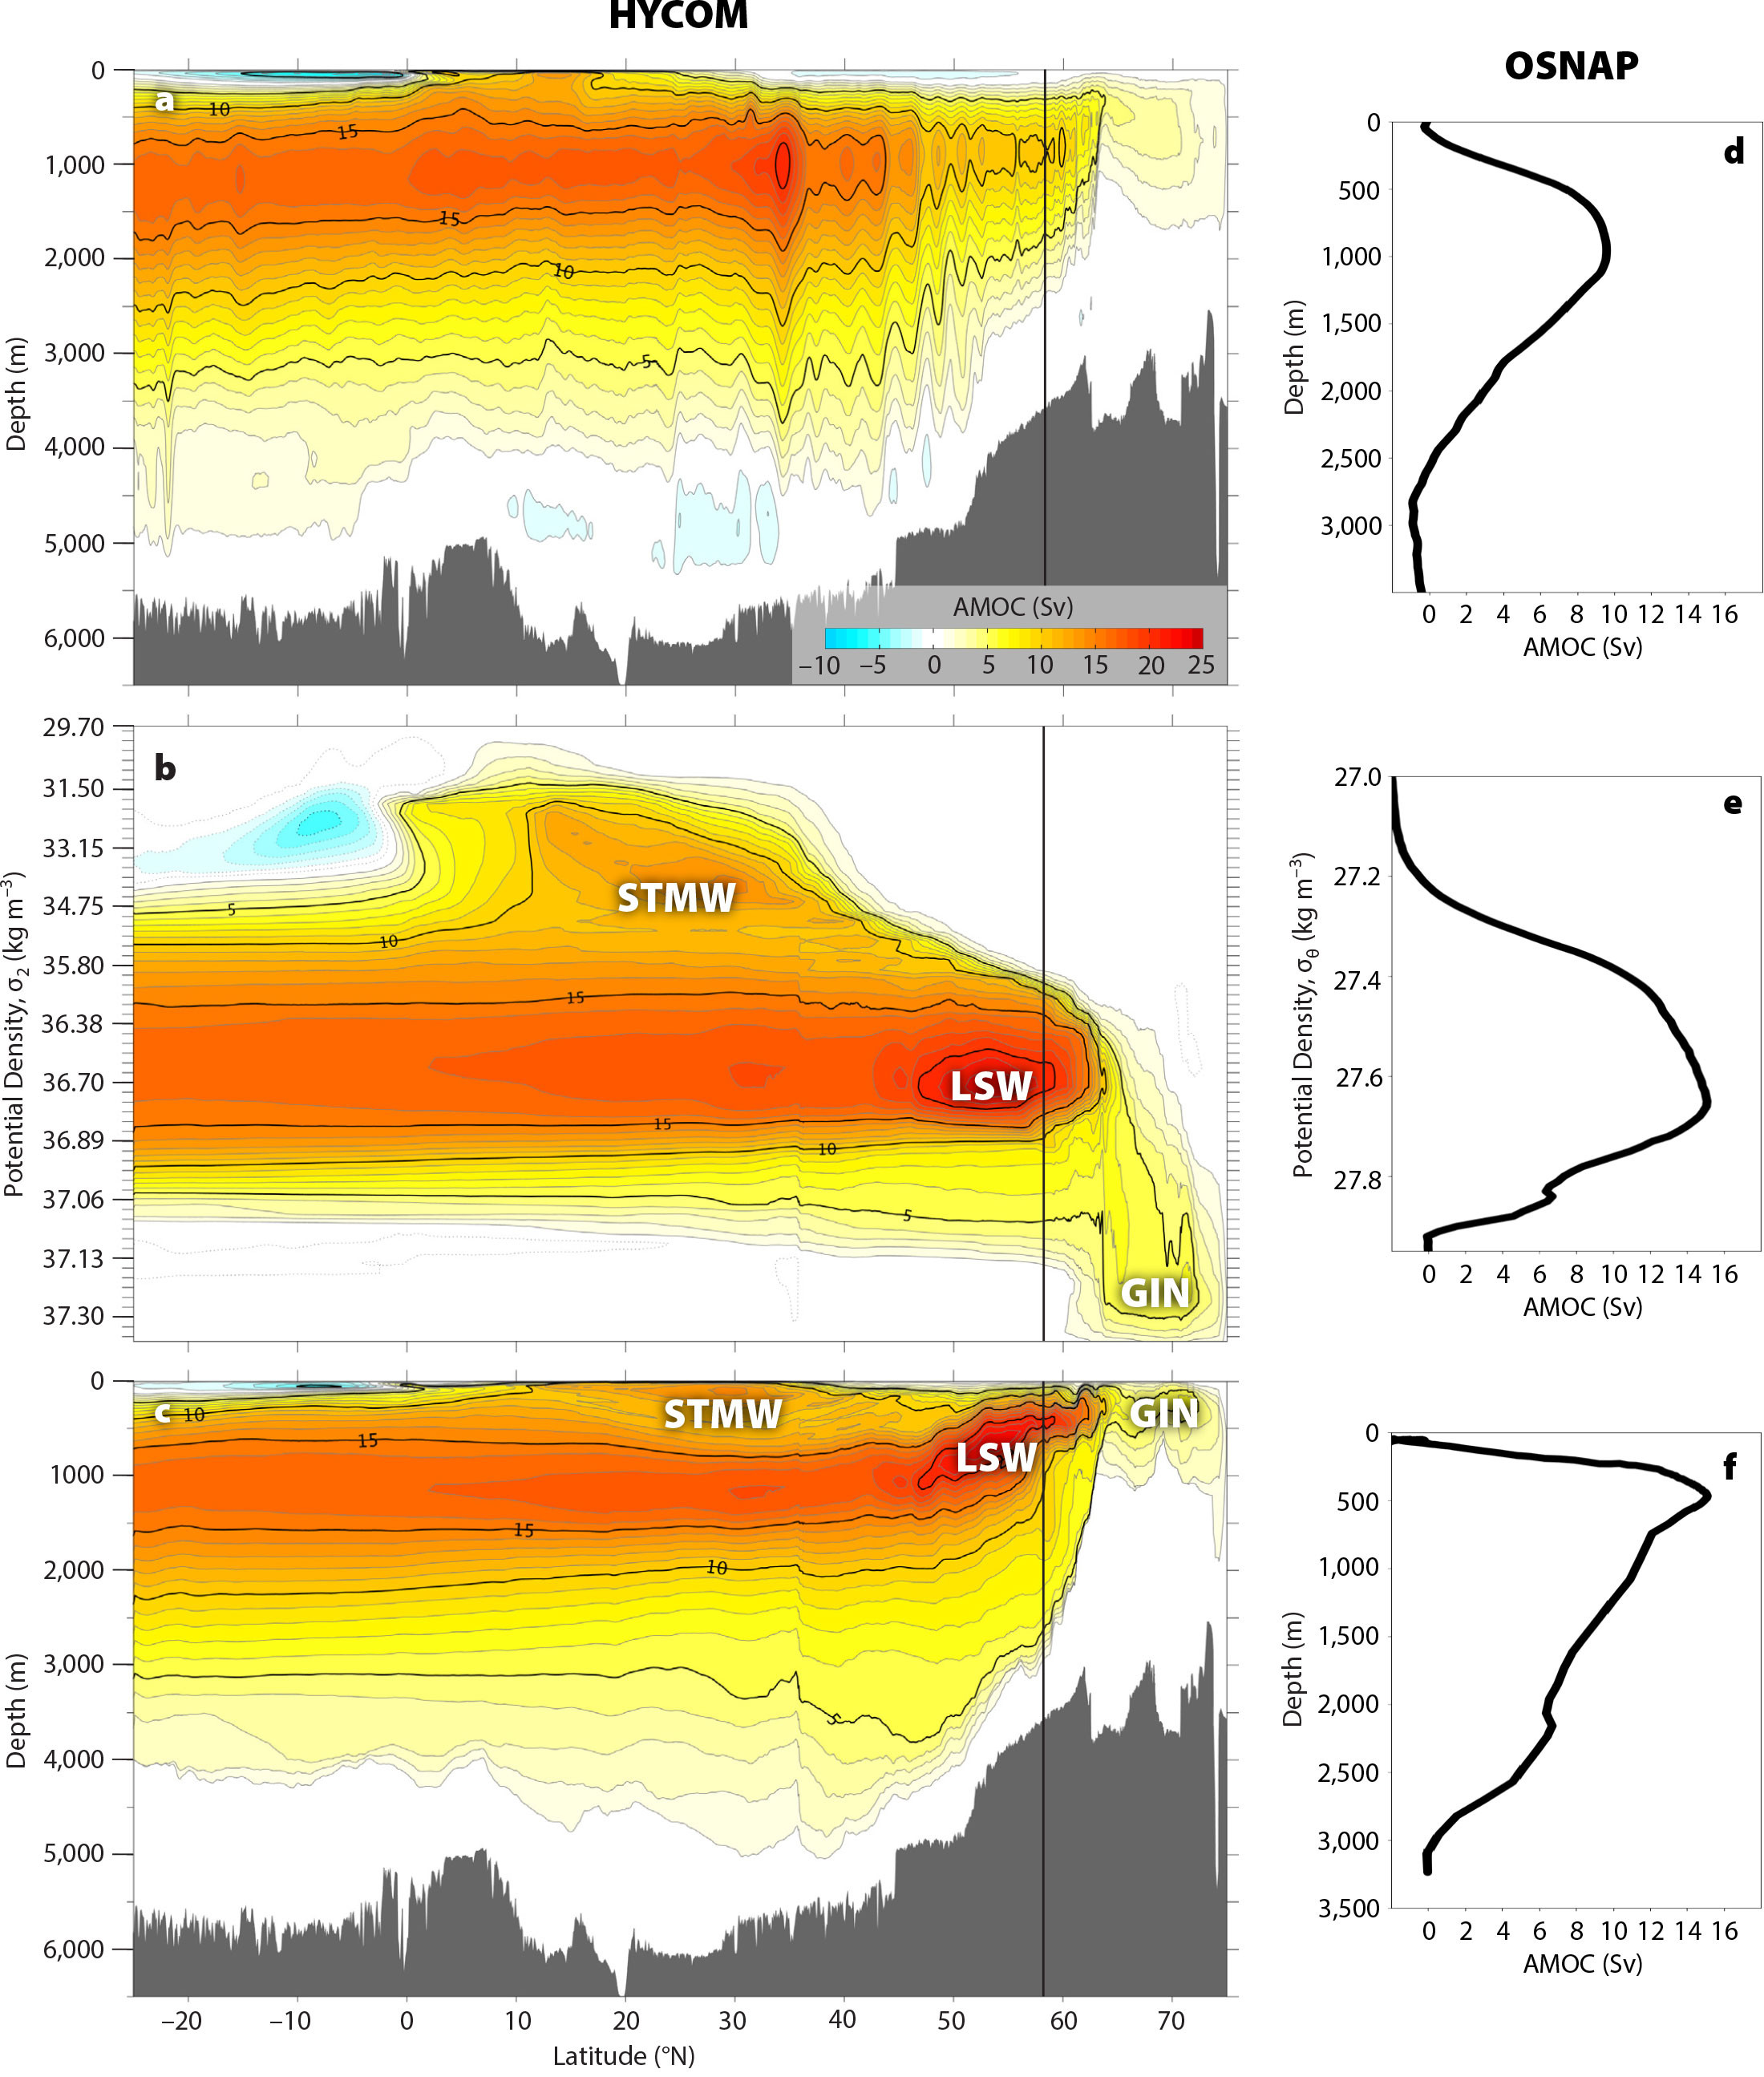
FIGURE 2. (a–c) The time-mean AMOC stream function from a 1/12° ocean simulation (HYCOM), and (d–f) the first four years of data from the OSNAP mooring array (Li et al., 2021). The stream function is shown in depth coordinates (a,d), in density coordinates (σ2 in b and σθ in e), and in density coordinates remapped into depth space using the zonal mean depth of each density layer (c,f). In panels a–c, gray contours are shown every 1 Sv, and black contours are shown every 5 Sv. The vertical black line at 58°N depicts the approximate latitude of OSNAP, though OSNAP moorings span 53°–60°N. Note the nonlinear y-axis in panel b. Panels a–c are reproduced from Xu et al. (2018) with permission, ©American Meteorological Society. GIN = Greenland, Iceland, and Norwegian Seas cell. LSW = Labrador Sea Water cell. STMW = Subtropical Mode Water cell. HYCOM = HYbrid Coordinate Ocean Model. OSNAP = Overturning in the Subpolar North Atlantic Program. > High res figure
|
In depth coordinates, the STMW cell is only apparent in the upper 100 m between 10°N and 20°N, and the large amount of cooling and densification (4 kg m–3 between the northward and southward limbs) in this cell is lost (Figure 2b). This STMW cell in density coordinates corresponds almost exactly to the peak oceanic MHT from 0°–40°N (see Figure 3 in Ganachaud and Wunsch, 2003, and Figure 3 in Trenberth and Fasullo, 2017), implying that this cell is indeed important to the MHT (Talley, 2003; Johns et al., 2023; Tooth et al., 2024), one of the most societally relevant aspects of the AMOC. Similarly, the strength of the GIN cell (4 Sv) in depth coordinates is underrepresented compared to density coordinates (6 Sv), and its importance to forming the densest water masses that spill over the Greenland-Scotland Ridge and fill the deep North Atlantic is not conveyed in depth coordinates.
The AMOC stream function in density coordinates also produces a more continuous cell that continues northward into the subpolar North Atlantic, where the majority of the southward limb waters are formed. In contrast, the depth space stream function shifts the maximum of the LSW cell into the subtropical gyre and away from the regions of deep-water formation in the subpolar North Atlantic and Nordic Seas. This southward shift of the maximum AMOC is due to the inability of the depth space AMOC to capture the horizontal circulation. For example, consider that in depth coordinates, the southward flow of cold, fresh waters in the Labrador Current is negated by the northward flow of warm, saline water in the North Atlantic Current. When these two currents meet near the Grand Banks of Newfoundland, the cold, fresh water subducts under the warm, saline water and the two limbs project back onto the vertical dimension. But this process yields a sharply discontinuous AMOC stream function in depth coordinates north of 35°N (Figure 2a). Instead, summing the meridional velocity fields in density classes highlights the water mass transformation that occurs as the water circulates cyclonically around the subpolar North Atlantic (Chafik and Rossby, 2019; Desbruyères et al., 2019) and produces a more continuous AMOC stream function between the subtropical and subpolar North Atlantic (Figure 2b).
The AMOC stream function in density coordinates also differentiates between overturning cells that are confined to one gyre and the overturning cell that crosses gyre boundaries. The AMOC is not meridionally coherent (Lozier et al., 2010), and it is difficult to represent the wider North Atlantic circulation using a single metric (i.e., the traditional maximum stream function in depth coordinates). This metric is located in the subtropics in depth coordinates, but the maximum transport is consistently found at higher latitudes in density coordinates (Biastoch et al., 2021). This distinction becomes essential when assessing forcing mechanisms of AMOC variability. The mechanisms driving the AMOC at subtropical and subpolar latitudes of the North Atlantic are timescale dependent (Jackson et al., 2022). While wind and buoyancy forcing are both considered important at higher latitudes on interannual-to-decadal scales, in the subtropics wind forcing alone can explain a substantial portion of the variability (Yang, 2015), especially on seasonal-to-interannual timescales (Moat et al., 2020). Opposing wind stress variability induced by the North Atlantic Oscillation in the subpolar and subtropical ocean can lead to opposing decadal AMOC variations, which indeed breaks the notion of a single metric diagnosing the basin-scale overturning cell (Lozier et al., 2010). This result can be understood in density coordinates because the recirculation cells depicted in the density-space stream function identify features that are confined to specific latitudinal ranges and should not be expected to be meridionally coherent.
Practical Considerations
The AMOC stream function in density coordinates is not intuitive—it is not clear where the various cells are located in the water column, and the typical conveyor belt analogy becomes convoluted when the isopycnals slope zonally. Thus, how to visualize the AMOC in density space and communicate it to wide audiences is vital to facilitating its widespread adoption. This can be done by remapping the stream function in density space into depth coordinates at the depth of each density layer. Practically, this process involves calculating the zonal-mean depth of each isopycnal at every latitude, and then plotting the values of the density-space stream function at those depths (Figure 2c,f; e.g., Lumpkin and Speer, 2007). Further information on this coordinate system transformation is included in the online supplementary materials. This process yields a stream function that more accurately connects the size of the feature in the ocean with the size of the circulation feature in the figure and makes the results more immediately understandable to a wider audience.
Another practical consideration is that shifting the RAPID AMOC time series from depth to density coordinates could cause a discontinuity in the time series. Fortunately, the maximum of the AMOC stream function at RAPID is not sensitive to the choice of coordinate system (Smeed et al., 2024), so shifting coordinate systems should not affect the time series considerably. Nonetheless, reporting the RAPID time series in both density and depth coordinates will ensure consistency in this important metric. Measuring the AMOC in density coordinates is also more costly because it requires knowledge of the full time-evolving velocity and density fields, while defining the AMOC in depth space can be done with relatively few moorings spaced across a zonal line and using geostrophy (Frajka-Williams et al., 2023). These cost savings have allowed RAPID to continue uninterrupted for two decades. However, density coordinates at the RAPID line depict the STMW cell—the RAPID stream function in depth space essentially misses an opportunity to provide direct in situ data about the STMW cell that carries over one-third of the oceanic MHT at these latitudes (Talley, 2003; Tooth et al., 2024). Argo floats provide temperature and salinity fields across most of the array, thus the majority of the practical concerns can be readily addressed without increasing the costs.
The modeling and reanalysis literature is also split between density coordinates and depth coordinates. Output from the various CMIP models contain an AMOC variable that is defined in depth coordinates, and recalculating this variable in density coordinates would require accessing each models’ velocity and density fields. Repeating this calculation for tens of models, each with various runs spanning hundreds of years, is prohibitive for most users (e.g., Weijer et al., 2020; Jackson and Petit, 2022), and thus it is recommended that models produce a density-space AMOC variable as part of their standard outputs.
Conclusions
- The use of dual definitions impedes progress in understanding AMOC dynamics because results are not directly comparable between studies.
- Widespread adoption of the AMOC in density coordinates will promote progress in the field because this definition is more informative of the three-dimensional circulation structure and more closely aligned with the AMOC’s climatic influence through MHT. Accordingly, the commonly used terms “upper limb” and “lower limb” should be replaced with “northward limb” and “southward limb.” In addition, re-mapping the density-space AMOC into depth coordinates enables more straightforward interpretation of results.
- Where possible, observational arrays should produce AMOC values in density coordinates. To provide consistency through time, publishing both density space and depth space AMOC values at the existing arrays is recommended.
- The modeling community should establish the density-space AMOC stream function and the remapped version in depth coordinates as standard output variables, as is currently true of the depth-space AMOC stream function.
Acknowledgments
We thank Mike Spall, Isabela Le Bras, and three anonymous reviewers for their comments on the manuscript, Natalie Renier in the WHOI Creative Studio for her help producing Figure 1, and Xiaobiao Xu for his help producing Figure 2. N.P. Foukal was supported by the Andrew W. Mellon Foundation Endowed Fund at the Woods Hole Oceanographic Institution and grant OCE-2123128 from the National Science Foundation. L. Chafik acknowledges support from the Swedish National Space Agency through the ECO2NORSE project (Dnr 2022-00172).
