Introduction
Global change (GC) due to increasing CO2 and other greenhouse gases is perhaps the overarching challenge of our time (IPCC, 2014). GC is manifested in the atmosphere and ocean; increasing ocean stratification, deoxygenation, and acidification; and disruption of ecological systems, among other things. Understanding ecological responses to GC requires long-term biological and environmental data sets (Poloczanska et al., 2008; Brown et al., 2011). In the late 1990s, such data sets were rare, so a major long-term goal of the Partnership for Interdisciplinary Studies of Coastal Oceans (PISCO) was targeting GC ecological impacts. However, natural climatic variability such as the El Niño-Southern Oscillation (ENSO), the North Pacific Gyre Oscillation (NPGO), and the Pacific Decadal Oscillation (PDO) complicates efforts to identify anthropogenic GC effects (Francis and Hare, 1994; Di Lorenzo et al., 2008; Brown et al., 2011). Moreover, GC also alters ENSO frequency and intensity (Cai et al., 2018; Ham, 2018) and possibly also NPGO and PDO (e.g., Zhang and Delworth, 2016). These natural patterns and GC have a common feature—they directly or indirectly alter thermal regimes, with alternating warmer- and colder-than-average water and air temperatures. Thus, investigating ecological responses to the shorter-term climatic variability, ideally coupled with mechanistic physiological research, may provide insight into likely coastal ecosystem responses to GC.
Rocky intertidal and subtidal ecosystems are ideal model systems for investigation of impacts of GC. They are dominated by organisms with research-favorable traits, including relatively short generation times, sessile or sluggish mobility, mostly small size, ease of observation, and, in the intertidal, amenability to experimentation. Benthic habitats in the California Current Large Marine System (CCLME) have been relatively intensely investigated, enabling pursuit of timely research questions.
Below, we summarize responses of key CCLME processes to climatic modes like ENSO, NPGO, and PDO, examine research into how intertidal organisms deal with physiological stress, and summarize the 2013 sea star wasting event and its consequences.
Climatic Variability and Inner Shelf Ecosystems
Upwelling—the wind-driven injection of deep, cold, salty, nutrient- and CO2-rich, and O2-poor water from depth to coastal ecosystems (Huyer, 1983)—is the dominant feature of Eastern Boundary Upwelling Systems (EBUS; Chavez and Messié, 2009; Checkley and Barth, 2009) such as the CCLME. How sensitive is benthic community structure to climatic variability relative to thermal, nutrient, and chemical changes occurring during upwelling? This issue is complex: upwelling, storm surge, and temperatures are all reflections of climate, including natural multi-year patterns and anthropogenic-driven components. For example, as verified by recent evidence (Garcia-Reyes and Largier, 2012; Iles et al., 2012), upwelling intensity increases with GC (Bakun, 1990). Analyses of model climate projections suggest that upwelling will last longer and be more intense by 2100 in most EBUS under business-as-usual scenarios (Wang et al., 2015). Increasing wave heights consistent with climate change predictions have also been documented (Ruggiero et al., 2010). Such complications challenge efforts to sort GC-driven from naturally occurring variation.
Globally, mussels and barnacles are dominant components of temperate rocky intertidal communities (Lewis, 1964; Stephenson and Stephenson, 1972). Mussels in particular are critically important elements in these systems, dominating space on the shore, harboring enormously diverse biota (Lafferty and Suchanek, 2016), and supporting abundant and functionally important apex predators (Paine, 1974, 1994; Robles et al., 2009). Hence, understanding links between oceanic conditions and sessile invertebrate performance is critical in forecasting potential future climate-related changes.
Impact of Natural Climate Variation on Ecological Subsidies
As summarized in Menge et al. (2019, in this issue), ecological subsidies (inputs of nutrients, propagules, and particulate food from pelagic environments) vary with coastal oceanic conditions. To explore the dependence of ecological subsidies on climatic variation, we built on data sets collected in the period from 1989 to 1998, prior to PISCO’s beginning in 1999. Compared to the 1990s, in the 2000s phytoplankton and mussel recruit subsidies increased by orders of magnitude (Menge et al., 2009). Further, phytoplankton and mussel recruitment phenologies shifted to earlier and later in the year, respectively. These changes correlated with the 10- to 15-year NPGO (e.g., Figure 1). Mussel recruitment also increased with phytoplankton abundance, suggesting an important bottom-up effect on the supply of mussels to rocky shores. Remarkably, these relatively local supply-side measures were sensitive to long-term, ocean basin-scale climatic fluctuation (Figure 2), suggesting likely future alterations of local-scale inputs with changing climate (Menge et al., 2009).
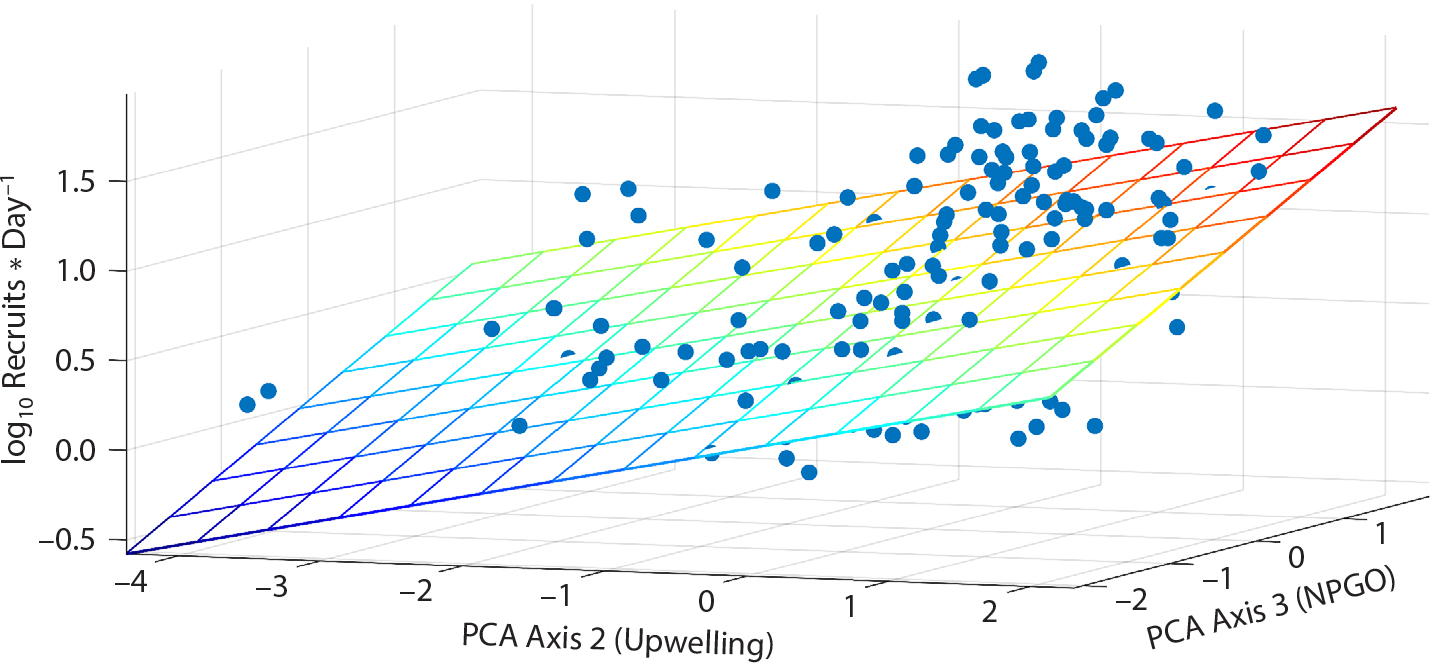
Figure 1. Multiple linear regression describing Mytilus spp. recruitment in relation to upwelling on PCA axis 2 (loading = 0.96) and North Pacific Gyre Oscillation (NPGO) on PCA axis 3 (loading = 0.82) (adjusted R2 = 0.300, p < 2.2 × 10⁻¹⁶). PCA = Principal Component Analysis. From Menge et al. (2011). > High res figure
|
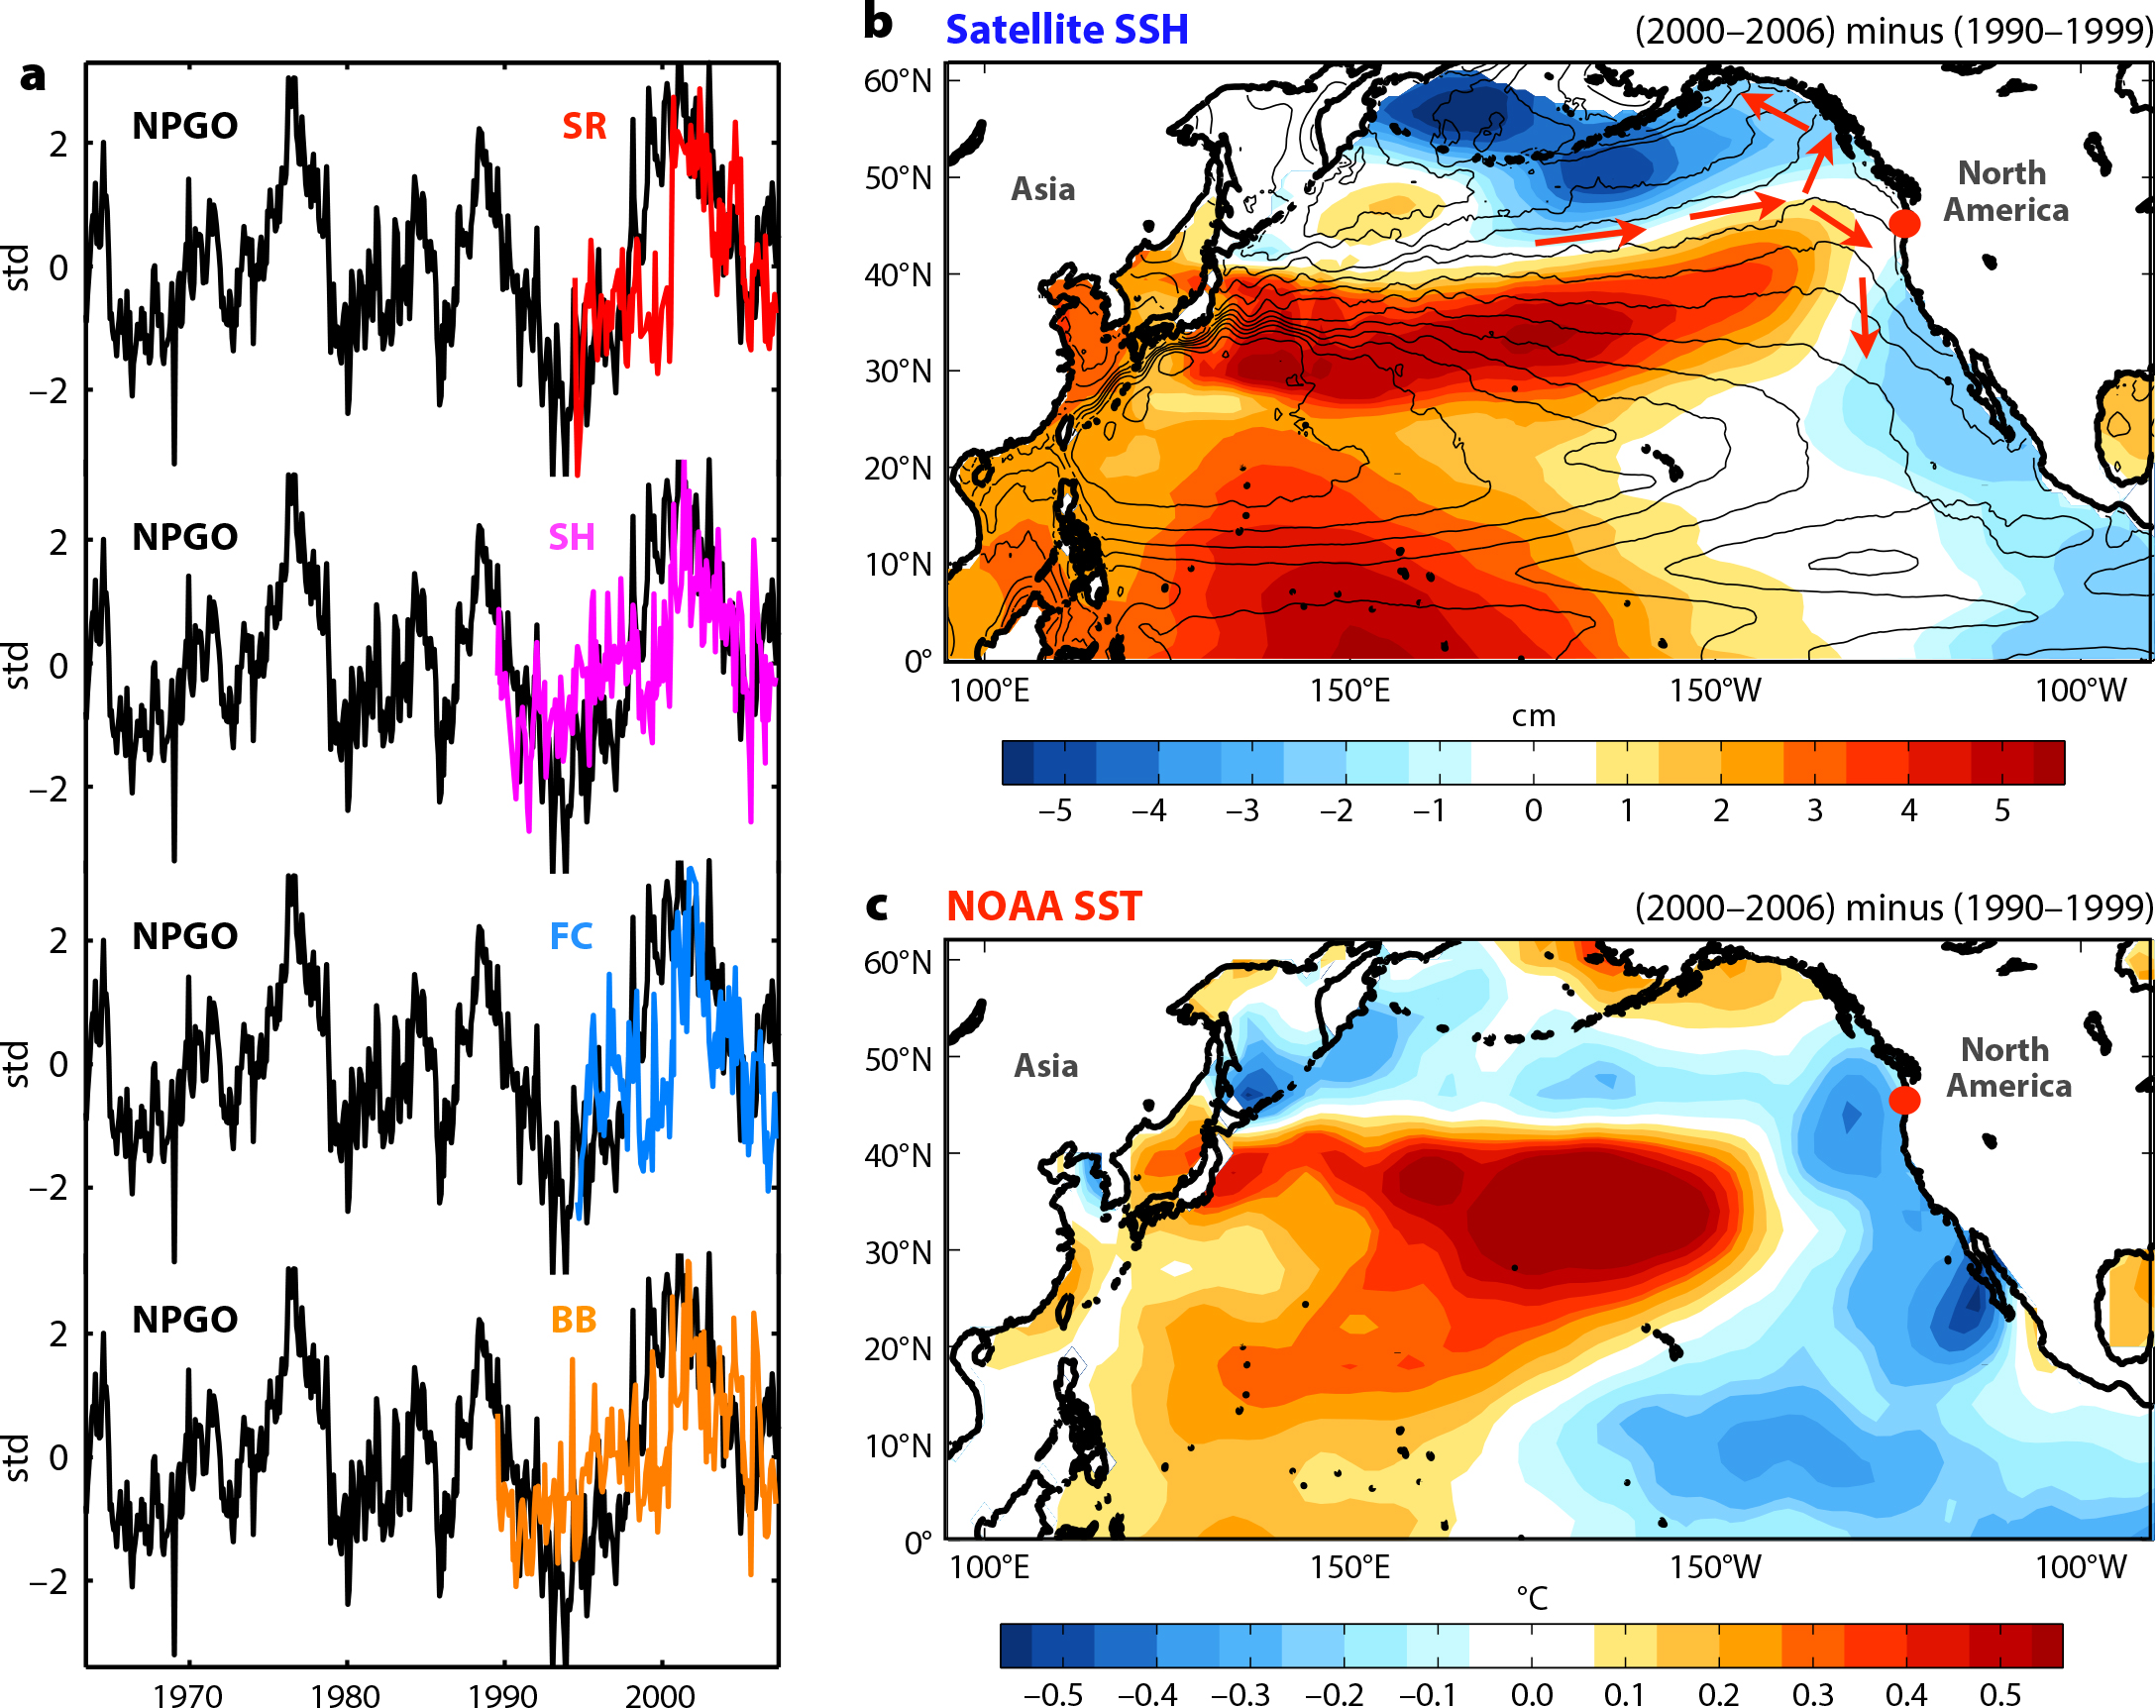
Figure 2. (a) Time series of normalized mussel recruitment at four locations (Seal Rock: 44.50°N, 124.08°W; Strawberry Hill: 44.25°N, 124.115oW; Fogarty Creek: 44.84°N, 123.97°W; and Boiler Bay: 44.83°N, 124.06°W) compared to the North Pacific Gyre Oscillation (NPGO) index. The time series are normalized by their standard deviation (std; the y-axis scale numbers indicate the actual standard deviations of the NPGO index, by which the index is standardized). (b) Difference in satellite sea surface height (SSH) between the periods 2000–2006 and 1990–1999 (shaded colors) and mean SSH (black contours). The strong dipole of SSH in the Northeast Pacific indicates an intensification of the North Pacific Current and its branches along the eastern boundary (red arrows), which is consistent with the positive phase of the NPGO. (c) Same as (b) for the NOAA sea surface temperatures (SST). From Menge et al. (2009). > High res figure
|
Using a longer (1989–2009) data set, we found that upwelling and multiple climate modes (ENSO, NPGO, PDO) influenced barnacle (Balanus glandula and Chthamalus dalli) and mussel (Mytilus spp.) recruitment (Menge et al., 2011). However, recruitment of all species varied most strongly with the NPGO and upwelling (Figure 3). Overall, large-scale climate and upwelling variability explained 37%–40% of recruitment variance across the central to southern Oregon coast.
In 2005, coastal upwelling onset was delayed by ~1 month, and was weak early and strong late in the season (Barth et al., 2007). Consequently, coastal waters were warmer, had low nutrient levels, low levels of primary production, and low barnacle and mussel recruitment. Whether these “intraseasonal oscillations” influence the northern CCLME more under GC remains to be seen, but the predicted northward movement of the atmospheric jet stream under GC influences their prevalence in this region (Meehl et al., 2007).
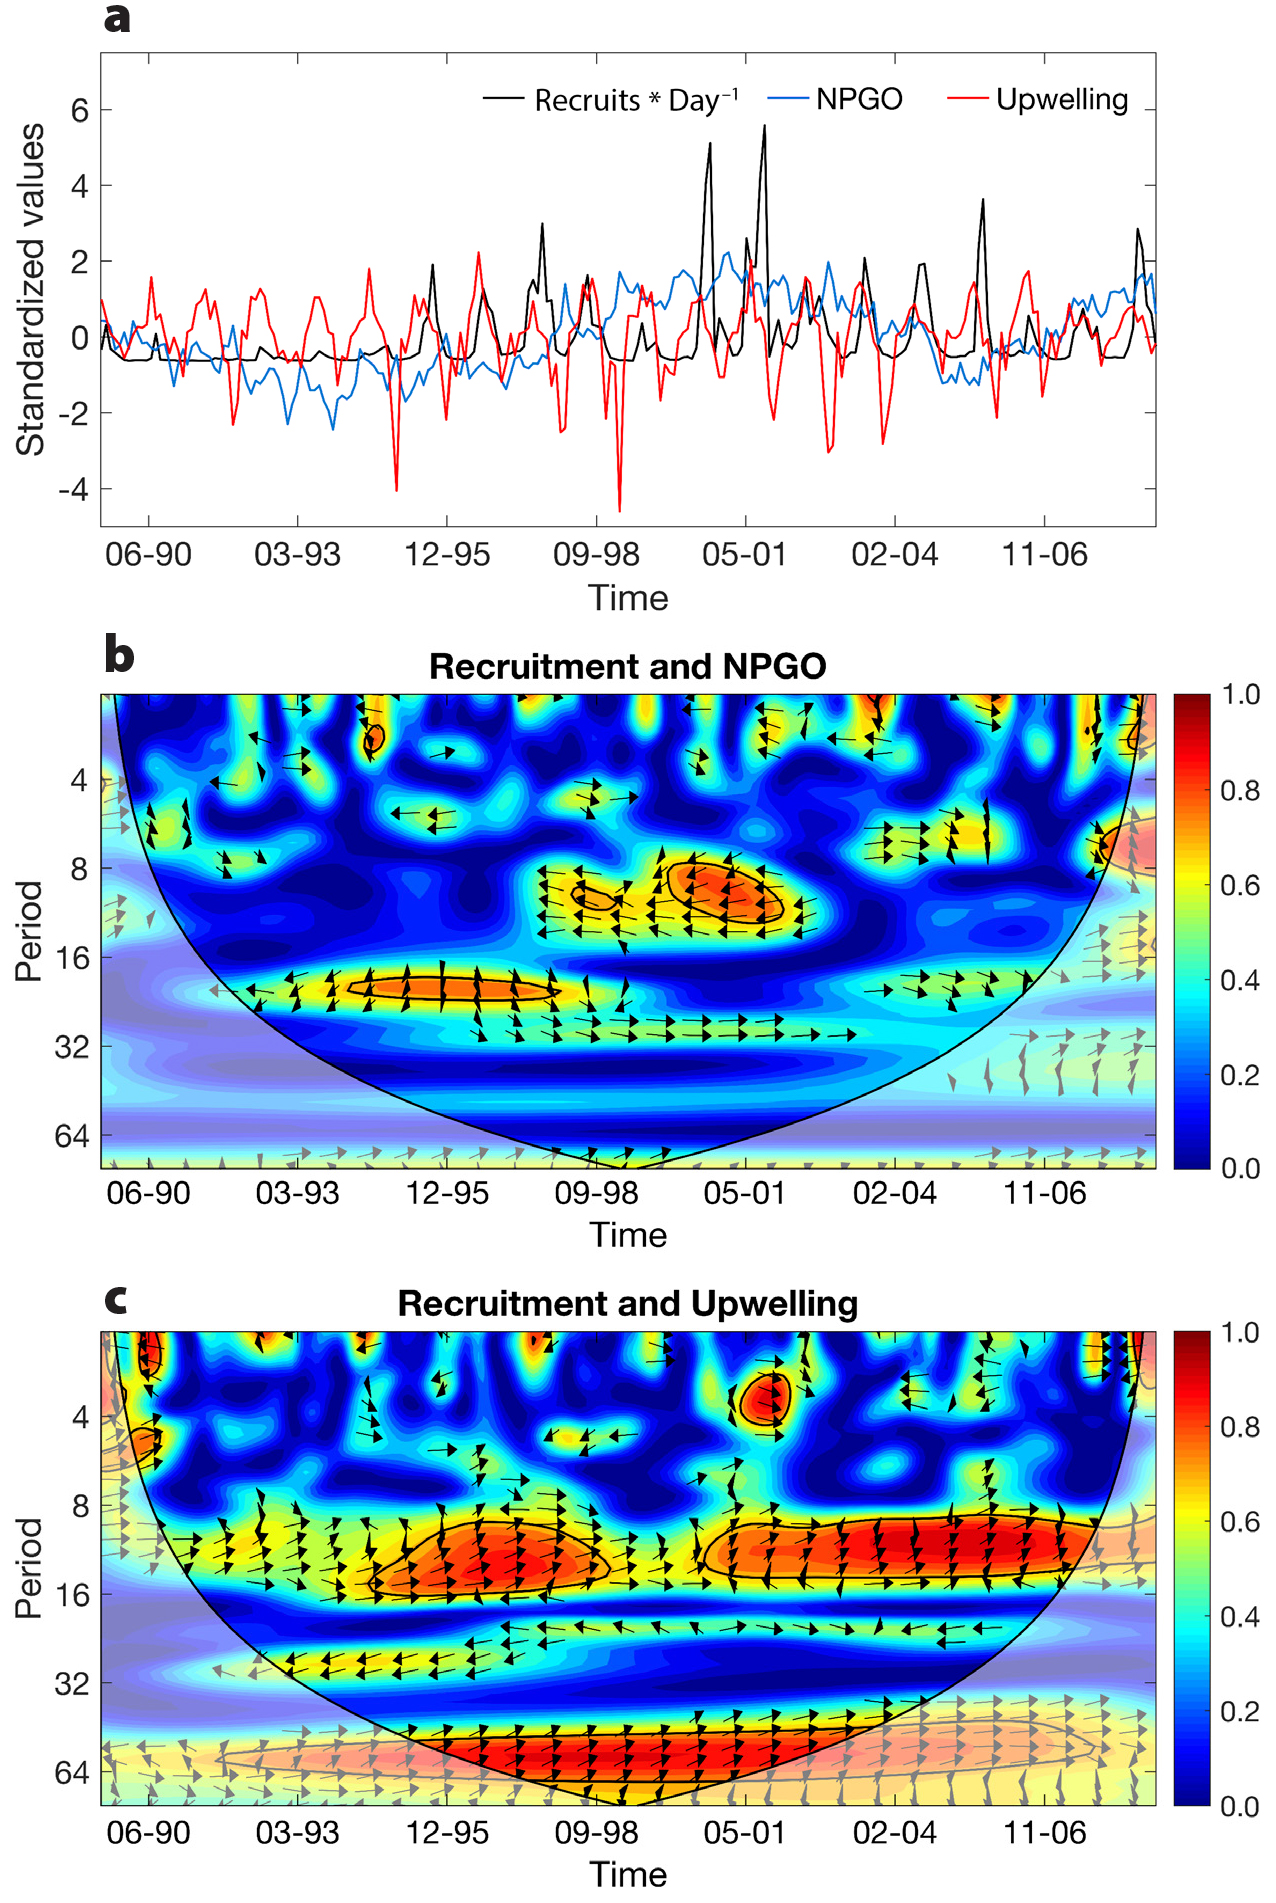
Figure 3. (a) Standardized time series and pairwise wavelet coherence of Mytilus spp. recruitment, (b) NPGO, and (c) upwelling from 1989 to 2008 (month-year on x-axis). Period (y-axis) is in months, so for the NPGO, red blobs indicate correlations of mussel recruitment at periods of, for example, ~12 months (05-01) and ~24 months (12-95). Wavelet coherence describes the amount of correlation (color bar; 0 = blue, no correlation; 1 = dark red, complete correlation) in the fluctuations of two time series, in this case the NPGO and mussel recruitment. Black arrows indicate the phase angle between the fluctuations of the two time series. Arrows pointing to the left indicate anti-phase (inverse) fluctuations, whereas arrows pointing to the right indicate in-phase (positive) fluctuations. Black contour lines indicate regions in which the observed wavelet coherence values are statistically significantly (α = 0.05) based on Monte Carlo randomizations applied to 1,000 pairs of surrogate time series whose first order autoregressive coefficients match those of the original time series. Translucent areas represent the “cone-of-influence” where edge effects can influence the analysis. From Menge et al. (2011). > High res figure
|
Impact of Natural Climate Variability on Secondary Production
To determine the responses of intertidal organisms to oceanic processes during their benthic, adult stages, Sanford and Menge (2001) investigated barnacle growth rates of two abundant intertidal species, B. glandula and C. dalli, in relation to upwelling-driven differences in phytoplankton and zooplankton abundances and thermal conditions. They found that these factors jointly explained differences in barnacle growth. Increased growth in response to phytoplankton blooms was observed, but also occurred post-blooms, when zooplankton abundances (e.g., crustacean larvae) and temperatures were relatively high (Sanford and Menge, 2001), suggesting these barnacles were omnivorous.
Mussel growth in relation to environmental variation was similarly context-dependent (Blanchette et al., 2007; Menge et al., 2008). Around Point Conception, California, intertidal mussel growth increased southward with temperature (Figures 4 and 5). Further, in contrast to intertidal mussels (faster growth south of Point Conception), mooring mussels grew equally fast around the Point (Figure 5). Blanchette et al. (2007) suggested that similar growth rates of submerged mussels were likely a reflection of opposing gradients in temperature (warmer southward) and food (higher northward).
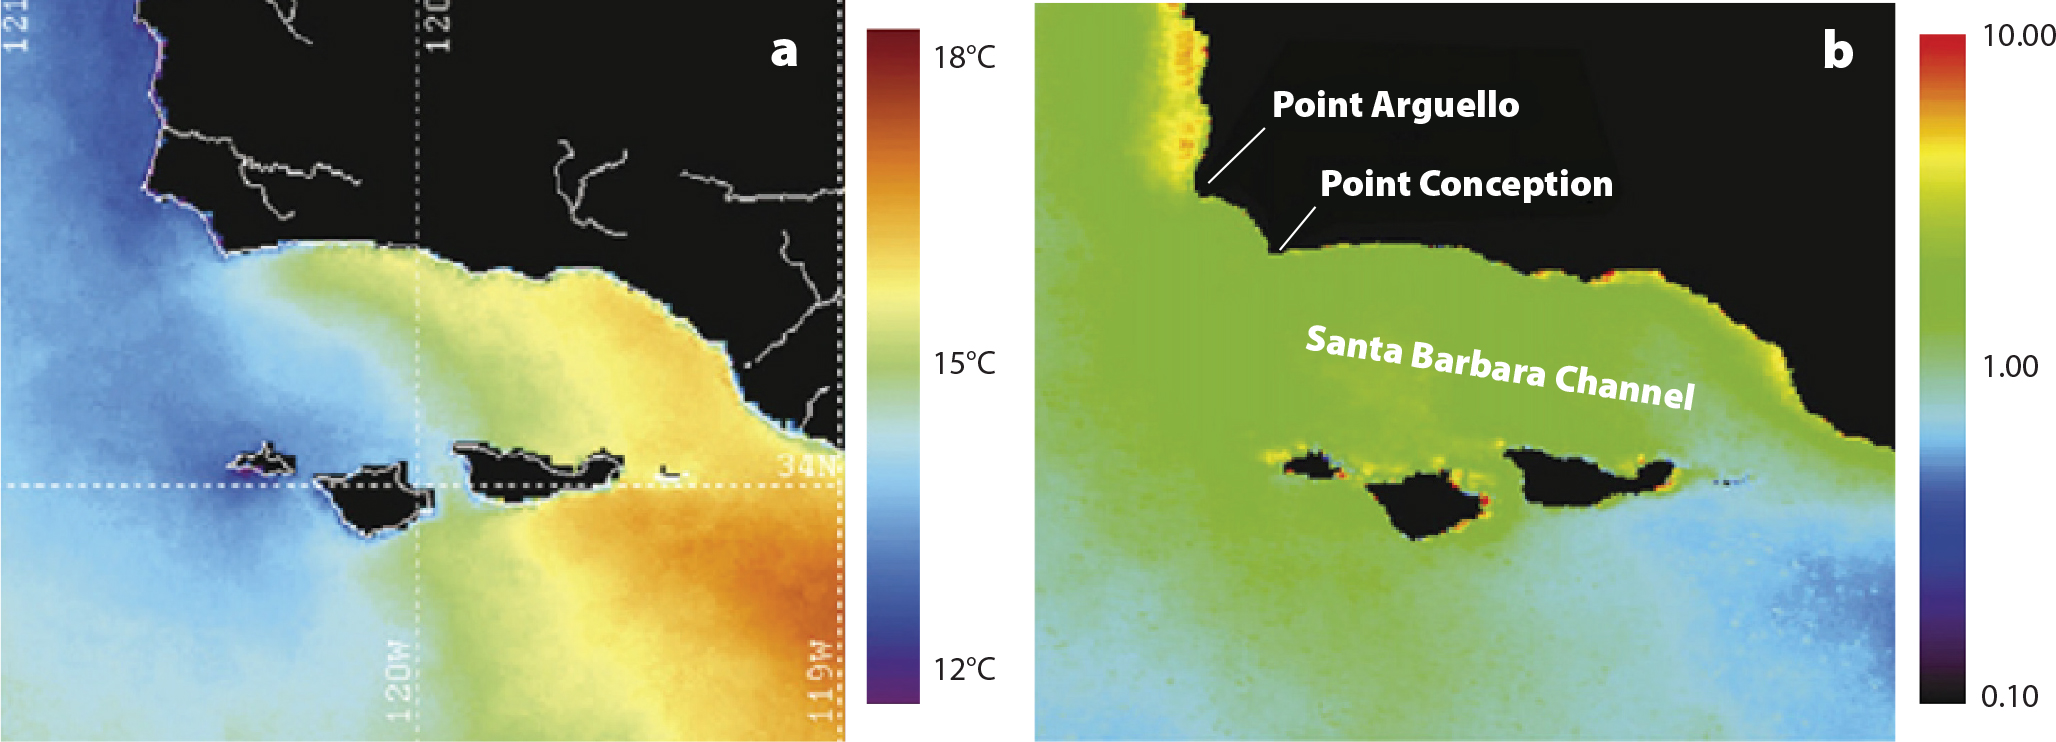
Figure 4. Representative seasonal composite satellite images of (a) sea surface temperature, and (b) chlorophyll-a (in mg m–3, from SeaWIFS) from summer 2000. Note the sharp discontinuity in temperature around Point Conception and the high concentration of offshore chlorophyll-a north of Point Arguello relative to the Santa Barbara Channel. Images created by Mark Otero, ICESS, UCSB. From Blanchette et al. (2007). > High res figure
|
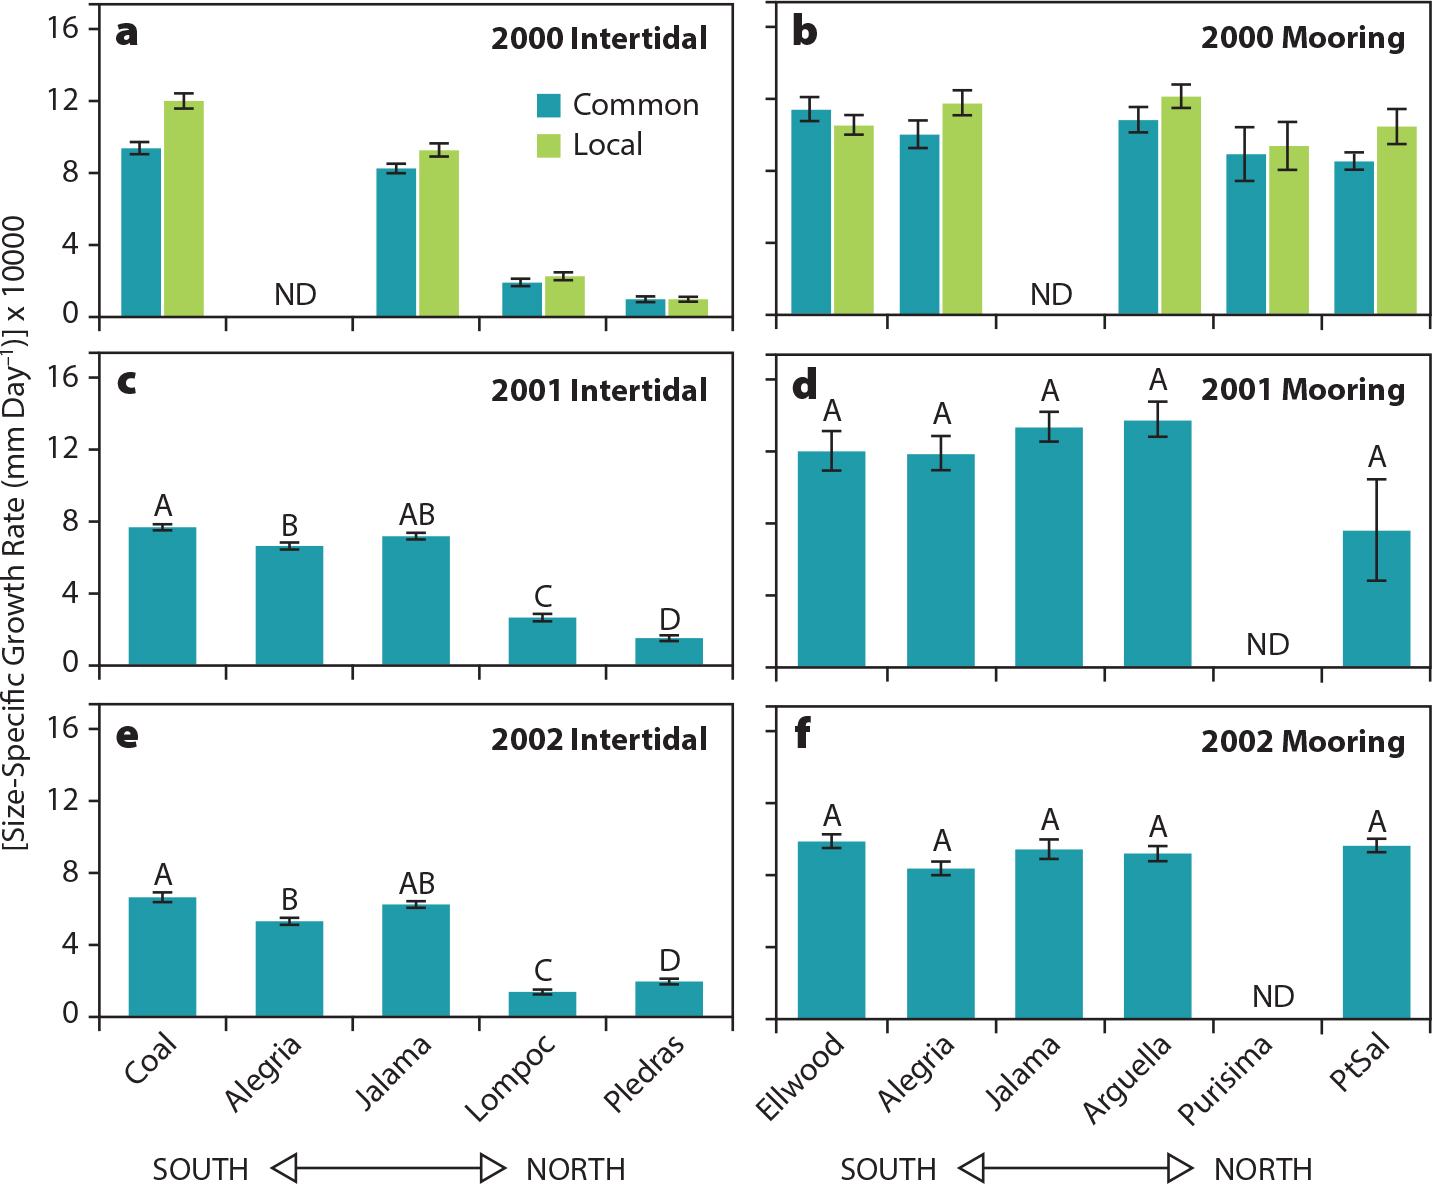
Figure 5. Size specific growth rates (mm/day × 10,000) for mussels from mussel growth experiments in 2000 (a and b), 2001 (c and d), and 2002 (e and f) from intertidal sites (a, c, and e) and mooring sites (b, d, and f). In (a) and (b), we were interested in comparing growth of mussels from a single, common source (dark green bars; site near Santa Cruz, California) to that of mussels from the specific site of the experiment (light green bars). In panels (c–f), we used only mussels collected from the single common intertidal source, so all bars are dark green. Intertidal and mooring sites are arranged from the southernmost site on the left to the northernmost site on the right. ND = no data for some sites/years. Data are site means ±1 standard error of the mean. Means with different letters (A, B, C, D) above the bar are different at α = 0.05 based on Tukey-Kramer multiple comparisons. From Blanchette et al. (2007). > High res figure
|
In Oregon, mussel growth varied with both short-term ENSO- and long-term PDO-influenced temperature and food abundance (Menge et al., 2008; Figure 6). In the 1990s, mussel growth rates were slower at less productive sites than they were at more productive sites, but in the 2000s, growth rates increased at the less productive sites to levels seen at the more productive sites. Mussel growth at less productive sites was slower during cool phases of ENSO and PDO and faster during warm phases, but did not vary among the more productive sites. Both temperature (variance explained = 32%) and phytoplankton (variance explained = 12.5%) were climate-driven proximate factors underlying mussel growth rate differences.
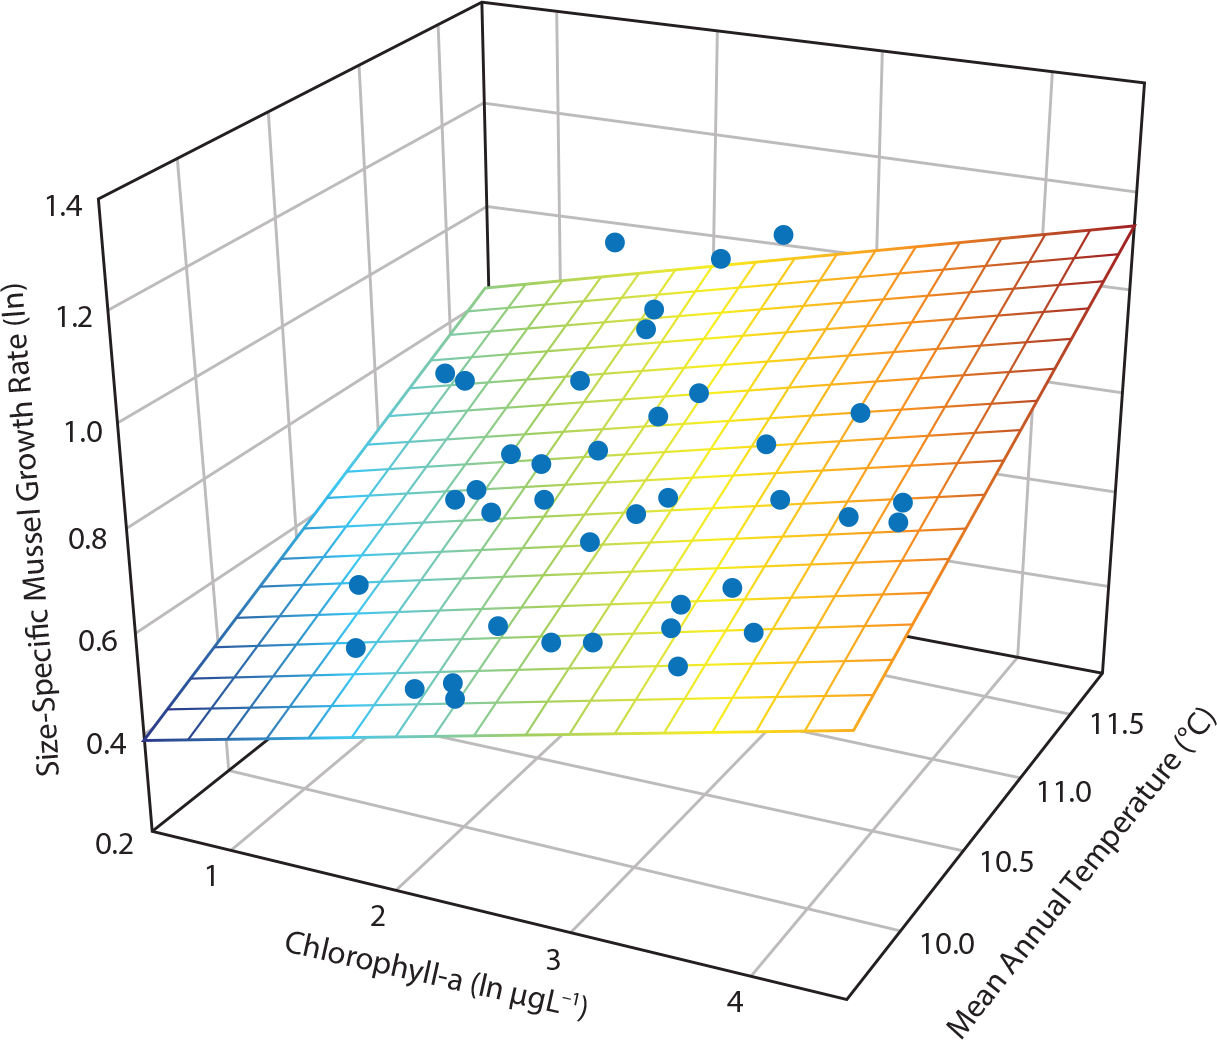
Figure 6. Influence of food availability (proxied by chlorophyll-a) and temperature (mean annual growing season, June through the following May) on growth of Mytilus californianus. Statistics are from a multiple least squares regression test. Regression is mussel growth = −2.53 + (0.081 × (chl-a) + (0.293 × temperature); F = 14.2, p <0.001, adj R2 = 0.44, n = 39. From Menge et al. (2008). > High res figure
|
Mechanistic Insight into Organismal Responses to Climate Change: Large-Scale Eco-physiological Approaches
Anthropogenic GC increases traditional stresses on marine organisms and also creates new ones (Somero, 2012). Such stresses have population, community, and ecosystem consequences, so understanding biological system responses is an essential aspect of climate change research (Poloczanska et al., 2008; Doney, 2010; Somero, 2012).
The mussel M. californianus spans a broad vertical range on relatively wave-exposed shores along most of the North American west coast. Hence, it exhibits increasing thermal stress with increasing height on the shore (Gracey et al., 2008; Petes et al., 2008a,b). Further, it is exposed to a broad wave-exposure range, from wave-beaten headlands to gently wave-swept coves, so thermal stress increases as wave splash decreases (Dahlhoff et al., 2002). In response to increased stress (higher on the shore, in more protected shore areas), several researchers documented increases in mussel physiological responses. Specific responses were observed in heat shock proteins and ubiquitin (Halpin et al., 2002, 2004), heart rate (Braby and Somero, 2006), carotenoid concentration (Petes et al., 2008a), and gene expression (stress response genes; Gracey et al., 2008; Place et al., 2011).
Integration of physiological and ecological approaches has led to valuable insights into the physiological responses of key species such as mussels, whelks, and sea stars to joint influences of thermal stress and food abundance. For instance, among-site differences in growth of mussels (M. californianus) observed in Oregon (Menge et al., 2008) were based on differences in metabolic enzymes (citrate synthase and malate dehydrogenase) and protein synthetic capacity (RNA:DNA ratios; Dahlhoff and Menge, 1996). This difference was highly plastic: the physiology of reciprocally transplanted mussels quickly converged with that of resident mussels (Dahlhoff and Menge, 1996). More recent research on gene expression (using microarrays) has shown that metabolic genes are up-regulated in M. californianus with increasing food (Gracey et al., 2008; Place et al., 2012; Somero 2012).
These examples suggest that mussel physiology appears exquisitely attuned to variable living conditions. Despite highly plastic physiological stress responses, however, GC, especially if it is rapid, can have severe impacts on the distribution and abundance of mussels. For example, Jones et al. (2009, 2010) documented a warming-related sharp contraction northward of the mussel M. edulis along the US mid-Atlantic coast. Similarly, Sorte et al. (2017) demonstrated a >60% decrease in mussel abundance along the New England coast over the past 30+ years.
Such results indicate that the consequences of oceanic variability can be seen even at the level of gene expression and thus will likely be sensitive to GC. Are consumers affected similarly? The consumer-stress model of environmental stress theory (Menge and Olson, 1990; Menge et al., 2002; Siddon and Witman, 2003) suggests that consumers are more stress-susceptible than their prey (i.e., there is a mobility-stress tolerance trade-off). Although consumer mobility enables survival by allowing movement to low-stress microhabitats, reduced activity leads to reduced consumption in more stressful environments. In contrast, sessile prey are fixed in place and must tolerate conditions or die, so would be expected to evolve greater stress tolerance.
Similar to the findings for mussels, both mobile predatory whelks and sessile barnacle prey showed greater metabolic activity, increased growth capacity, and enhanced production of stress proteins with increases in stress and food at scales ranging from meters to tens of kilometers (Dahlhoff et al., 2001, 2002). In contrast, sea stars (P. ochraceus) showed minimal physiological response to thermal stress (Dahlhoff et al., 2002; Monaco et al., 2016), but as predicted by theory, died when experimentally forced to live without access to shelter higher than normal on the shore (Petes et al., 2008b). Consistent with this result, other researchers have shown that P. ochraceus activity is sensitive to temperature, both cold and hot (Pincebourde et al., 2008, 2009, 2012; Sanford, 1999), and modifies its activity to minimize exposure to thermal extremes (Szathmary et al., 2009; Monaco et al., 2016).
Thus, research testing physiological responses to stress can provide critically important information useful in predicting responses of marine organisms to GC. Can they modify their physiology or behavior to adjust to the changing conditions? Because change is occurring relatively quickly, can they alter gene expression or genetically adapt quickly enough to persist (e.g., Somero, 2012)? The US east coast mussel example (Jones et al., 2009, 2010) is sobering, but temperature change there has been faster than at most places on Earth (Pershing et al., 2015). Further, thermal and wave size variation in coastal habitats is more extreme in the northwest Atlantic than in the northeastern Pacific (Menge and Sutherland, 1976). However, another stress, ocean acidification, is globally most severe in the northeast Pacific, posing an additional threat and complicating efforts to predict future ecosystem states based simply on thermal changes (Chan et al., 2017; see also Chan et al., 2019, in this issue).
Long-Term Data Sets Enable Detection and Interpretation of Ecological Surprises
In addition to their utility and importance for evaluating ecosystem responses to climate change, long-term data sets provide a critical context for understanding sudden, dramatic changes in species’ abundance. For example, in fall 2013, observers in British Columbia and southern California reported startling, massive die-offs of sea stars (Hewson et al., 2014; Stokstad, 2014). By spring 2014, this event had reached epizootic proportions, afflicting all 20+ species of sea star along the entire North American west coast (Hewson et al., 2014; Eisenlord et al., 2016; Montecino-Latorre et al., 2016; Harvell et al., 2019).
This was not the first sea star mass mortality event (Dungan et al., 1982; Menge, 1983; Eckert et al., 2000; Blanchette et al., 2005; Bates et al., 2009). However, it was unprecedented in two aspects: the spatial extent of the event was exceptionally large (thousands of kilometers of coastline), and it afflicted all sea star species, not just one. With collaborators in British Columbia, Washington, and Baja California, PISCO researchers immediately began (1) documenting the impact of the wasting disease on coastal sea star populations, (2) investigating sea star resilience to such massive losses, and (3) assessing impacts on intertidal and subtidal communities.
Combining contemporary surveys with prior time series (back to 2000 or earlier) showed that abundances of the sea star P. ochraceus decreased by 60% to 90% or more compared to long-term averages (Menge et al., 2016; Miner et al., 2018). This led to an immediate, sharp decline in the rate of predation on mussels (Menge et al., 2016). However, mussel response was more spatially variable and slower than expected (unpublished data from authors Gravem and Menge). Perhaps the most striking response was a dramatic but also spatially variable increase in sea star recruitment in spring 2015 (Menge et al., 2016; Miner et al., 2018; Moritsch and Raimondi, 2018). It led to increased sea star abundance, often to levels higher than before wasting, but because most of the stars were small, biomass recovery was slow (Menge et al., 2016; Moritsch and Raimondi, 2018). As of summer 2019, predation rate at most sites was still less than pre-2013. However, as expected, mussel abundance in the primarily macrophyte-dominated low intertidal has increased, displacing macrophytes at increasing numbers of sites (unpublished data from authors Gravem and Menge). At present, sea stars are losing the battle to mussels, but slowly enough that sea star populations may be able to recover sufficiently to prevent an alternative mussel-dominated low intertidal state.
In contrast, coastal populations of the subtidal sea star Pycnopodia helianthoides have been nearly extirpated with as yet no sign of recovery (Harvell et al., 2019). From shallow, kelp bed depths to 1,280 m water depth, this large sunflower star declined by 80% to 100% from Alaska through California, a ~3,000 km distance. Although the sunflower star is a diet generalist (Mauzey et al., 1968; Duggins, 1983), sea urchins are a primary prey. Prior small-scale experiments indicated that P. helianthoides predation could have cascading effects on kelp through predation on urchins, but the spatial generality of this effect was unclear (Duggins, 1983). However, community consequences of sea star wasting suggest P. helianthoides was indeed a keystone predator in kelp beds. The collapse of shallow-water populations evidently triggered sea urchin outbreaks in several locations, with subsequent reductions in kelp abundance through an indirect trophic cascade effect (Schultz et al., 2016; Burt et al., 2018). Unlike the P. ochraceus example, however, P. helianthoides loss apparently was not followed by a recruitment event of sunflower stars (Harvell et al., 2019). Although sea otters are also major predators of sea urchins (Estes and Palmisano, 1974; Estes and Duggins, 1995; Burt et al., 2018), otters are absent south of Cape Flattery, Washington, to the San Francisco Bay Area of California, and no other subtidal predator in this region seems capable of controlling sea urchin populations. This system is presently in a highly dynamic state, so the longer-term consequences of these changes will only be revealed with time, but it is clear that kelp domination is threatened.
Discussion
The impacts of variation in ENSO and PDO on marine pelagic ecosystems are well known (e.g., selected citations from an extensive literature include Barber and Chavez, 1983; Francis and Hare, 1994, Mantua et al., 1997; Chavez et al., 2003; Peterson and Schwing, 2003), as are, increasingly, effects of NPGO (Di Lorenzo et al., 2008; Chenillat et al., 2012; Sydeman et al., 2013). Coral reefs and kelp beds also suffer extensive damage during warming events (e.g., El Niño and marine heatwaves; Glynn, 1988; Wernberg et al., 2016; Hughes, et al. 2018). Effects on temperate marine benthic ecosystems, however, are mixed. For example, in his decades-long research on the Washington intertidal system, Paine (1986) found little detectable effect of the 1982–1983 El Niño. Navarrete et al. (2002) found little to no effect of the 1997–1998 El Niño on invertebrate recruitment in Chile. In contrast, kelp (Macrocystis pyrifera) beds were found to be highly sensitive to El Niño (Dayton and Tegner, 1984; Dayton et al., 1999), as was algal composition in the Galápagos (Vinueza et al., 2006, 2014), and barnacle recruitment was elevated in California during the 1997–1998 El Niño (Connolly and Roughgarden, 1999).
During PISCO’s existence, benthic processes such as recruitment and growth appeared responsive to climatic variation as expressed in ENSO, NPGO, and PDO. In these and all cases cited above, these responses seem likely to be primarily either positive or negative to thermal changes. Mussel and barnacle growth were faster under warmer conditions, and mussel and barnacle recruitment was increased by cool-water-associated increases in phytoplankton abundance. Further, these responses appear to be detectable at physiological and molecular levels, suggesting an approach that will facilitate prediction of future species’ responses to global change. Remarkably, these hard-bottom biological systems also respond to basin- to subregional-scale climatic variation across a wide range of spatial, temporal, and organismal scales, even down to the molecular level (see also Palumbi et al., 2019, in this issue).
Until recently, a hallmark of northeastern Pacific coastal ecosystems was consistency in local to large-scale patterns of abundance, distribution, diversity, and biogeography (Paine, 1986, 1994; Dayton et al., 1992). Although seasonal and short-term variability resulting from, for example, ENSO cycles was often dramatic, the system seemed resilient to such perturbations, typically recovering within a few months to years (Dayton et al., 1992). With global change, however, these systems appear to have entered a new phase characterized by greater variation in pattern and process, biogeographic shifts (see Sanford et al., 2019; Raimondi et al., 2019, in this issue), and often dramatic changes in the abundance of key species. Consequences of these changes are sometimes large and sometimes subtle or slow to occur (e.g., sea star wasting consequences exhibit both). PISCO data streams have been crucial in discovering, monitoring, and analyzing changes, and identifying coastal “hot” and “cold” spots, defined as areas that are more or less productive, respond to or rebound from change quickly or slowly, or are exposed to more or fewer extreme environmental variations (e.g., Guichard et al., 2003; Menge et al., 2004; Helmuth et al., 2006; Krumhansl et al., 2016; Chan et al., 2017). An era of unprecedented and difficult-to-predict change in coastal ecosystems is dawning, and with others (e.g., Poloczanska et al., 2008; Brown et al., 2011) we believe strongly that maintaining and evolving long-term, coupled research and monitoring programs is one of the most powerful tools available to deal with such challenges.
Acknowledgments
We thank the many research assistants, graduate students, postdoctoral scholars, and undergraduate interns who have contributed to our continually expanding understanding of CCLME dynamics. Research support was provided by the David and Lucile Packard, Gordon and Betty Moore, and Andrew W. Mellon Foundations, and the National Science Foundation. This is PISCO publication number 497.

